North America Freight Forwarding Market Size and Share
Market Overview
| Study Period | 2019 - 2030 |
|---|---|
| Forecast Data Period | 2025 - 2030 |
| Historical Data Period | 2019 - 2023 |
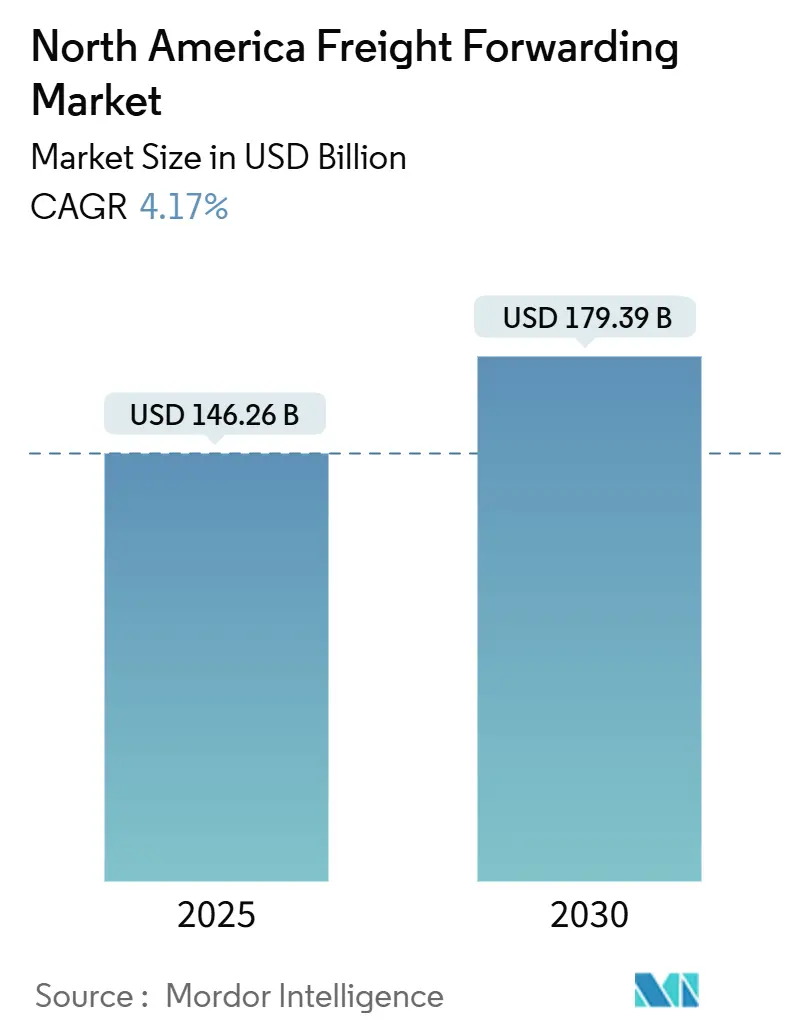
| Market Size (2025) | USD 146.26 Billion |
| Market Size (2030) | USD 179.39 Billion |
| Growth Rate (2025 - 2030) | 4.17% CAGR |
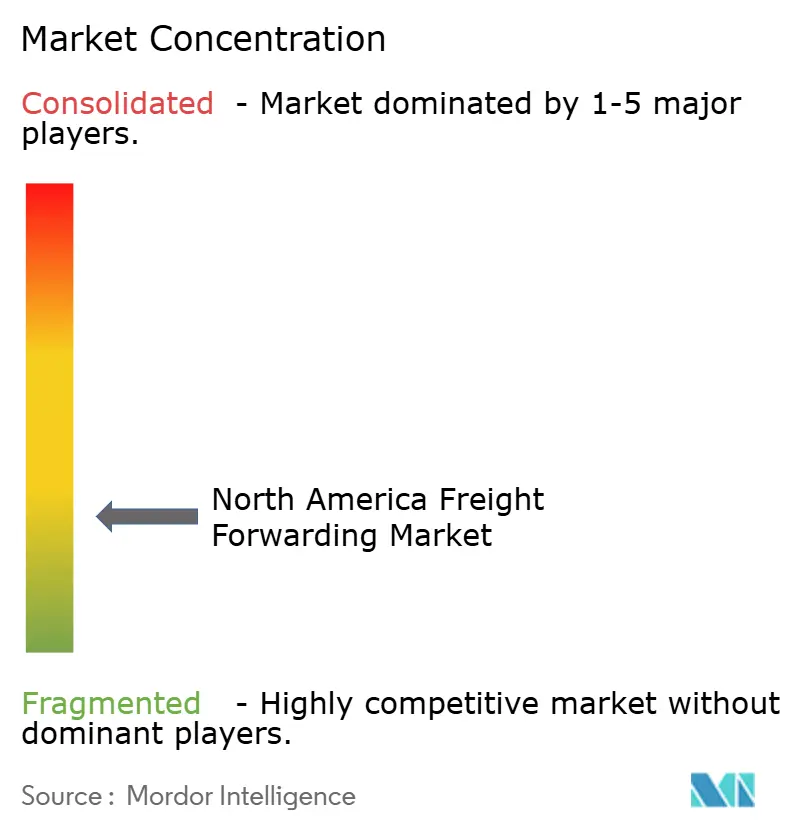
| Market Concentration | Low |
Major Players *Disclaimer: Major Players sorted in no particular order Image © Mordor Intelligence. Reuse requires attribution under CC BY 4.0. | |
North America Freight Forwarding Market Analysis by Mordor Intelligence
The North America Freight Forwarding Market size is estimated at USD 146.26 billion in 2025, and is expected to reach USD 179.39 billion by 2030, at a CAGR of 4.17% during the forecast period (2025-2030).
Robust cross-border e-commerce growth, persistent nearshoring of production from Asia to Mexico and Canada, and rapid diffusion of digital freight platforms are the primary catalysts shaping competitive behavior and service demand in the North America freight forwarding market. Shippers are demanding real-time visibility, integrated customs brokerage, and carbon-aware routing, pushing providers to modernize legacy operating models. Federal infrastructure spending across ports, highways, and Class I rail networks is already shortening transit times while expanding capacity, enabling forwarders to bundle multimodal solutions that balance cost with delivery guarantees. Simultaneously, sustainability-linked service offerings—such as sustainable aviation fuel programs and electric drayage—are moving from pilot stage to commercial scale under growing regulatory pressure from the Environmental Protection Agency and the California Air Resources Board.
Key Report Takeaways
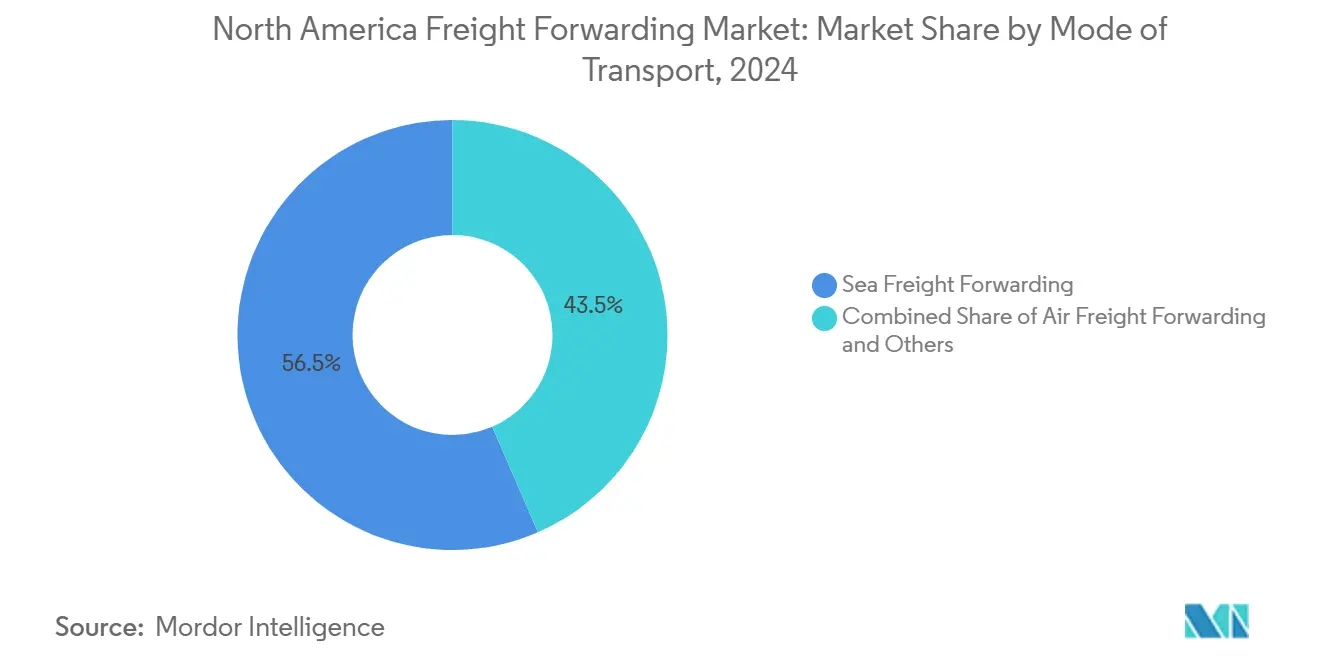
- By mode of transport, sea freight led with 56.47% of the North America freight forwarding market share in 2024; it is also projected to expand at a 4.25% CAGR through 2030.
- By end-user, manufacturing accounted for a 32.65% share of the North America freight forwarding market size in 2024, while wholesale and retail trade is poised for the fastest growth at a 4.36% CAGR to 2030.
- By country, the United States dominated with 87.44% of the North America freight forwarding market size in 2024, whereas Mexico is forecast to post a 5.60% CAGR through 2030.
North America Freight Forwarding Market Trends and Insights
Drivers Impact Analysis*
| Driver | (~) % Impact on CAGR Forecast | Geographic Relevance | Impact Timeline |
|---|---|---|---|
| Rising cross-border e-commerce volumes | +0.8% | Global, with concentration in US-Mexico-Canada corridors | Medium term (2-4 years) |
| Nearshoring of the United States supply chains to Mexico & Canada | +1.2% | North America core, spillover to Central America | Long term (≥ 4 years) |
| Digital freight platforms improving price discovery & capacity utilisation | +0.6% | Global, early adoption in major metropolitan areas | Short term (≤ 2 years) |
| Federal infrastructure investments shortening inland transit times | +0.5% | United States, with cross-border benefits | Long term (≥ 4 years) |
| Rapid adoption of sustainability-linked services (SAF, EV drayage) | +0.4% | North America & EU, regulatory influence from EPA, CARB | Medium term (2-4 years) |
| CBP "Entry Type 86" automation unlocking low-value B2C scalability | +0.7% | US-centric with spillover to USMCA partners | Short term (≤ 2 years) |
| Source: Mordor Intelligence | |||
Rising Cross-Border E-Commerce Volumes Drive Freight Complexity
Small-value parcel flows have grown exponentially since 2024, forcing forwarders to master customs pre-filing and final-mile orchestration that were once outside their core business. “Entry Type 86” automation now allows consolidated declarations for shipments valued under USD 800, eliminating paperwork bottlenecks and enabling high-volume, low-margin traffic to move profitably[1]U.S. Customs and Border Protection, “Entry Type 86 Program Overview,” cbp.gov. Shippers expect Amazon-style tracking on every order, compelling forwarders to integrate API-based status feeds and exception alerts into their transport management systems. As volumes scale, providers able to combine air, ground, and locker delivery through a single invoice are capturing sticky contracts with marketplace sellers. The North America freight forwarding market increasingly rewards firms that can translate granular SKU data into compliant, duty-optimized routing decisions at the time of order release.
Nearshoring Initiatives Reshape Continental Trade Corridors
Rising geopolitical risk, extended ocean transit times, and tariff uncertainty are driving U.S. manufacturers to relocate final assembly to Mexico and Canada. The United States-Mexico-Canada Agreement offers duty-free treatment on qualifying goods, but complex rules-of-origin calculations create a premium niche for forwarders with in-house trade advisory teams[2]United States Trade Representative, “United States-Mexico-Canada Agreement,” ustr.gov. New auto plants in Guanajuato and battery facilities in Ontario are reshaping south-north and north-south traffic patterns, spurring demand for drop-and-hook cross-dock operations near the border. Providers that can pair time-definite, bonded trucking with value-added warehouse services are gaining share. The North America freight forwarding market is also seeing greater interest in expedited rail land-bridges that bypass congested West Coast gateways for Asia-Mexico freight.
Digital Freight Platforms Transform Price Discovery and Capacity Utilization
Instant quoting portals and algorithmic load boards have cut the average booking cycle for a full truckload from days to minutes, allowing shippers to shift from annual bids to lane-level mini-tenders. Leading forwarders now embed dynamic pricing engines into customer portals, automatically recombining partial shipments into optimal container loads. While connectivity improves asset efficiency, cyber risk rises: ransomware attacks on transport management systems have the potential to ground operations across multiple modes simultaneously. Providers are responding with zero-trust architectures and dedicated threat-hunting teams. Early adopters have reported improvements in trailer utilization.
Federal Infrastructure Investments Reduce Transit-Time Bottlenecks
USD 1.2 trillion in federal funding began flowing into port dredging, inland waterway locks, and Interstate bridge replacements in 2024. Average end-to-end dwell for import containers moving from Los Angeles/Long Beach to Chicago dropped by 12 hours within a year of upgraded on-dock rail connections[3]Port of Los Angeles, “2024 Infrastructure Improvements,” portofla.org. Rebuilt bridge-clearance sections on I-95 now permit double-stack intermodal cars to reach Eastern seaboard distribution hubs, unlocking new sea-rail service combinations. Forwarders able to synchronize mode shifts at these upgraded nodes are quoting door-to-door transits up to two days faster in 2024 than previous year service levels. Over the long term, the North America freight forwarding market will benefit from greater schedule reliability, enabling just-in-time inventory models once considered too risky after the pandemic.
Restraints Impact Analysis*
| Restraint | (~) % Impact on CAGR Forecast | Geographic Relevance | Impact Timeline |
|---|---|---|---|
| Driver shortages & wage inflation across North-American trucking | -0.9% | North America core, acute in rural corridors | Long term (≥ 4 years) |
| Commodity-rate volatility eroding forwarder margins post-COVID | -0.6% | Global, with North America experiencing above-average volatility | Medium term (2-4 years) |
| Forced-labour verification costs under UFLPA reduce small-shipper participation | -0.4% | US-centric with supply chain ripple effects globally | Medium term (2-4 years) |
| Cybersecurity vulnerabilities in highly-connected digital freight platforms | -0.3% | Global, concentrated in digitally advanced markets | Short term (≤ 2 years) |
| Source: Mordor Intelligence | |||
Driver Shortages and Wage Inflation Constrain Capacity Growth
The American Trucking Associations estimated an 80,000-driver shortfall in late 2024, driven by retirements, lifestyle concerns, and stricter drug-testing rules[4]American Trucking Associations, “ATA Driver Shortage Analysis 2024,” trucking.org. Average long-haul wages climbed in 2024, outpacing CPI and forcing forwarders to pass through surcharges, which squeeze low-margin accounts. Specialized hazmat and refrigerated lanes face even steeper scarcity, extending tender lead times and complicating just-in-sequence manufacturing flows. Although apprenticeship initiatives aim to widen the labor pool, demographic trends suggest shortages could breach 160,000 drivers by 2030. Until automation scales beyond the pilot stage, the North America freight forwarding market must treat motor-carrier capacity as a structural constraint.
Commodity-Rate Volatility Erodes Predictable Margin Structures
Ocean freight spot rates plunged between Q2 and Q4 2024 before rebounding in early 2025 on renewed Red Sea disruptions, exposing forwarders that had locked in fixed-price contracts. Jet-fuel price swings added further uncertainty for air freight quotes. Smaller intermediaries lacking carrier volume commitments struggled to honor rate guarantees, leading to customer attrition and cash-flow stress. Hedging instruments exist but require collateral and sophisticated treasury management, nudging the sector toward consolidation. In this climate, the North America freight forwarding industry favors providers with diversified mode portfolios and strong balance sheets capable of absorbing temporary margin compression.
*Our forecasts treat driver/restraint impacts as directional, not additive. The impact forecasts reflect baseline growth, mix effects, and variable interactions.
Segment Analysis
By Mode of Transport: Sea Freight Maintains Cost Leadership
Sea freight held a 56.47% North America freight forwarding market share in 2024 and is forecast to grow at a 4.25% CAGR through 2030 on the back of stable containerization rates and expanded Gulf Coast terminal capacity. Overweight allowances on new Panamax vessels reduce unit freight costs by up to 18%, reinforcing sea freight’s dominance for automotive parts, home furnishings, and agricultural commodities. The North America freight forwarding market size for sea freight is projected to grow, supported by carrier investments in digital bill-of-lading platforms that accelerate cargo release.
Air freight remains indispensable for semiconductor devices, biopharma, and high-value retail replenishment. Although it accounts for a smaller share of tonnage, it generates outsized revenue because of rate premiums on transpacific corridors. Forwarders with dedicated charter programs are achieving a double-digit gross-margin spread compared with spot charter brokers. Intermodal sea-rail solutions are also scaling: the Falcon Premium and Eagle Premium services connecting Mexican origin ports to Midwest DCs shave 2–3 days off traditional sea-truck routings, expanding addressable cargo pools willing to pay a small premium for faster service.


By End-User: Manufacturing Dominates, Retail Accelerates
Manufacturing captured 32.65% of the North America freight forwarding market size in 2024, fueled by machinery, automotive, and chemical relocations from East Asia to the US-Mexico nearshore belt. Average bill-of-material complexity has risen, driving higher brokerage revenue per shipment. Forwarders offering bonded warehousing and component sequencing are locking in multi-year contracts with Tier 1 automotive suppliers.
Wholesale and retail trade, however, is advancing at a 4.36% CAGR—outpacing the market average—on sustained cross-border e-commerce growth and retailer demand for distributed order management. The segment increasingly relies on vendor-managed inventory programs that require forwarders to integrate purchase-order data with fulfillment center slotting systems. Agriculture and forestry continue to produce steady reefer volumes, while renewable-energy projects such as wind-turbine installation in Texas and Ontario are generating oversized cargo moves that demand route-survey expertise.

Geography Analysis
The United States commanded 87.44% of the North America freight forwarding market in 2024, anchored by the size and complexity of its domestic supply chains. Investments in intermodal ramp upgrades around Chicago and Atlanta have reduced average drayage miles, compressing inland costs and supporting mode shifts from truck to rail. The country also leads digital TMS adoption, with a significant share of shipments now tendered via API calls rather than email attachments.
Mexico represents the fastest-growing geography, projected at a 5.60% CAGR through 2030. New nearshoring-driven factories in Monterrey and Querétaro have increased northbound full-truckload demand, while southbound reverse logistics—returns and empty pallets—offer backhaul revenue opportunities. Customs modernization under SAT’s Ventanilla Única system has trimmed border clearance to under two hours for compliant cargo, a competitive boon for certified forwarders.
Canada’s share remains stable, supported by natural-resource exports and a thriving life-sciences cluster requiring GDP-compliant temperature control. Ice-class vessel charters and rail snow-mitigation strategies incur higher operating costs, yet savvy forwarders offset these with premium surcharges. Regulatory clarity on electronic logging devices and hours-of-service rules enhances cross-border harmonization, reducing administrative duplication for carriers operating tri-national networks.
Competitive Landscape
Competition is moderate fragmented, with scale advantages in carrier procurement and technology spend enabling the freight forwarders to guarantee capacity during peak seasons. Strategic moves illustrate divergent playbooks: UPS deepened healthcare specialization by acquiring Andlauer, while DHL launched consolidated clearance to win small-parcel importers. DSV’s purchase of Schenker’s regional assets signals an aggressive capacity build-out in the transborder trucking niche.
Mid-tier regionals focus on corridor expertise, such as Laredo-centred cross-dock services or Vancouver-Asia ocean consolidation. Many are forming digital alliances for shared visibility platforms, pooling data to compete with larger rivals’ end-to-end dashboards. Startups leverage machine-learning-driven procurement but increasingly invest in physical assets to secure recurring revenue. Cybersecurity maturity has become a bidding criterion in large RFQs, favoring operators with ISO 27001 certifications and in-house security operations centers.
M&A activity is expected to intensify as high borrowing costs encourage exit planning by family-owned intermediaries. Private-equity investors target niche specialties—dangerous-goods freight, project cargo—where EBITDA margins exceed the industry’s mid-single-digit norm. The North America freight forwarding market rewards acquirers that can integrate disparate rate-management systems and harmonize compliance processes swiftly, minimizing customer churn.
North America Freight Forwarding Industry Leaders
C.H. Robinson
United Parcel Service, Inc
FedEx
DHL Group
Expeditors International of Washington, Inc.
- *Disclaimer: Major Players sorted in no particular order

Recent Industry Developments
- October 2025: DHL Global Forwarding introduced a consolidated-clearance service for U.S. imports, enabling retailers to combine multiple shipments under one customs entry, cutting brokerage fees and dwell times.
- April 2025: UPS finalized its CAD 2.2 billion (USD 1.6 billion) takeover of Andlauer Healthcare Group, adding GDP-certified facilities across Canada to serve temperature-controlled pharmaceuticals.
- April 2025: DSV completed the acquisition of Schenker’s North American operations, immediately increasing its cross-border trucking capacity by 20%.
- September 2024: FedEx invested in Nimble’s AI-powered fulfillment robots to accelerate same-day e-commerce delivery capabilities.


North America Freight Forwarding Market Report Scope
| Air Freight Forwarding |
| Sea Freight Forwarding |
| Others |
| Oil and Gas, Mining and Quarrying |
| Construction |
| Manufacturing |
| Agriculture, Fishing, and Forestry |
| Wholesale and Retail Trade |
| Others |
| United States |
| Canada |
| Mexico |
| By Mode of Transport | Air Freight Forwarding |
| Sea Freight Forwarding | |
| Others | |
| By End-User | Oil and Gas, Mining and Quarrying |
| Construction | |
| Manufacturing | |
| Agriculture, Fishing, and Forestry | |
| Wholesale and Retail Trade | |
| Others | |
| By Country | United States |
| Canada | |
| Mexico |


Key Questions Answered in the Report
What is the current value of the North America freight forwarding market?
The market is valued at USD 146.26 billion in 2025 and is forecast to reach USD 179.39 billion by 2030.
Which mode of transport holds the largest share in North American freight forwarding?
Sea freight holds 56.47% of total revenue, benefiting from container cost efficiencies and upgraded Gulf and West Coast terminals.
Why is Mexico growing faster than the United States in freight forwarding?
Nearshoring, streamlined customs under the Ventanilla Única program, and new manufacturing investments are driving a projected 5.60% CAGR in Mexico through 2030.
How are digital freight platforms changing forwarder operations?
They enable instant pricing, higher trailer utilization, and API-based tendering, but also require robust cybersecurity defenses against ransomware.
What are the biggest challenges facing freight forwarders today?
Driver shortages, commodity rate volatility, and stricter forced-labor verification rules under the UFLPA are the primary operational headwinds.
Which sustainability measures are customers requesting from forwarders?
Shippers increasingly demand CO₂ reporting, book-and-claim sustainable aviation fuel, and electric drayage options for port moves.
Page last updated on:


