Sea Freight Forwarding Market Size and Share
Market Overview
| Study Period | 2020 - 2031 |
|---|---|
| Market Size (2026) | USD 378.37 Billion |
| Market Size (2031) | USD 488.97 Billion |
| Growth Rate (2026 - 2031) | 5.26% CAGR |
| Fastest Growing Market | North America |
| Largest Market | Asia Pacific |
| Market Concentration | Low |
Major Players
*Disclaimer: Major Players sorted in no particular order Image © Mordor Intelligence. Reuse requires attribution under CC BY 4.0. |
|

Sea Freight Forwarding Market Analysis by Mordor Intelligence
The Sea Freight Forwarding Market size was valued at USD 358.31 billion in 2025 and is estimated to grow from USD 378.37 billion in 2026 to reach USD 488.97 billion by 2031, at a CAGR of 5.26% during the forecast period (2026-2031).
The global sea freight forwarding market is growing steadily, supported by resilient trade flows and ongoing supply chain realignment. Growth is reinforced by large-scale infrastructure investments, such as the ~USD 1.2 billion expansion of Bremerhaven port to enhance capacity and efficiency, and increasing strategic alliances among major carriers to improve schedule reliability and network optimization. While Asia-Pacific continues to dominate global volumes, nearshoring trends and port investments are accelerating growth in North America. At the same time, persistent disruptions and rising digital adoption are pushing freight forwarders toward more integrated, technology-driven, and value-added logistics solutions.
Key Report Takeaways
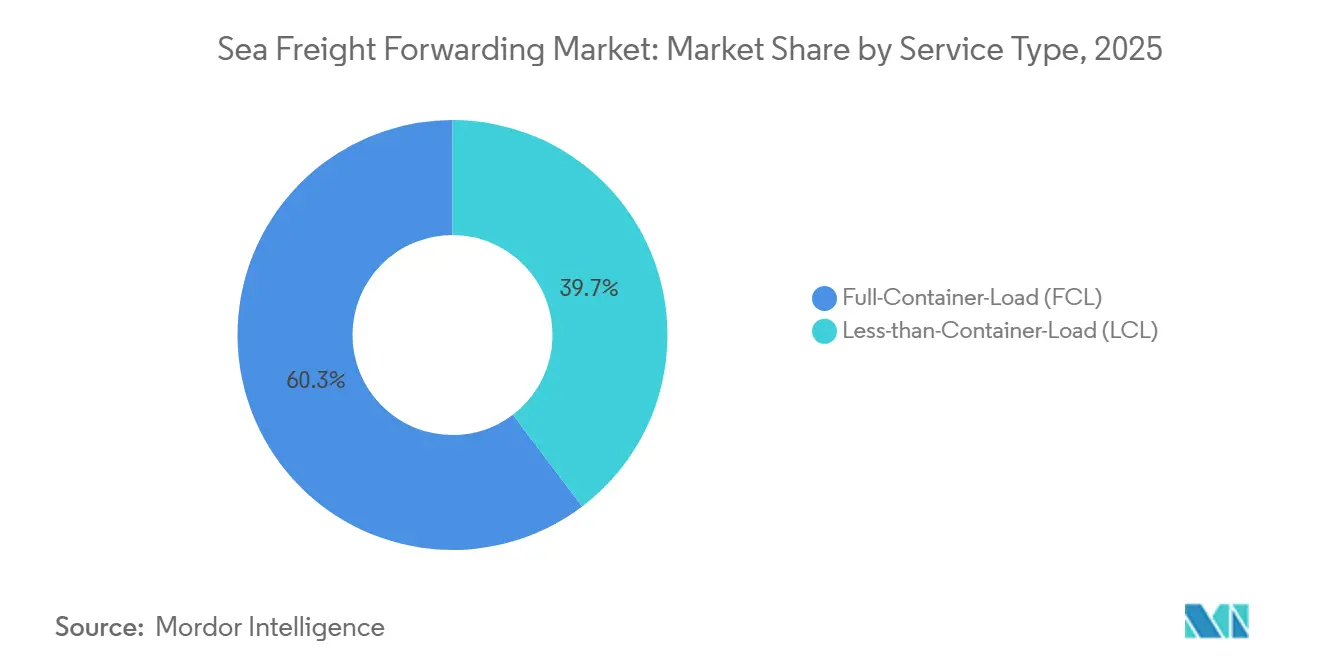
- By service type, full-container-load services held 60.31% of the sea freight forwarding market share in 2025, while the less-than-container-load segment of the sea freight forwarding market is projected to expand at a 4.67% CAGR between 2026 and 2031.
- By cargo type, Dry cargo accounted for a 71.40% share of the sea freight forwarding market size in 2025, while the reefer cargo is projected to grow at a CAGR of 4.23% between 2026 and 2031.
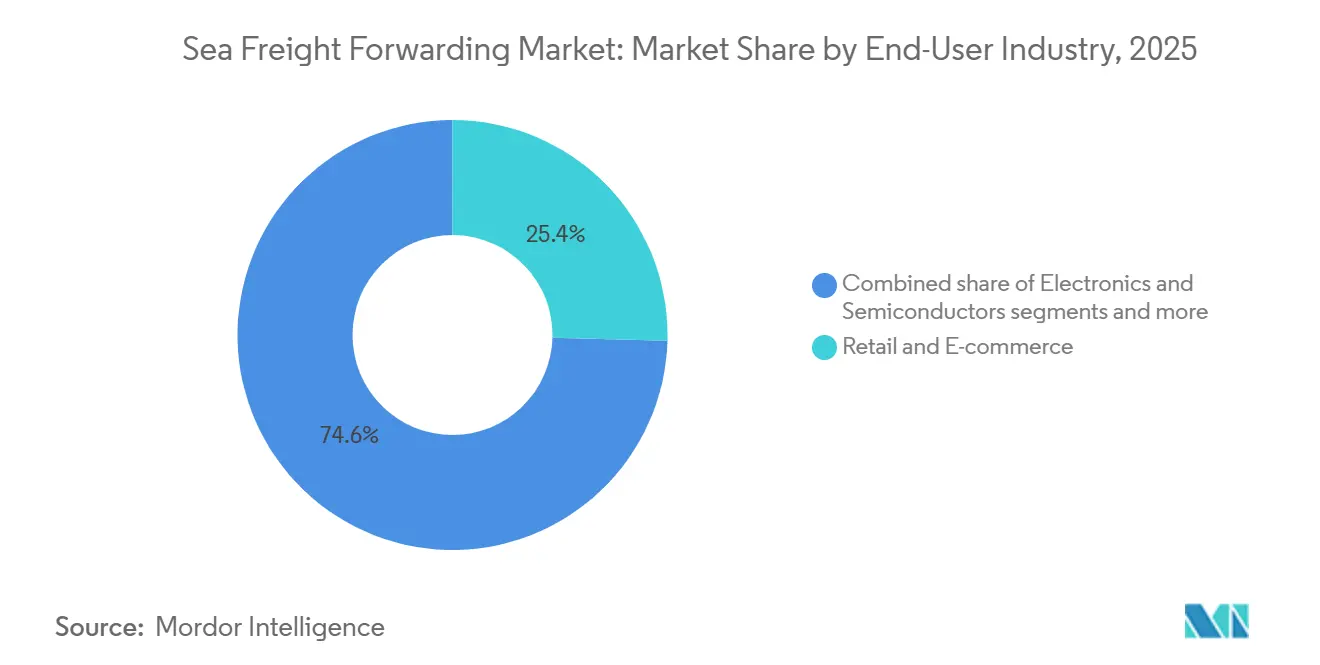
- By end-user industry in 2025, retail and e-commerce accounted for 25.43% of the market share, while the pharmaceuticals and healthcare sectors are set to lead with the highest projected CAGR of 5.45% between 2026-2031.
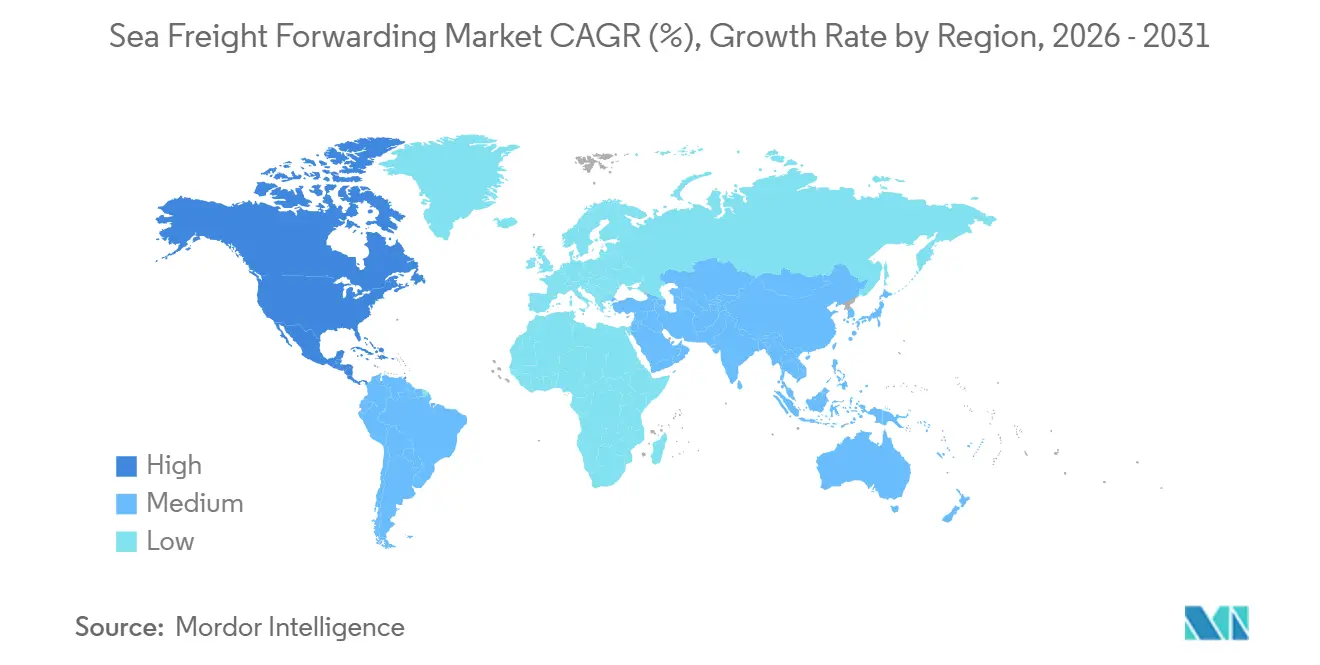
- By geography, Asia-Pacific dominates the sea freight forwarding market with a 40.52% share in 2025, while North America is projected to grow at a significant CAGR of 5.23% during 2026–2031.
Note: Market size and forecast figures in this report are generated using Mordor Intelligence’s proprietary estimation framework, updated with the latest available data and insights as of 2026.
Global Sea Freight Forwarding Market Trends and Insights
Drivers Impact Analysis*
| Driver | (~) % Impact on CAGR Forecast | Geographic Relevance | Impact Timeline |
|---|---|---|---|
| Growth in Global Trade Volumes | +0.9% | Global with focus on Asia-Pacific and North America | Medium term (2–4 years) |
| Expansion of E-Commerce and Cross-Border Sales | +1.2% | Global led by Asia-Pacific, North America, Europe | Short term (≤ 2 years) |
| Demand for Cost-Effective Bulk Transport | +0.7% | Emerging markets in South America and Africa | Long term (≥ 4 years) |
| Port Modernization and Deepening Projects | +0.8% | Asia-Pacific, Middle East, South America | Medium term (2–4 years) |
| Need for Temperature-Controlled Logistics | +0.6% | North America, Europe, Asia-Pacific pharma lanes | Medium term (2–4 years) |
| Shift to Larger Container Vessels | +0.5% | Transpacific and Asia-Europe routes | Long term (≥ 4 years) |
| Source: Mordor Intelligence | |||
Growth in Global Trade Volumes
World merchandise trade rebounded by 3.2% in 2025, led by tariff cuts under the Regional Comprehensive Economic Partnership, which boosted trade flows between Southeast Asia and China. AI-related goods posted 20% year-on-year value growth, raising demand for express ocean services that promise sub-30-day transits. United States importers diverted 18% of China-origin cargo through ASEAN intermediaries to manage tariff exposure, generating extra documentation revenue for forwarders. The World Trade Organization forecasts 3.5% annual trade growth through 2027, assuming disruptions to the Red Sea and the Panama Canal ease. Forwarders are responding with new Vietnam and Thailand hubs that shorten cross-docking cycles to under 24 hours.[1]World Trade Organization, "Regional Comprehensive Economic Partnership Trade Impacts 2025
Expansion of E-Commerce and Cross-Border Sales
Cross-border e-commerce reached USD 1.9 trillion in 2025 and now channels 43% of global consumer-goods trade. Average parcel weight on Asia-Europe lanes fell to 5.7 kg in 2025, stimulating Less-than-Container-Load demand and the development of micro-consolidation centers within 50 km of export hubs. Direct-to-consumer brands account for 28% of containerized apparel and electronics, shifting profit pools toward premium customs clearance and last-mile orchestration. The European Union Digital Services Act requires real-time tracking and carbon reporting, adding USD 4-7 per shipment in technology costs. Southeast Asia e-commerce logistics expanded 22% in 2025 despite limited last-mile infrastructure, drawing forwarders into local courier partnerships.
Increasing Demand for Cost-Effective Bulk Transport
Average vessel size reached 8,200 TEU in 2025, improving per-TEU fuel efficiency by 18% on Asia-Europe services. Mega-vessels now serve 34% of transpacific volume but concentrate port calls at 12 hubs, driving the need for feeder networks that add 4-6 days to total transit. Bulk commodities moved 2.1 billion t by sea in 2025, with forwarders earning ancillary revenue from cargo insurance and storage optimization rather than core freight. South American soybean exports climbed 9% in 2025, stressing Santos and Rosario ports and rewarding forwarders who pre-booked berth windows. A 3.8 million TEU orderbook risks overcapacity after 2027, which could depress spot rates by 15-20%.[2]International Maritime Organization, "IMO 2020 Sulfur Cap Regulation Impacts
Port Modernization and Deepening Projects
India’s USD 9.2 billion Vadhavan Port will handle 23 million TEU by 2030 to relieve congestion in Mumbai. Mozambique’s Maputo Port deepened to 16.5 m draft in 2025, enabling 14,000 TEU calls that cut Southern Africa-Asia transit times by three days. The United States has granted USD 3 billion to Los Angeles, Long Beach, and Savannah to reduce truck turn times to below 45 minutes. Panama Canal upgrades promise to restore 36 daily transits by late 2026. Mexico invested USD 1.8 billion in improvements to Manzanillo and Lázaro Cárdenas, which supported a 26% jump in nearshoring-driven container flows in 2025.
Restraints Impact Analysis*
| Restraint | (~)% Impact on CAGR Forecast | Geographic Relevance | Impact Timeline |
|---|---|---|---|
| Rate Volatility from Supply-Demand Imbalance | -0.6% | Asia-Europe and transpacific lanes | Short term (≤ 2 years) |
| Congestion at Major Ports | -0.4% | North America, Asia-Pacific, Europe | Short term (≤ 2 years) |
| Complex Cross-Border Documentation | -0.3% | Global with emphasis on EU and North America | Medium term (2–4 years) |
| Rising Bunker Costs | -0.5% | Global with cost pass-throughs | Short term (≤ 2 years) |
| Source: Mordor Intelligence | |||
Volatility in Ocean Freight Rates
The Shanghai Containerized Freight Index averaged 1,420 in 2025, still 65% above 2019 despite a 38% fall from 2024 highs. Red Sea security issues shifted 22% of Asia-Europe cargo around the Cape of Good Hope, adding 12-15 days and 40% more fuel. Spot rates on Asia-U.S. West Coast lanes swung between USD 2,100 and 4,800 per FEU in a single quarter, pushing shippers toward annual contracts that squeeze forwarder flexibility. Delivery of new capacity in 2027-2028 could send rates down 15-20%, challenging forwarders reliant on transactional bookings.[3]United Nations Conference on Trade and Development, "Container Vessel Fleet Capacity and Orderbook Analysis 2025
Congestion and Delays at Major Ports
Los Angeles and Long Beach cut vessel queues to 3.2 days in 2025, yet truck turn times still average 87 minutes, twice pre-pandemic norms. Singapore processed 37.3 million TEU at 94% utilization, forcing 6-8 week berth pre-booking or 4-day anchorage delays. Panama Canal transit caps of 24 vessels per day in mid-2025 redirected 18% of Asia-U.S. East Coast cargo via the Suez Canal, adding USD 1,000 per FEU. Rotterdam trials of autonomous yard equipment reduced dwell times to 3.1 days, but an 11-day labor stoppage in Q2 2025 offset this.
*Our forecasts treat driver/restraint impacts as directional, not additive. The impact forecasts reflect baseline growth, mix effects, and variable interactions.
Segment Analysis
By Service Type: Consolidation Pressures Reshape FCL Dominance
Full-Container-Load held 60.31% of the sea freight forwarding market share in 2025, as mega-vessels enabled slot prices below USD 1,500 per FEU on Asia-Europe routes. Less-than-Container-Load is forecast to grow at 4.67% CAGR through 2031, driven by shrinking parcel weights in cross-border e-commerce and the rise of micro-consolidation hubs. The sea freight forwarding market size for FCL is expected to remain above USD 300 billion by 2031, while LCL revenue is poised to outpace FCL growth by percentage as direct-to-consumer brands bypass wholesale channels.
Digital freight platforms accelerate LCL booking cycles from 4.2 days to 1.8 days, allowing small forwarders to compete on speed. FCL remains cost-efficient for bulk shippers, but schedule reliability has become a differentiator rather than pure price. Forwarders able to blend FCL and LCL in multimodal solutions retain pricing power while offering shippers resilience against rate swings.


By Cargo Type: Reefer Premiums Offset Dry Volume Dominance
Dry cargo retained 71.40% of 2025 revenue because electronics, textiles, and machinery still ship in standard containers with average slot costs of USD 1,400-1,800. This dominance is attributed to the consistent demand for these goods across global markets, driven by industrial and consumer needs. Reefer cargo, growing at a 4.23% CAGR, benefits from a supply gap in GDP-compliant equipment, which inflated rates by 35% on key pharma lanes. The sea freight forwarding market size for reefer is projected to surpass USD 90 billion by 2031, supported by the increasing need for temperature-controlled logistics in sectors like pharmaceuticals, food, and beverages.
Pharmaceutical exports from India and vaccine distribution to Africa and Latin America require ±2 °C stability, pushing forwarders to invest in IoT-enabled containers and GDP certifications. These investments ensure compliance with stringent regulatory standards and enhance the reliability of cold chain logistics. Dry cargo growth is anchored by AI hardware demand that rose 20% year-on-year in 2025, reflecting the rapid adoption of artificial intelligence technologies across industries. Meanwhile, reefer gains a margin advantage of 20-30% over standard FCL rates, making it a lucrative segment for freight forwarders aiming to capitalize on high-value, temperature-sensitive shipments.
By End-User Industry: Pharma and E-Commerce Outpace Traditional Sectors
Retail and e-commerce generated 25.43% of 2025 revenue, driven by the adoption of less-than-container load (LCL) shipments and time-definite ocean services. Businesses increasingly opt for smaller, frequent shipments to align with just-in-time inventory strategies. Pharmaceuticals and healthcare are projected to grow at a 5.45% CAGR, driven by the demand for specialized reefer containers ensuring temperature-controlled transportation. Compliance spending for these containers ranges between USD 2,500 and USD 4,000 per unit. Electronics and semiconductors rely on express ocean services guaranteeing delivery within 30 days or less, fueled by the growth of consumer electronics and the semiconductor supply chain. The chemicals sector benefits from 882,000 ISO tanks, with pharma-grade units commanding premium pricing due to stringent safety standards.
Forwarders with vertical expertise and technology-enabled visibility tools secure higher profit margins. These forwarders invest in digital platforms, IoT-enabled tracking, and predictive analytics to enhance efficiency and customer satisfaction. Commodity-focused players face fee compression as carriers digitize direct booking channels, bypassing intermediaries. This shift reshapes the competitive landscape, compelling traditional forwarders to innovate and differentiate their services. The growing emphasis on technology and specialization highlights the need for forwarders to adapt to evolving market demands. Those unable to innovate risk losing market share in an increasingly competitive environment.
Geography Analysis
Asia-Pacific accounted for 40.52% of revenue in 2025, driven by port automation programs in China and RCEP tariff reductions that reduced intra-regional dwell time by 18%. Singapore ran at 94% capacity, creating anchorage delays that forwarders must factor into schedules. India’s Vadhavan Port will add 23 million TEU by 2030, easing congestion in Western India. Southeast Asia e-commerce logistics grew 22% in 2025, opening opportunities for forwarders willing to partner with last-mile couriers.
North America is the fastest-growing region, with a 5.23% CAGR to 2031, fueled by nearshoring, which shifted 12% of U.S. electronics imports to Mexico. The U.S. grants USD 3 billion to target port automation to halve truck turnaround times. Mexico’s Manzanillo upgrades lifted container throughput by 26% year-on-year, reinforcing demand for integrated cross-border forwarding. Canadian Pacific Gateway ports are siphoning Asia cargo from congested U.S. terminals, diversifying routing options.
Europe faces Red Sea diversions that added 15 days to Asia transits. Rotterdam automation cut the dwell time to 3.1 days, but an 11-day strike showed that technology alone cannot eliminate risk. The EU Digital Services Act increases compliance costs, yet positions forwarders that invest in carbon reporting. Middle East hubs handled 18.2 million TEU by capitalizing on Suez diversions, while African ports suffer 9-12 day wait times that force 20% buffer into schedules. South America saw 9% maritime growth, led by Brazilian agriculture; the Santos port moved to 24-hour operations, but still faces hinterland trucking bottlenecks.
Mordor Intelligence provides coverage of the sea freight forwarding market across other key regional markets, including Asia and North America, each with their regulatory frameworks and demand patterns.

Competitive Landscape
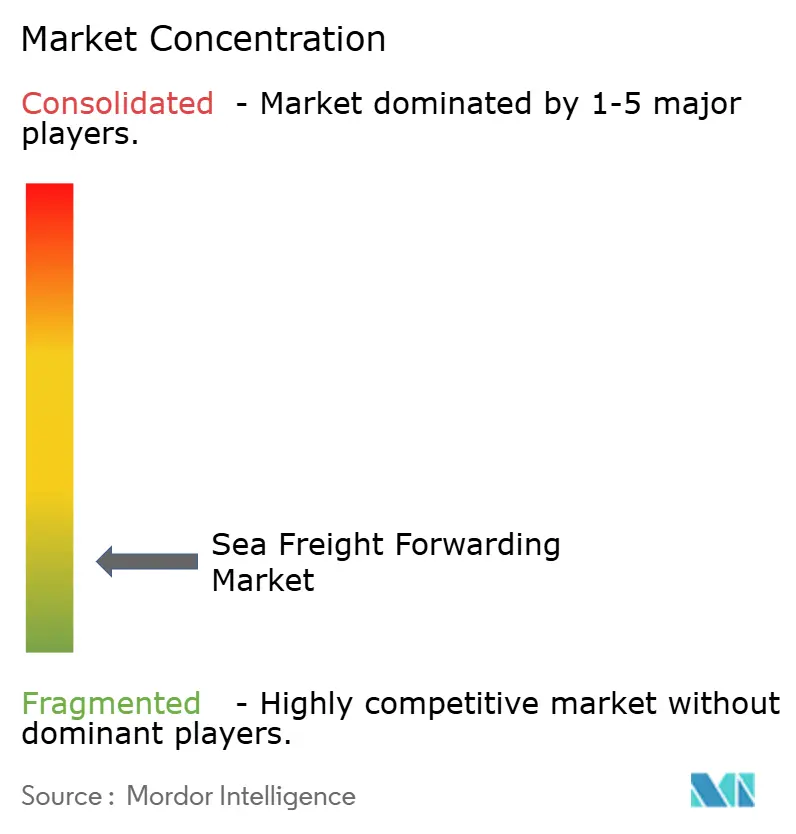
The sea freight forwarding market remains fragmented. Kuehne+Nagel, DHL Global Forwarding, and DSV hold the majority of the combined share through global networks and digital platforms. Smaller specialists win compliance-heavy sectors such as pharmaceuticals and aerospace. Blockchain documentation, including TradeLens and Global Shipping Business Network, trimmed clearance from 7.2 days to 4.1 days and reduced paper bills by 90%, shifting value creation away from manual processing toward advisory services.
Technology adoption differentiates leaders. API visibility, predictive analytics, and embedded insurance allow premiums of 8-12% for guaranteed service levels. Start-ups offering instant quotes and simplified booking captured 4-6% of Asia-North America e-commerce flows by appealing to younger procurement teams. Consolidation remains limited amid antitrust scrutiny, but alliances to share capacity and co-fund green-fuel surcharges are growing.
Integrated logistics conglomerates hedge bunker risk through captive tonnage and fuel contracts, while many mid-tier forwarders struggle with quarterly surcharges. Specialization in hazmat handling, project cargo, and emerging-market compliance gives regional players defensible niches despite shrinking transactional margins.
Sea Freight Forwarding Industry Leaders
-
Kuehne + Nagel
-
DHL Global Forwarding
-
Sinotrans
-
DSV A/S
-
Expeditors International
- *Disclaimer: Major Players sorted in no particular order

Recent Industry Developments
- February 2026: APM Terminals (part of Maersk) and Eurogate jointly invested EUR 1 billion (around USD 1.2 billion) to upgrade the North Sea Terminal in Bremerhaven. This upgrade boosts the terminal's annual capacity from 3 million TEUs to 4 million TEUs and implements full electrification, aiming for zero greenhouse gas emissions.
- February 2026: APM Terminals (a Maersk subsidiary) made its debut in the Saudi Arabian port market by acquiring a 37.5% minority stake in DP World's Southern Container Terminal located in Jeddah.
- February 2026: Hapag-Lloyd sealed a USD 4.2 billion all-cash deal to acquire Zim. The merger boasts a combined fleet of over 400 vessels, surpassing a capacity of 3 million TEUs.
- November 2025: Union Pacific, with the backing of its shareholders, is set to acquire Norfolk Southern Railroad in an all-stock deal valued at around USD 85 billion. This monumental move aims to establish America's inaugural transcontinental railroad, stretching over 50,000 route miles.


Global Sea Freight Forwarding Market Report Scope
Sea Freight Forwarding is a method of transporting large quantities of goods using cargo ships where goods are packed in containers and loaded onto ships. A typical freighter can carry about 18,000 containers, making ocean freight a cost-effective way to transport large quantities over long distances.
The Sea Freight Forwarding Market report provides insights into the market, Market Overview, Market Dynamics, Value Chain / Supply Chain Analysis, Technological Trends, Investment Scenarios, Government Regulations and Initiatives, Sea Freight Transportation Costs/Freight Rates, Insights on the E-commerce Industry, Sea Freight Forwarding Market, and Industry Attractiveness. Furthermore, the report also provides company profiles of leading market players to understand the market's competitive landscape.
The Sea Freight Forwarding Market Report is Segmented by Service Type (Full-Container-Load, Less-Than-Container-Load), by Cargo Type (Dry, Reefer), by End-User Industry (Electronics and Semiconductors, Chemicals and Petrochemicals, and More), and by Geography (North America, South America, Asia-Pacific, Europe, Middle East and Africa). The Market Forecasts are Provided in Terms of Value (USD).
| Full-Container-Load (FCL) |
| Less-than-Container-Load (LCL) |
| Dry |
| Reefer |
| Electronics and Semiconductors |
| Chemicals and Petrochemicals |
| Food and Beverage |
| Pharmaceuticals and Healthcare |
| Retail and E-commerce |
| Others |
| North America | United States |
| Canada | |
| Mexico | |
| South America | Brazil |
| Peru | |
| Chile | |
| Argentina | |
| Rest of South America | |
| Asia-Pacific | India |
| China | |
| Japan | |
| Australia | |
| South Korea | |
| South East Asia (Singapore, Malaysia, Thailand, Indonesia, Vietnam, and Philippines) | |
| Rest of Asia-Pacific | |
| Europe | United Kingdom |
| Germany | |
| France | |
| Spain | |
| Italy | |
| BENELUX (Belgium, Netherlands, and Luxembourg) | |
| NORDICS (Denmark, Finland, Iceland, Norway, and Sweden) | |
| Rest of Europe | |
| Middle East and Africa | United Arab of Emirates |
| Saudi Arabia | |
| South Africa | |
| Nigeria | |
| Rest of Middle East And Africa |
| By Service Type | Full-Container-Load (FCL) | |
| Less-than-Container-Load (LCL) | ||
| By Cargo Type | Dry | |
| Reefer | ||
| By End-User Industry | Electronics and Semiconductors | |
| Chemicals and Petrochemicals | ||
| Food and Beverage | ||
| Pharmaceuticals and Healthcare | ||
| Retail and E-commerce | ||
| Others | ||
| By Geography | North America | United States |
| Canada | ||
| Mexico | ||
| South America | Brazil | |
| Peru | ||
| Chile | ||
| Argentina | ||
| Rest of South America | ||
| Asia-Pacific | India | |
| China | ||
| Japan | ||
| Australia | ||
| South Korea | ||
| South East Asia (Singapore, Malaysia, Thailand, Indonesia, Vietnam, and Philippines) | ||
| Rest of Asia-Pacific | ||
| Europe | United Kingdom | |
| Germany | ||
| France | ||
| Spain | ||
| Italy | ||
| BENELUX (Belgium, Netherlands, and Luxembourg) | ||
| NORDICS (Denmark, Finland, Iceland, Norway, and Sweden) | ||
| Rest of Europe | ||
| Middle East and Africa | United Arab of Emirates | |
| Saudi Arabia | ||
| South Africa | ||
| Nigeria | ||
| Rest of Middle East And Africa | ||


Key Questions Answered in the Report
What is the projected value of the Sea Freight Forwarding Market by 2031?
The Sea Freight Forwarding Market is forecast to reach USD 488.97 billion by 2031, growing at a CAGR of 5.26% from 2026.
Which region is growing fastest?
North America leads at 5.23% CAGR to 2031, driven by nearshoring that shifted 12% of U.S. electronics imports to Mexico.
What is driving reefer cargo demand?
Pharmaceutical GDP rules and consumer preference for fresh produce are pushing reefer to 4.23% CAGR despite tight pharma-grade capacity.
How are digital platforms changing forwarding?
Blockchain documentation cut clearance from 7.2 days to 4.1 days, reducing manual value-add and elevating advisory services.
What share does Asia-Pacific hold?
Asia-Pacific accounted for 40.52% of market share in 2025, supported by RCEP tariff cuts and China port automation.
Which service type dominates?
Full-Container-Load held 60.31% share in 2025, yet Less-than-Container-Load is expanding faster at 4.67% CAGR.
Page last updated on:


