Market Overview
| Study Period | 2020 - 2031 |
|---|---|
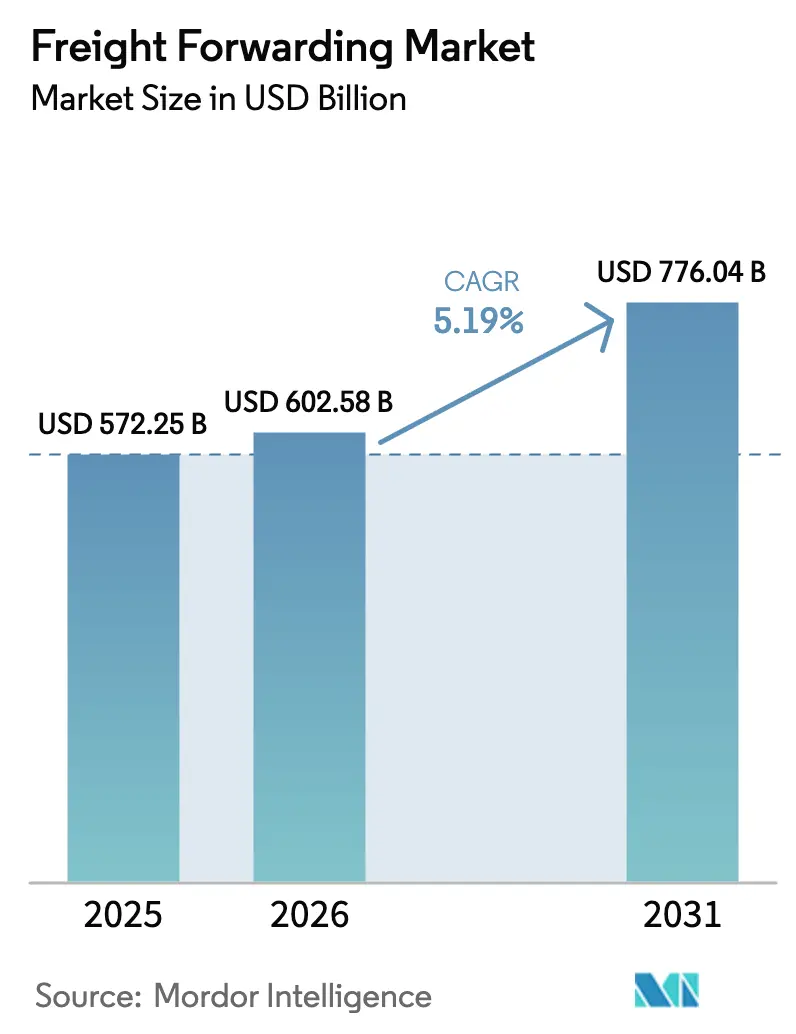
| Market Size (2026) | USD 602.58 Billion |
| Market Size (2031) | USD 776.04 Billion |
| Growth Rate (2026 - 2031) | 5.19% CAGR |
| Fastest Growing Market | Asia Pacific |
| Largest Market | Asia Pacific |
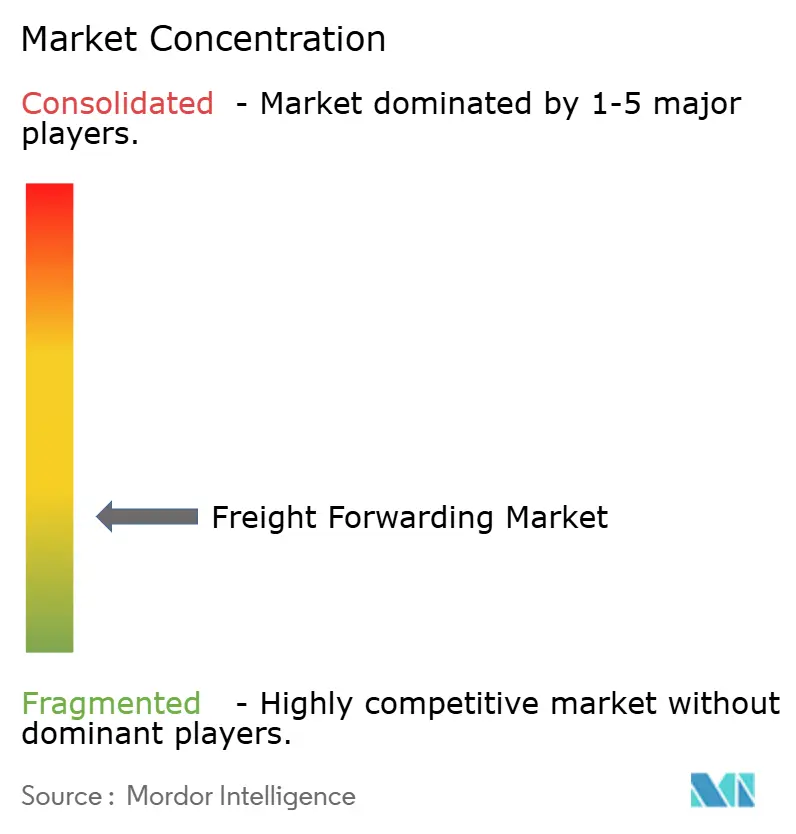
| Market Concentration | Low |
Major Players *Disclaimer: Major Players sorted in no particular order Image © Mordor Intelligence. Reuse requires attribution under CC BY 4.0. | |
Freight Forwarding Market Analysis by Mordor Intelligence
The Freight Forwarding Market size is expected to grow from USD 572.25 billion in 2025 to USD 602.58 billion in 2026 and is forecast to reach USD 776.04 billion by 2031 at 5.19% CAGR over 2026-2031.
Growth stems from the cross-border e-commerce parcel boom that fragments container loads, accelerating near-shoring mandates that compress lead times and expanding cold-chain corridors for biologic drugs and fresh food. Multimodal demand is widening as shippers combine ocean, rail, and air to bypass chokepoints, while digital-first platforms deliver instant quoting and transparency that reshapes carrier selection. Labor shortages in trucking and warehousing inflate execution costs in North America and Europe, but Asia-Pacific hubs continue to gain prominence as manufacturing shifts toward Vietnam, India, and Indonesia. Forwarders that blend asset-light networks with real-time visibility and carbon dashboards are positioned to unlock premium pricing and capture share in high-growth healthcare and e-commerce verticals.
Key Report Takeaways
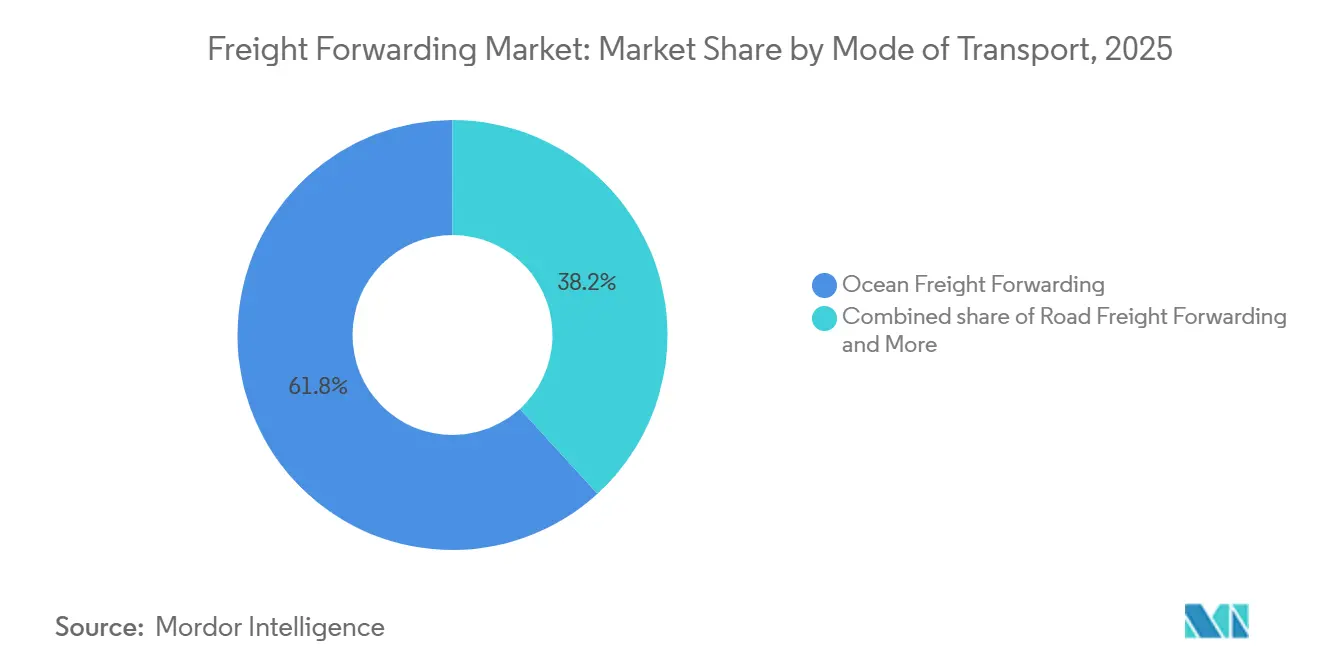
- By mode of transport, ocean freight forwarding held 61.77% of the freight forwarding market share in 2025, while multimodal and intermodal forwarding is advancing at a 6.40% CAGR between 2026-2031.
- By enterprise size, large enterprises accounted for 68.50% of the freight forwarding market size in 2025, yet small and medium enterprises are expanding at a 6.53% CAGR between 2026-2031.
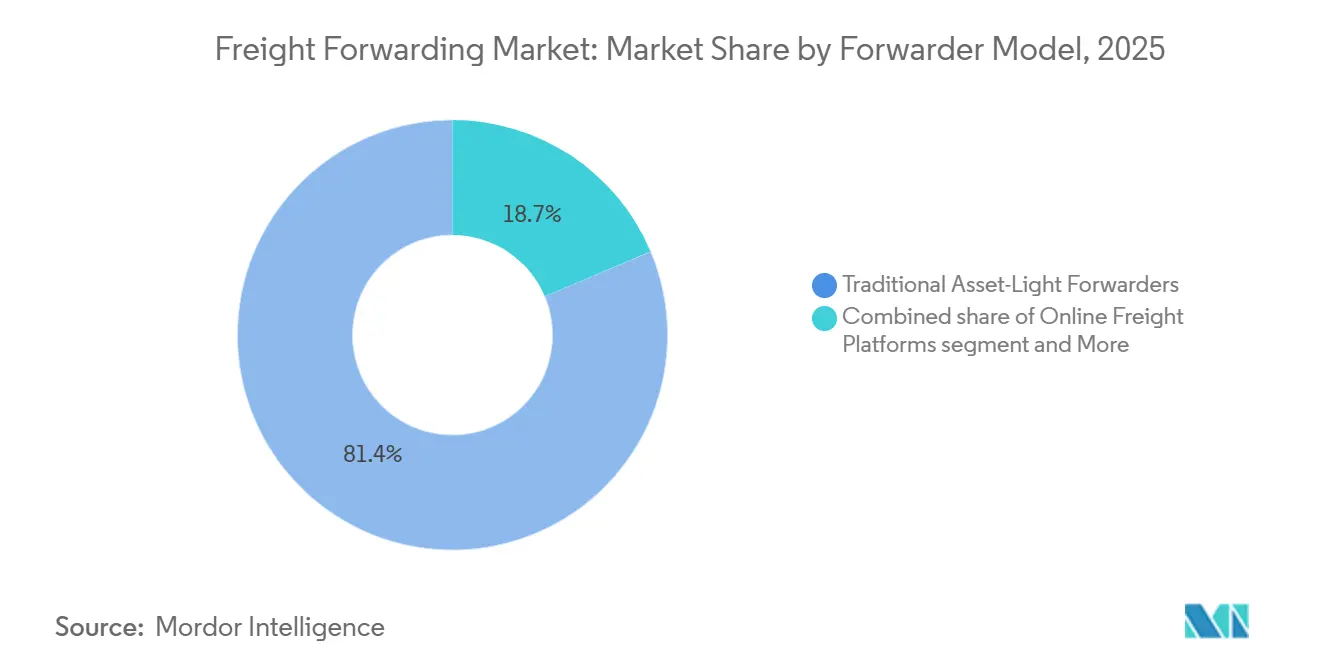
- By the forwarder model, traditional asset-light players retained 81.35% of revenue in 2025, whereas digital-first platforms are growing at a 17.84% CAGR between 2026-2031.
- By end-user industry, retail and e-commerce contributed 29.52% of 2025 demand, while healthcare and pharmaceuticals are the fastest-growing segment with an 8.50% CAGR between 2026-2031.
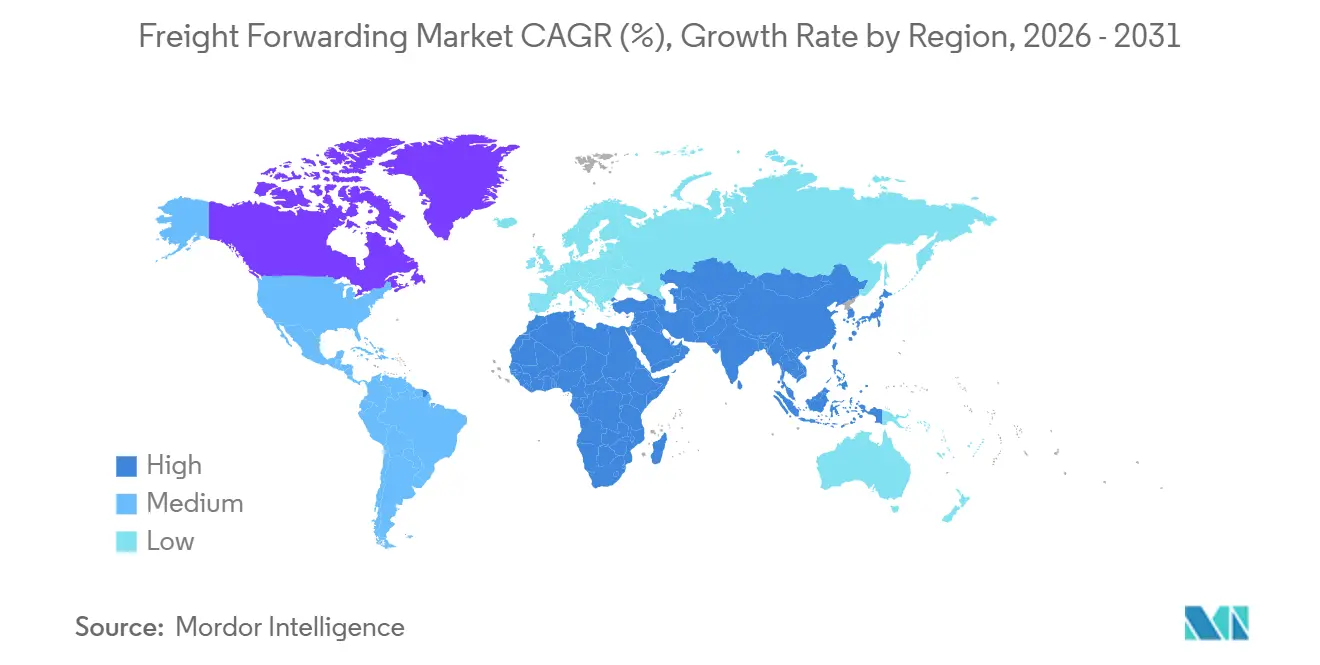
- By geography, Asia-Pacific controlled 36.49% of forwarding revenue in 2025 and is forecast to improve at a 7.80% CAGR between 2026-2031, outpacing North America and Europe.
Note: Market size and forecast figures in this report are generated using Mordor Intelligence’s proprietary estimation framework, updated with the latest available data and insights as of January 2026.
Global Freight Forwarding Market Trends and Insights
Drivers Impact Analysis*
| Driver | (~) % Impact on CAGR Forecast | Geographic Relevance | Impact Timeline |
|---|---|---|---|
| Cross-border e-commerce parcel boom | +1.2% | Global, concentrated in North America, Europe, and Asia-Pacific | Medium term (2-4 years) |
| End-to-end shipment visibility adoption | +0.7% | Global, early adoption in North America and Europe | Short term (≤ 2 years) |
| Near-shoring and China-plus-one trade shifts | +0.9% | Asia-Pacific core with spill-over to Mexico and Central America | Long term (≥ 4 years) |
| Cold-chain investment for pharma and food | +0.6% | Global, led by North America and Europe | Medium term (2-4 years) |
| Shipper ESG targets and carbon pricing | +0.5% | Europe and North America, emerging in Asia-Pacific | Long term (≥ 4 years) |
| Generative-AI dynamic load matching | +0.8% | Global, early gains in North America and Europe | Short term (≤ 2 years) |
| Source: Mordor Intelligence | |||


Cross-Border E-Commerce Parcel Boom
Global cross-border parcels reached 2.1 billion in 2024 and are expected to exceed 3 billion by 2027, fragmenting full-container traffic into small consignments that need rapid consolidation. Forwarders now build parcel hubs and last-mile alliances to uphold 48-hour delivery windows in Southeast Asia. Regulatory frameworks such as the World Customs Organization’s cross-border e-commerce standard drive investment in automated duty calculation that trims clearance delays. Providers unable to furnish real-time inventory visibility risk displacement by digital-native competitors. The freight forwarding market is therefore tilting toward flexible, data-rich operators that can optimize cost and speed simultaneously[1]“Cross-Border E-Commerce Framework,” World Customs Organization, wcoomd.org .
End-to-End Shipment Visibility Adoption
More than 12 million IoT container sensors were active in ocean trade by early 2025, feeding control-tower platforms that predict port congestion and customs holds. Machine-learning analytics help shippers re-route cargo before delays escalate, an advantage that cuts detention fees in temperature-sensitive pharma lanes. Blockchain bills of lading shorten letter-of-credit cycles and deter documentation fraud, yet widespread adoption is slowed by the need for carrier and customs interoperability. Forwarders that integrate these tools enhance trust and command premium rates in the freight forwarding market[2]“Pharmaceutical Logistics Outlook 2024,” International Air Transport Association, iata.org.
Near-Shoring and China-Plus-One Trade Shifts
Vietnam attracted USD 20.3 billion in manufacturing FDI during 2024, and India drew USD 84 billion in the same period, underscoring diversification away from single-country sourcing. Longer ocean transits are motivating multimodal solutions that blend ocean and rail to compress lead times. Inland depots in Vietnam and India allow pre-clearance that lowers dwell times and detention costs. Rail corridors such as the China-Europe Railway Express moved 1.8 million TEUs in 2024, supplying a middle-ground option between air speed and ocean cost. The freight forwarding market is reallocating capacity toward nodes that can pivot quickly as sourcing footprints evolve.
Cold-Chain Investment for Pharma and Food
Global cold-chain capacity added 23 million cubic meters in 2024, with pharmaceuticals accounting for 38% of new space. Biologic drugs, mRNA vaccines, and cell therapies require GDP-certified facilities and validated packaging, raising operational barriers and enabling price premiums. Fresh-produce exporters in Latin America and Africa depend on sub-5 °C corridors to uphold shelf life for avocados, berries, and seafood. IoT sensors feed blockchain audit trails to satisfy EU GDP and United States FSMA rules that demand continuous temperature records. Specialized providers, therefore, capture high-margin lanes within the freight forwarding market.
Restraints Impact Analysis*
| Restraint | (~) % Impact on CAGR Forecast | Geographic Relevance | Impact Timeline |
|---|---|---|---|
| Port congestion and container imbalances | -0.9% | Global, acute in North America, Europe, and Asia | Short term (≤ 2 years) |
| Global driver and warehouse labor shortage | -0.7% | North America and Europe, emerging in Asia-Pacific | Medium term (2-4 years) |
| Geopolitical flashpoints and route risk | -0.8% | Global, concentrated in Red Sea, Suez Canal, and Black Sea | Short term (≤ 2 years) |
| Tightening de-minimis thresholds and compliance burden | -0.4% | North America and Europe, spill-over to Asia-Pacific e-commerce hubs | Medium term (2-4 years) |
| Source: Mordor Intelligence | |||
Port Congestion and Container Imbalances
Average dwell times at Los Angeles and Long Beach climbed to 6.2 days in early 2025, up from 4.8 days in 2023, while empty-container repositioning costs rose 22% in 2024. Structural imbalances create surplus boxes in import-heavy regions and scarcity in export zones, driving up detention fees. Inland depots and container-sharing pacts mitigate some expense, yet chassis shortages and rail yard congestion remain persistent bottlenecks that weigh on the freight forwarding market[3]“Port Performance Statistics,” Port of Los Angeles, portoflosangeles.org .
Global Driver and Warehouse Labor Shortage
The United States faced a deficit of 78,000 truck drivers in 2024, a shortfall expected to reach 160,000 by 2030. Warehouse turnover exceeded 40% in North America and Europe, spurring wage inflation and forcing investment in robotics that only large hubs can justify. Last-mile delivery is hit hardest, imperiling same-day promises for e-commerce parcels. Smaller forwarders without capital for automation remain exposed, limiting service quality in the freight forwarding market[4]“Driver Shortage Forecast,” American Trucking Associations, trucking.org.
*Our forecasts treat driver/restraint impacts as directional, not additive. The impact forecasts reflect baseline growth, mix effects, and variable interactions.
Segment Analysis
By Mode of Transport: Multimodal Solutions Accelerate Flexibility
Ocean freight forwarding retained a 61.77% freight forwarding market share in 2025, driven by cost efficiency on dense lanes. Yet multimodal and intermodal forwarding is advancing at a 6.40% CAGR (2026-2031) as shippers balance speed, cost, and carbon impact. Less-than-container load volumes increase with e-commerce fragmentation, widening consolidation complexity. Road forwarding connects last-mile nodes, but driver shortages and fuel volatility tilt inland moves toward rail where infrastructure allows. Air forwarding protects semiconductor and pharmaceutical supply lines, although capacity caps and carbon surcharges temper growth. Rail corridors such as the China-Europe Railway Express offer 15- to 20-day transits that fill the gap between air and ocean.
The freight forwarding market is restructuring networks to blend ocean trunk haul with rail or air final legs, reducing buffer inventory without incurring full air premiums. Digital cost-time simulators guide mode selection based on stockout penalties and inventory carrying costs. Regulatory pressure from the IMO Carbon Intensity Indicator spurs modal shifts toward lower-emission combinations, especially for non-urgent cargo. Forwarders that orchestrate seamless handoffs and provide unified visibility capture share as shippers exit single-mode contracts.


By Enterprise Size: Digital Platforms Propel SME Penetration
Large enterprises contributed 68.50% of forwarding revenue in 2025, leveraging volume to negotiate contract rates, but SMEs are expanding at a 6.53% CAGR (2026-2031) as digital tools democratize access. Historically, SMEs lacked the scale to secure competitive pricing or manage customs intricacies. Platforms such as Flexport aggregate fragmented demand, provide instant quotes, and automate documentation, removing broker dependency and helping SMEs expand faster.
As the freight forwarding market evolves, large shippers still prize tailored solutions and account teams, yet they pilot digital dashboards to benchmark incumbent service. A two-tier dynamic emerges: SMEs value transparency and speed, whereas large accounts prioritize relationship continuity. Providers that deliver self-service portals alongside white-glove expertise can span both clusters, capturing incremental volumes without diluting service quality.
By Forwarder Model: Digital Disruption Challenges Legacy Brokers
Traditional asset-light forwarders controlled 81.35% of revenue in 2025, but digital-first platforms are rising at a 17.84% CAGR (2026-2031), offering API-driven pricing and real-time capacity. Online players automate quote-to-book processes, freeing shippers from email chains and manual phone calls. Hybrid asset-enabled forwarders balance owned warehouses and trucks with digital interfaces, providing service guarantees that pure brokers cannot match.
Legacy IT systems slow incumbent progress, yet investments in proprietary platforms such as C.H. Robinson’s Navisphere show determination to protect share. The freight forwarding market rewards operators that fuse long-standing carrier relationships with digital agility, while those who delay modernization suffer margin squeeze as transparency becomes a universal expectation.
By End-User Industry: Healthcare Drives High-Margin Expansion
Retail and e-commerce generated 29.52% of forwarding revenue in 2025, still the largest slice of the freight forwarding market. However, healthcare and pharmaceuticals lead growth with an 8.50% CAGR (2026-2031), fueled by biologic approvals and cell-therapy commercialization that demand a stringent cold chain. Industrial manufacturing remains stable, relying on predictable ocean and rail services for just-in-time production. Food and beverage volumes grow on Latin American and African exports that must uphold sub-5 °C integrity. Automotive forwarding stabilizes as electric-vehicle battery moves to gain hazmat complexity. Chemical cargo faces capacity limits because of regulatory hurdles.
Forwarders specializing in healthcare deploy GDP-certified sites, validated packaging, and continuous monitoring, commanding higher yields. Others pursue volume strategies in retail, accepting thinner margins. Segment divergence drives strategic focus within the freight forwarding market as players weigh specialization against scale.
Geography Analysis
Asia-Pacific generated 36.49% of forwarding revenue in 2025 and is set to grow at a 7.80% CAGR between 2026-2031, the quickest regional climb in the freight forwarding market. China remains the largest single origin, yet Vietnam, India, and Indonesia collect rising investment under China-plus-one diversification. Singapore and Hong Kong anchor regional consolidations thanks to superior port efficiency and trade finance ecosystems. Japan and South Korea ship high-value electronics and automotive parts, while Australia ships bulk commodities and absorbs e-commerce imports.
North America remains an import-heavy destination, but chronic port congestion and labor scarcity inflate handling costs. Shippers divert to Gulf and East Coast gateways and expand cross-border rail through Mexico under USMCA provisions. Canada’s forwarding flows align with energy and automotive trade, while Mexico benefits from near-shoring that relocates parts of electronics and auto production from Asia.
Europe holds a mature forwarding base centered on Germany, the Netherlands, and the United Kingdom. Brexit-induced customs friction and warehouse labor shortages moderate growth. Scandinavia and Central and Eastern Europe gain niche volumes through specialized corridors such as pharma and automotive parts. South America, the Middle East, and Africa account for smaller slices but rise as infrastructure upgrades and trade pacts improve connectivity, enlarging the freight forwarding market.

Competitive Landscape
The top 10 forwarders captured an estimated 35% to 40% of global revenue in 2025, indicating a low-concentration freight-forwarding market. Competition intensifies as digital entrants leverage venture funding to scale carrier APIs and visibility tools, courting SMEs and mid-market shippers that prefer transparency over legacy relationships. DSV’s USD 15.1 billion purchase of DB Schenker in 2024 illustrates consolidation by incumbents seeking scale to match online rivals.
Forwarders deploy generative AI for dynamic load matching, optimizing container utilization, and forecasting port delays. C.H. Robinson processed 19 million shipments through its AI-enabled Navisphere in 2024, reinforcing that technology is now the primary differentiator. Shipper ESG goals spur investment in carbon dashboards and Sustainable Aviation Fuel contracts, forging a premium green tier within the freight forwarding market.
Incumbents holding multinational contracts defend share with global branch networks and customs expertise, while digital-first movers attract rapid-growth SMEs. The landscape therefore bifurcates into relationship-centric and technology-centric battlegrounds.
Freight Forwarding Industry Leaders
Kuehne+Nagel
DHL Group
C.H. Robinson
Expeditors International of Washington, Inc.
DSV A/S
- *Disclaimer: Major Players sorted in no particular order

Recent Industry Developments
- November 2025: Uber Freight expanded its alliance with Better Trucks to include electric last-mile vehicles and advanced telematics.
- November 2025: Sinotrans and LX Pantos created a joint venture to address the Northeast Asia sea-air multimodal demand.
- July 2025: Yusen Logistics acquired Walden Group’s Movianto healthcare arm for EUR 1.25 billion (USD 1.33 billion), adding GDP-compliant facilities.
- April 2025: UPS Supply Chain Solutions purchased Andlauer Healthcare Group for CAD 1.6 billion (USD 1.19 billion), expanding North American pharma distribution.


Research Methodology Framework and Report Scope
Market Definitions and Key Coverage
We define the freight forwarding market as all gross revenue earned by licensed intermediaries that arrange international or domestic cargo movement across ocean, air, road, rail, and multimodal corridors, including related documentation, consolidation, customs brokerage, insurance facilitation, and value-added supply-chain services. According to Mordor Intelligence, revenue generated by internal carrier divisions that act as forwarders is counted, while pure trucking, warehousing-only contracts, and in-house shipper logistics teams remain outside the scope.
Scope exclusion: Dedicated parcel/CEP networks and asset-heavy trucking fleets offering no brokerage function are excluded.
Segmentation Overview
- By Mode of Transport
- Ocean Freight Forwarding
- Full Container Load (FCL)
- Less-Than-Container Load (LCL)
- Road Freight Forwarding
- Full Truck Load (FTL)
- Less-Than-Truck Load (LTL)
- Air Freight Forwarding
- Rail Freight Forwarding
- Multimodal and Intermodal Forwarding
- Ocean Freight Forwarding
- By Enterprise Size
- Small and Medium Enterprises
- Large Enterprises
- By Forwarder Model
- Traditional Asset-Light Forwarders
- Digital-First / Online Platforms
- Hybrid Asset-Enabled Forwarders
- By End-user Industry
- Industrial and Manufacturing
- Retail and E-commerce
- Healthcare and Pharmaceuticals
- Oil, Gas and Energy
- Food and Beverages
- Automotive
- Chemicals
- Other End-users
- By Geography
- North America
- United States
- Canada
- Mexico
- South America
- Brazil
- Argentina
- Chile
- Rest of South America
- Europe
- Germany
- United Kingdom
- France
- Spain
- Italy
- Netherlands
- Russia
- Rest of Europe
- Asia-Pacific
- China
- India
- Japan
- South Korea
- Singapore
- Vietnam
- Indonesia
- Australia
- Rest of Asia-Pacific
- Middle East and Africa
- Saudi Arabia
- United Arab Emirates
- Turkey
- South Africa
- Nigeria
- Egypt
- Rest of Middle East and Africa
- North America
Detailed Research Methodology and Data Validation
Primary Research
Interviews with senior forwarder executives, regional carrier partners, customs officials, and large B2B shippers across Asia-Pacific, North America, Europe, and emerging trade hubs help us validate service mix splits, average selling prices, and lane-specific growth assumptions. Follow-up surveys with SME exporters refine our e-commerce penetration inputs.
Desk Research
Our team reviews government trade datasets such as UNCTAD port throughput, IATA air-cargo market analysis, WTO tariff trackers, Eurostat freight indices, and US Census import-export statistics, which collectively outline cargo flows and pricing baselines. We also screen industry association white papers, peer-reviewed journals on logistics technology, and public filings to size forwarder revenue pools.
Next, we tap paid sources from Mordor's subscription stack, D&B Hoovers for company financials and Dow Jones Factiva for deal news, which sharpen competitor benchmarking. These references anchor our estimates, yet they are illustrative; many additional sources inform the final model.
Market-Sizing & Forecasting
We begin with a top-down construct that rebuilds forwarding revenue from global merchandise trade value and mode-wise freight cost ratios, followed by sampled ASP × volume checks on major lanes to ground the totals. Supplier roll-ups and port channel checks plug residual gaps before results are reconciled. Key variables like container freight indices, jet-fuel spreads, cross-border e-parcel counts, PMI manufacturing scores, and regulatory fee changes drive both the historical baseline and the five-year multivariate-regression forecast. Where bottom-up estimates undershoot due to private-company opacity, weighted averages from publicly listed peers are imputed and transparently flagged.
Data Validation & Update Cycle
Outputs face a three-layer review: automated variance scans, analyst peer audit, and finally our senior freight specialist sign-off. Mordor reports refresh annually, with interim updates triggered by material events such as tariff shifts or major M&A; a last-mile sense-check is run just before client delivery.
Why Mordor's Freight Forwarding Baseline Drives Reliable Decisions
Published estimates often diverge because firms count different services, convert currencies at varied dates, or refresh their models irregularly, and we acknowledge that reality upfront.
Key gap drivers include Mordor's inclusion of ancillary brokerage fees, multi-country revenue allocation, and an annual refresh cadence, whereas others may track only sea and air freight or stop at pure-play forwarders. Some peers apply uniform price escalators without lane granularity, while our analysts adjust for bunker-fuel surcharges, digital-platform mark-ups, and regional e-commerce momentum.
Benchmark comparison
| Market Size | Anonymized source | Primary gap driver |
|---|---|---|
| USD 572.25 B | Mordor Intelligence | - |
| USD 225.38 B | Global Consultancy A | Omits domestic forwarding and value-added services |
| USD 213.94 B | Industry Association B | Uses freight charges only, excludes digital and brokerage revenue |
| USD 184.94 B | Trade Journal C | Covers air and ocean modes but not road, rail, multimodal |
These comparisons show that Mordor's wider service coverage and disciplined refresh cycle produce a balanced, transparent baseline that decision-makers can trace back to clearly stated variables and repeatable steps.


Key Questions Answered in the Report
What is the projected value of the freight forwarding market in 2031?
The freight forwarding market is forecast to reach USD 776.04 billion by 2031, growing at a 5.19% CAGR (2026-2031).
Which mode of transport is expanding quickest within forwarding?
Multimodal and intermodal forwarding is the fastest-growing mode, advancing at a 6.40% CAGR between 2026-2031.
Why are SMEs gaining ground in forwarding spend?
Digital platforms aggregate SME shipments, provide instant quotes, and automate documentation, lowering barriers to entry and enabling 6.53% CAGR (2026-2031) growth among SMEs.
Which end-user segment shows the highest growth potential?
Healthcare and pharmaceuticals lead with an 8.50% CAGR (2026-2031) due to biologic and cell-therapy cold-chain requirements.
How is Asia-Pacific influencing global forwarding flows?
Asia-Pacific accounts for 36.49% of revenue and is expanding at a 7.80% CAGR (2026-2031) as production shifts toward Vietnam, India, and Indonesia under China-plus-one strategies.
What technology trends are reshaping competitive dynamics?
Generative AI for load matching, real-time shipment visibility platforms, and carbon-accounting dashboards are becoming essential differentiators among forwarders.
Page last updated on:


