Internet Of Everything Market Size and Share
Market Overview
| Study Period | 2019 - 2030 |
|---|---|
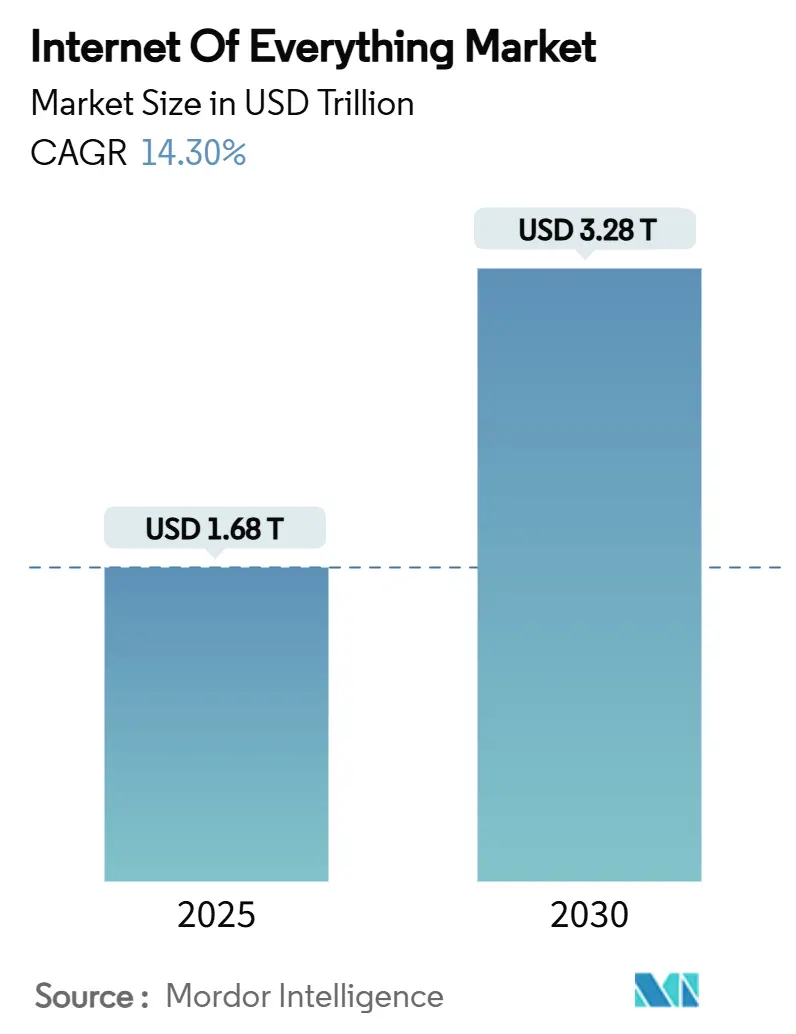
| Market Size (2025) | USD 1.68 Trillion |
| Market Size (2030) | USD 3.28 Trillion |
| Growth Rate (2025 - 2030) | 14.30% CAGR |
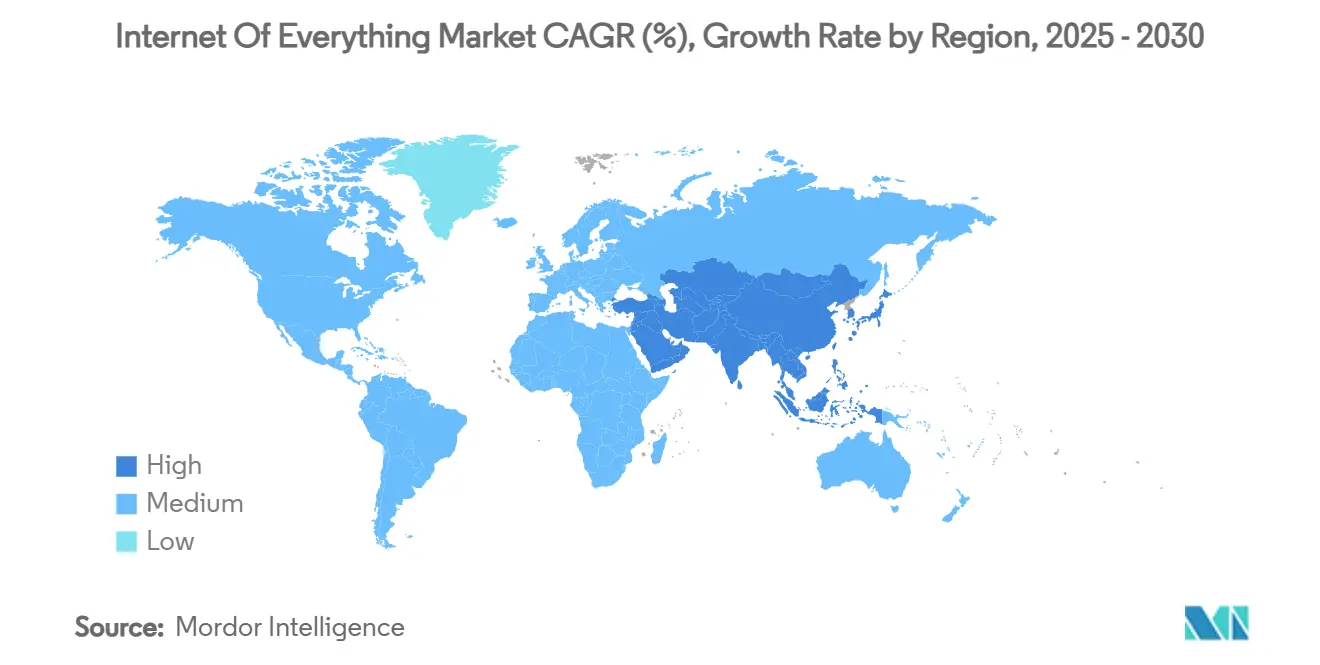
| Fastest Growing Market | Asia Pacific |
| Largest Market | North America |
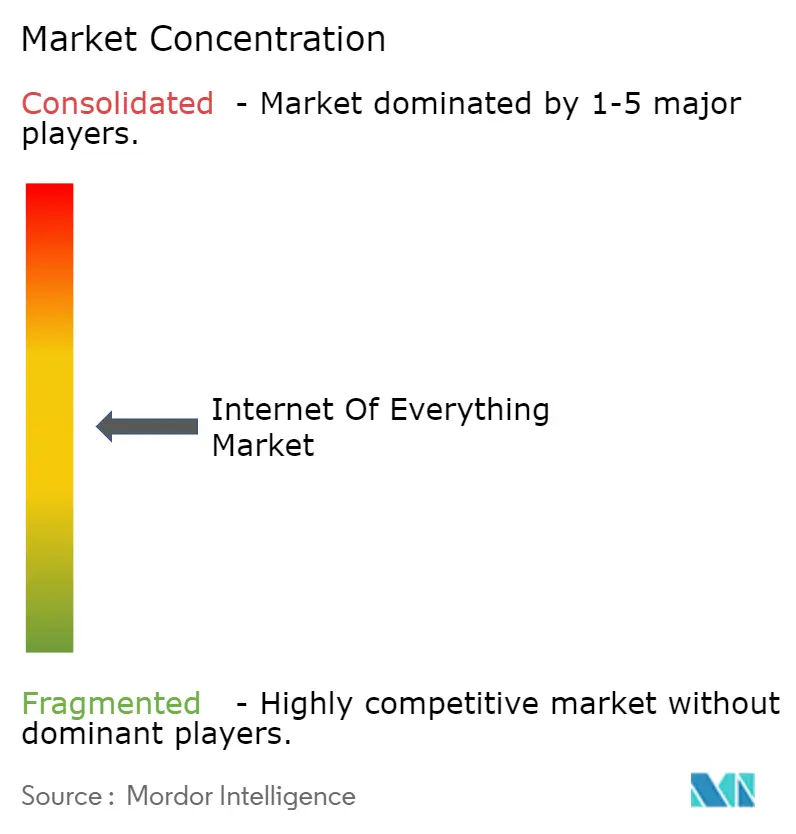
| Market Concentration | Medium |
Major Players *Disclaimer: Major Players sorted in no particular order Image © Mordor Intelligence. Reuse requires attribution under CC BY 4.0. | |
Internet Of Everything Market Analysis by Mordor Intelligence
The Internet of Everything market size is estimated at USD 1.68 trillion in 2025 and is projected to reach USD 3.28 trillion by 2030, reflecting a 14.3% CAGR over the forecast period. Growth is underpinned by the roll-out of 5G networks that support device densities of up to 1 million connections per square kilometer. Falling sensor prices, with Bluetooth Low Energy modules available for under USD 2, continue to expand viable use cases. Government-funded smart-city programs worth USD 124 billion in 2024 are catalyzing deployments in traffic control, waste collection, and energy-efficient district cooling. Enterprises are simultaneously investing in edge analytics to turn raw data into real-time operational intelligence while non-terrestrial networks extend coverage to remote assets. Taken together, these forces are reshaping competitive dynamics, opening new service opportunities, and intensifying the need for strong cybersecurity governance.
Key Report Takeaways
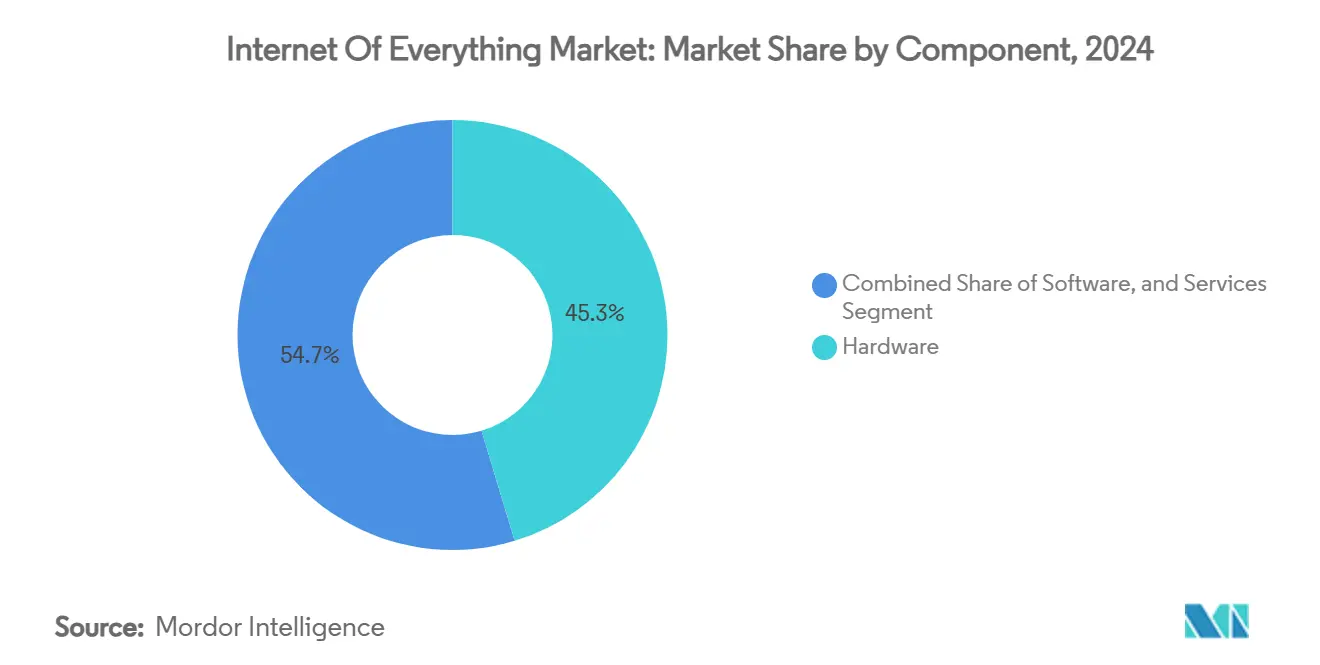
- By component, hardware led with 45.32% of Internet of Everything market share in 2024, whereas services are forecast to post the fastest 14.36% CAGR through 2030.
- By network technology, Wi-Fi commanded 41.89% revenue share in 2024, while 5G is accelerating at a 14.89% CAGR to 2030.
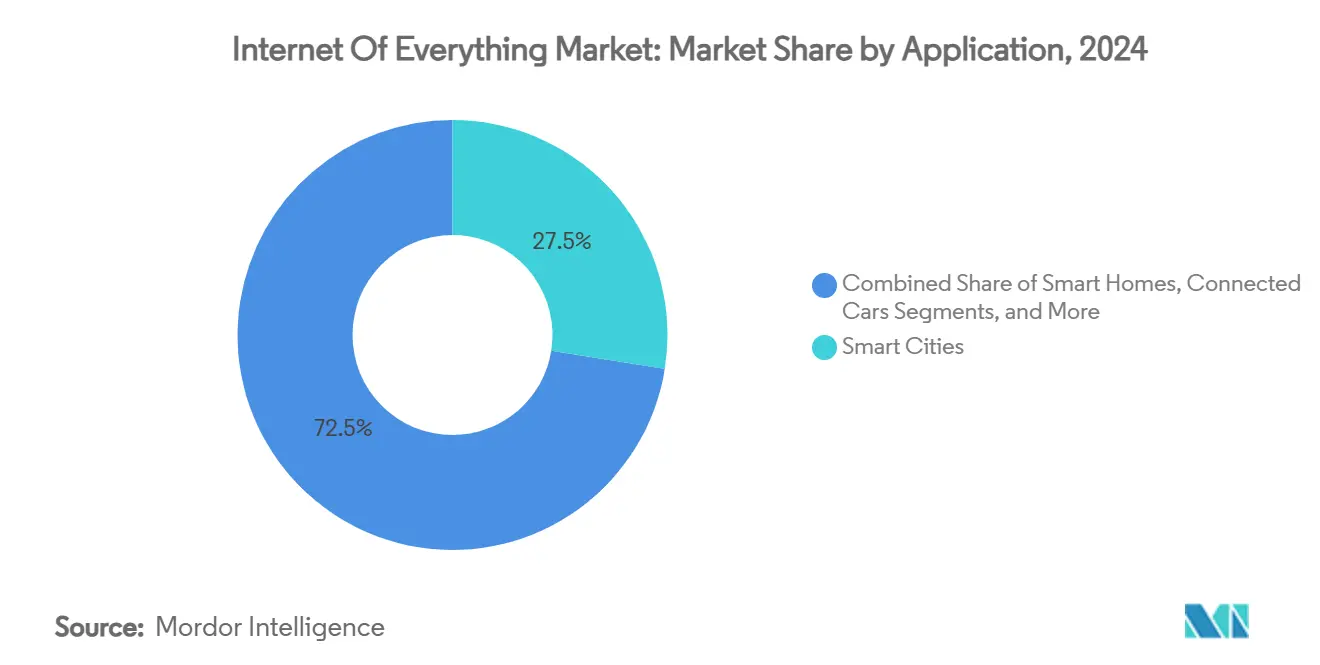
- By application, smart cities held 27.51% share of the Internet of Everything market size in 2024 and smart healthcare is advancing at a 14.76% CAGR through 2030.
- By industry vertical, manufacturing accounted for 22.74% of Internet of Everything market share in 2024 and healthcare is projected to expand at a 14.98% CAGR between 2025 and 2030.
- By geography, North America led with 35.67% revenue share in 2024, while Asia-Pacific is forecast to grow at a 14.83% CAGR to 2030.
Global Internet Of Everything Market Trends and Insights
Drivers Impact Analysis*
| Driver | (~) % Impact on CAGR Forecast | Geographic Relevance | Impact Timeline |
|---|---|---|---|
| Proliferation of 5G networks enabling massive IoT connections | +2.5% | Global; early North America, China, South Korea | Medium term (2-4 years) |
| Declining sensor and module costs | +2.1% | Global; Asia-Pacific and LATAM benefit | Short term (≤ 2 years) |
| Government-funded smart-city programmes | +1.8% | Europe, North America, China | Long term (≥ 4 years) |
| Enterprise demand for real-time operational analytics | +1.4% | North America, Europe expanding to Asia-Pacific | Medium term (2-4 years) |
| Satellite IoT constellations | +1.2% | Global; rural Americas, Africa, Australia | Long term (≥ 4 years) |
| AIoT edge-inference chipsets | +0.9% | Developed markets | Medium term (2-4 years) |
| Source: Mordor Intelligence | |||
Proliferation of 5G Networks Enabling Massive IoT Connections
Ultra-low-latency 5G architecture supports mission-critical automation by shrinking round-trip delays to 1 millisecond, enabling factory robots and autonomous vehicles to react in real time. [1]GSMA, “Case Studies,” gsma.com Network slicing lets operators allocate dedicated virtual lanes that guarantee bandwidth for connected production lines, while integrated eSIM platforms simplify global device onboarding. Telcos are pairing 5G with multi-access edge computing to deliver sub-10 millisecond response times in pilot manufacturing sites. As coverage expands, the Internet of Everything market will transition from pilot projects to scaled deployments across logistics, agriculture and infrastructure.
Declining Sensor and Module Costs Make Deployment Viable
Manufacturing efficiencies have driven average IoT sensor prices down 40% since 2020. [2]Nature, “Analytical Approach to Smart and Sustainable City Development with IoT,” nature.com Volume Bluetooth Low Energy modules now cost less than USD 2, while LoRaWAN units have slipped below USD 10, making precision agriculture and air-quality monitoring feasible in cost-sensitive regions. Chinese fabs are boosting supply capacity, intensifying price competition without compromising quality. These economics unlock smaller-scale proof-of-concepts that can be replicated across thousands of devices, accelerating penetration of the Internet of Everything market in emerging economies.
Government-Funded Smart-City Programmes Accelerate Adoption
Cities worldwide earmarked USD 124 billion in 2024 for connected infrastructure, with Barcelona’s Sentilo platform often cited as a reference architecture. [3]Opentrends, “Building Smart Cities With a Sensor and Actuator IoT Platform,” opentrends.us Singapore’s Smart Nation initiative reports 30% energy savings from centralized IoT-controlled cooling, validating positive cost-benefit outcomes. Public procurement frameworks reduce vendor-selection friction and stimulate private co-investment, creating a multiplier effect that scales the Internet of Everything market beyond direct municipal budgets.
Enterprise Demand for Real-Time Operational Analytics
Industrial firms view data-driven uptime as a competitive weapon. Schneider Electric attributes multi-billion-euro data-center revenues to digitized asset monitoring that trims maintenance costs and extends equipment life. Cloud-agnostic edge gateways crunch sensor data locally, lowering bandwidth fees and enabling sub-second decision loops that optimize energy use and worker safety. The appetite for outcome-based analytics platforms is set to widen the services opportunity inside the Internet of Everything market.
Restraints Impact Analysis*
| Restraint | (~) % Impact on CAGR Forecast | Geographic Relevance | Impact Timeline |
|---|---|---|---|
| Cyber-security vulnerabilities across heterogeneous devices | -1.1% | Global; acute in North America and Europe | Short term (≤ 2 years) |
| Inter-operability gaps among multiple protocols | -0.8% | Global; enterprise deployments hit hardest | Medium term (2-4 years) |
| Capital-intensive retrofitting of legacy assets | -0.7% | Developed markets with aging plants | Long term (≥ 4 years) |
| Circular-economy e-waste rules | -0.4% | Europe expanding to North America and Asia-Pacific | Medium term (2-4 years) |
| Source: Mordor Intelligence | |||
Cyber-Security Vulnerabilities Across Heterogeneous Devices
Each unmanaged end-point widens the attack surface, and many low-power nodes lack the compute budget to support robust encryption. SEALSQ is developing quantum-resistant chips to future-proof IoT security, underscoring looming risks as quantum computing matures. Enterprises frequently delay roll-outs until third-party penetration tests validate device hardening and over-the-air patch pathways, curbing near-term expansion of the Internet of Everything market.
Inter-Operability Gaps Among Multiple Protocols
LoRaWAN, NB-IoT and Wi-Fi often coexist within a single facility, forcing integrators to stitch bespoke gateways and data models. Although the LoRa Alliance has released a development roadmap targeting seamless device-management APIs, fragmentation persists. The resulting vendor lock-in elevates project risk and total cost of ownership, slowing enterprise migration to large-scale, multi-site Internet of Everything architectures.
*Our forecasts treat driver/restraint impacts as directional, not additive. The impact forecasts reflect baseline growth, mix effects, and variable interactions.
Segment Analysis
By Component: Services Segment Accelerates Despite Hardware Dominance
Hardware contributed 45.32% of Internet of Everything market share in 2024, reflecting the essential need for sensors, micro-controllers and connectivity modules. The services category is forecast to clock a 14.36% CAGR, outpacing both hardware and software.
Demand for managed connectivity, device orchestration and data analytics is rising as enterprises outsource complexity to specialist providers. 1NCE’s all-inclusive subscription model spans 170 countries and exemplifies how bundled connectivity plus software can generate recurring revenue. This shift toward outcome-based contracting positions the services layer as a prime growth engine for the Internet of Everything market.


By Network Technology: 5G Cellular Disrupts Wi-Fi Leadership
Wi-Fi held 41.89% of revenue in 2024 based on its ubiquity and zero licensing fees. Yet 5G is forecast to grow at 14.89% CAGR as operators densify small-cell grids and enable guaranteed service levels via network slicing.
The Internet of Everything market size for 5G-connected endpoints is expected to expand sharply when Release 18 introduces native support for non-terrestrial networks. Satellite-cellular hybrids are already bridging coverage gaps across logistics corridors, ensuring always-on telemetry regardless of terrain. Wi-Fi 7’s promised 4.8 Gbps throughput may slow cellular cannibalization inside campuses, but wide-area mobility keeps 5G on a steeper trajectory.
By Application: Smart Healthcare Outpaces Smart Cities Growth
Smart-city solutions accounted for 27.51% of Internet of Everything market size in 2024 on the back of large-scale traffic, lighting and waste projects. Looking ahead, smart healthcare applications are projected to register the strongest 14.76% CAGR.
Regulatory approvals for remote patient monitoring and insurer reimbursement for virtual wards are catalyzing device adoption that cuts hospital readmission by 25%. Hospitals employ connected infusion pumps and asset tags to track equipment, curbing loss and ensuring maintenance compliance. These dynamics will lift the Internet of Everything market across payer and provider ecosystems.
By Industry Vertical: Healthcare Segment Leads Growth Despite Manufacturing Scale
Manufacturing represented 22.74% Internet of Everything market share in 2024, having long embraced predictive maintenance and quality analytics. Healthcare is forecast to expand at a 14.98% CAGR as connected inhalers, glucose monitors and cold-chain tracking safeguard patient outcomes.
Pharma companies leverage smart packaging with disposable sensors that verify drug integrity during transit, reducing spoilage and counterfeiting. Meanwhile, predictive downtime analytics continue to save factories millions in avoided repairs, anchoring manufacturing’s absolute spending dominance within the Internet of Everything market.
Geography Analysis
North America controlled 35.67% of the Internet of Everything market share in 2024, thanks to early-stage 5G roll-out, supportive data-governance statutes, and deep enterprise digitization budgets. United States manufacturers deploy connected machinery to cut unplanned stoppages, while Canadian municipalities prioritize smart-grid upgrades to integrate renewable power. Mexico’s export-oriented factories are embedding sensors that improve quality and traceability, aligning with nearshoring trends that favor automated, data-rich facilities.
Asia-Pacific is projected to post a 14.83% CAGR, narrowing the gap with North America. China alone hosts 2.57 billion IoT terminals, riding aggressive 5G coverage and industrial policy incentives. Japan targets robotics to mitigate labor shortages, South Korea pilots 5G-based autonomous shuttles, and India benefits from USD 3 billion in AI-cloud investment commitments that extend low-cost analytics to tier-2 cities. Regional governments increasingly bundle spectrum allocations with smart-city grants, accelerating adoption across public services and manufacturing corridors.
Europe remains a steady adopter, guided by circular-economy mandates that prescribe device recyclability and data-privacy rules that influence platform design. Germany’s Industrie 4.0 backbone anchors industrial deployments, while the United Kingdom invests in connected healthcare pilots that relieve pressure on overstretched hospitals. The Middle East and Africa present greenfield opportunities: the UAE tests drone-enabled logistics corridors, Saudi Arabia embeds IoT in mega-projects like NEOM, and South Africa applies remote sensing to manage water and energy distribution. Collectively, infrastructure build-outs and regulatory reforms will broaden geographic participation in the Internet of Everything market.

Competitive Landscape
The Internet of Everything market is moderately fragmented, with diversified tech majors competing alongside niche innovators. Cisco, Huawei and Qualcomm offer end-to-end stacks covering silicon, networking gear and device orchestration software, securing multiyear contracts with global operators. Intel leverages x86 edge servers and Open VINO toolkits to sell inference-at-the-edge bundles, while IBM pairs Red Hat’s OpenShift with Maximo asset-monitoring software to court industrial clients.
Strategic moves reveal a shift toward vertical integration. Qualcomm’s USD 249 million acquisition of Sequans adds dual-mode 5G-NB-IoT chipsets that reduce bill-of-materials for connected meters. LG purchased Athom to unify smart-home devices under a single ecosystem, mirroring Apple’s HomePod strategy. Wiliot raised USD 200 million to commercialize self-powered IoT pixels that cost pennies, bringing item-level visibility to supply chains.
Capital efficiency and specialized IP help challengers thrive. Axelera AI’s Metis edge-inference unit processes 214 TOPS at <10 W, attracting OEMs seeking to cut cloud bills. 1NCE differentiates with predictable global pricing, onboarding 30 million active SIMs. These focused plays push incumbents to broaden product lines and secure supply-chain partnerships, intensifying competition across connectivity, security and analytics layers of the Internet of Everything market.
Internet Of Everything Industry Leaders
Cisco Systems, Inc.
Huawei Technologies Co., Ltd.
Qualcomm Incorporated
Intel Corporation
IBM Corporation
- *Disclaimer: Major Players sorted in no particular order

Recent Industry Developments
- March 2025: Semtech launched the LoRa Plus LR2021 transceiver with LoRa Gen 4 technology, improving range and power efficiency for industrial deployments.
- February 2025: SEALSQ unveiled its SEAL Quantum roadmap and picosatellite constellation to harden future IoT networks against quantum attacks.
- February 2025: Digi International posted USD 104 million Q1 FY2025 revenue, with Annualized Recurring Revenue up 11% to USD 120 million on strong IoT demand.
- January 2025: Myriota raised USD 50 million to expand its satellite IoT network for remote asset monitoring.


Global Internet Of Everything Market Report Scope
| Hardware |
| Software |
| Services |
| Wi-Fi |
| Cellular (2G/3G/4G/5G) |
| LPWAN (LoRa, Sigfox, NB-IoT) |
| Bluetooth and BLE |
| NFC |
| Satellite IoT |
| Wired Ethernet |
| Smart Homes |
| Smart Cities |
| Connected Cars |
| Smart Manufacturing (IIoT) |
| Smart Healthcare |
| Smart Utilities (Grid) |
| Smart Retail |
| Smart Agriculture |
| Smart Logistics and Fleet |
| Manufacturing |
| Retail |
| BFSI |
| IT and Telecom |
| Healthcare |
| Government and Public Sector |
| Energy and Utilities |
| Transportation and Logistics |
| Agriculture |
| Real Estate / Smart Buildings |
| North America | United States | |
| Canada | ||
| Mexico | ||
| South America | Brazil | |
| Argentina | ||
| Rest of South America | ||
| Europe | Germany | |
| United Kingdom | ||
| France | ||
| Russia | ||
| Rest of Europe | ||
| Asia-Pacific | China | |
| Japan | ||
| India | ||
| South Korea | ||
| Australia | ||
| Rest of Asia-Pacific | ||
| Middle East and Africa | Middle East | Saudi Arabia |
| United Arab Emirates | ||
| Rest of Middle East | ||
| Africa | South Africa | |
| Egypt | ||
| Rest of Africa | ||
| By Component | Hardware | ||
| Software | |||
| Services | |||
| By Network Technology | Wi-Fi | ||
| Cellular (2G/3G/4G/5G) | |||
| LPWAN (LoRa, Sigfox, NB-IoT) | |||
| Bluetooth and BLE | |||
| NFC | |||
| Satellite IoT | |||
| Wired Ethernet | |||
| By Application | Smart Homes | ||
| Smart Cities | |||
| Connected Cars | |||
| Smart Manufacturing (IIoT) | |||
| Smart Healthcare | |||
| Smart Utilities (Grid) | |||
| Smart Retail | |||
| Smart Agriculture | |||
| Smart Logistics and Fleet | |||
| By Industry Vertical | Manufacturing | ||
| Retail | |||
| BFSI | |||
| IT and Telecom | |||
| Healthcare | |||
| Government and Public Sector | |||
| Energy and Utilities | |||
| Transportation and Logistics | |||
| Agriculture | |||
| Real Estate / Smart Buildings | |||
| By Geography | North America | United States | |
| Canada | |||
| Mexico | |||
| South America | Brazil | ||
| Argentina | |||
| Rest of South America | |||
| Europe | Germany | ||
| United Kingdom | |||
| France | |||
| Russia | |||
| Rest of Europe | |||
| Asia-Pacific | China | ||
| Japan | |||
| India | |||
| South Korea | |||
| Australia | |||
| Rest of Asia-Pacific | |||
| Middle East and Africa | Middle East | Saudi Arabia | |
| United Arab Emirates | |||
| Rest of Middle East | |||
| Africa | South Africa | ||
| Egypt | |||
| Rest of Africa | |||


Key Questions Answered in the Report
How large is the Internet of Everything market in 2025?
It is valued at USD 1.68 trillion and is forecast to grow to USD 3.28 trillion by 2030 at a 14.3% CAGR.
Which region is expanding the fastest?
Asia-Pacific is rising at a 14.83% CAGR on the back of manufacturing digitization, smart-city grants and rapid 5G roll-out.
What component segment is growing quickest?
Services are projected to post a 14.36% CAGR as enterprises outsource connectivity, security and analytics.
How will 5G influence adoption?
5G’s ultra-low latency and high device density enable real-time control and massive sensor deployments across factories, logistics and urban infrastructure.
What is the main barrier to enterprise scale-up?
Cyber-security gaps across heterogeneous devices slow adoption as firms invest time and capital in hardening endpoints and ensuring continuous patching.
Which application area is set for the strongest growth to 2030?
Smart healthcare is forecast to expand at a 14.76% CAGR driven by remote patient monitoring, connected therapeutics and virtual care reimbursement.
Page last updated on:


