Wireless Network Security Market Size and Share
Market Overview
| Study Period | 2020 - 2031 |
|---|---|
| Market Size (2026) | USD 25.46 Billion |
| Market Size (2031) | USD 43.84 Billion |
| Growth Rate (2026 - 2031) | 11.47% CAGR |
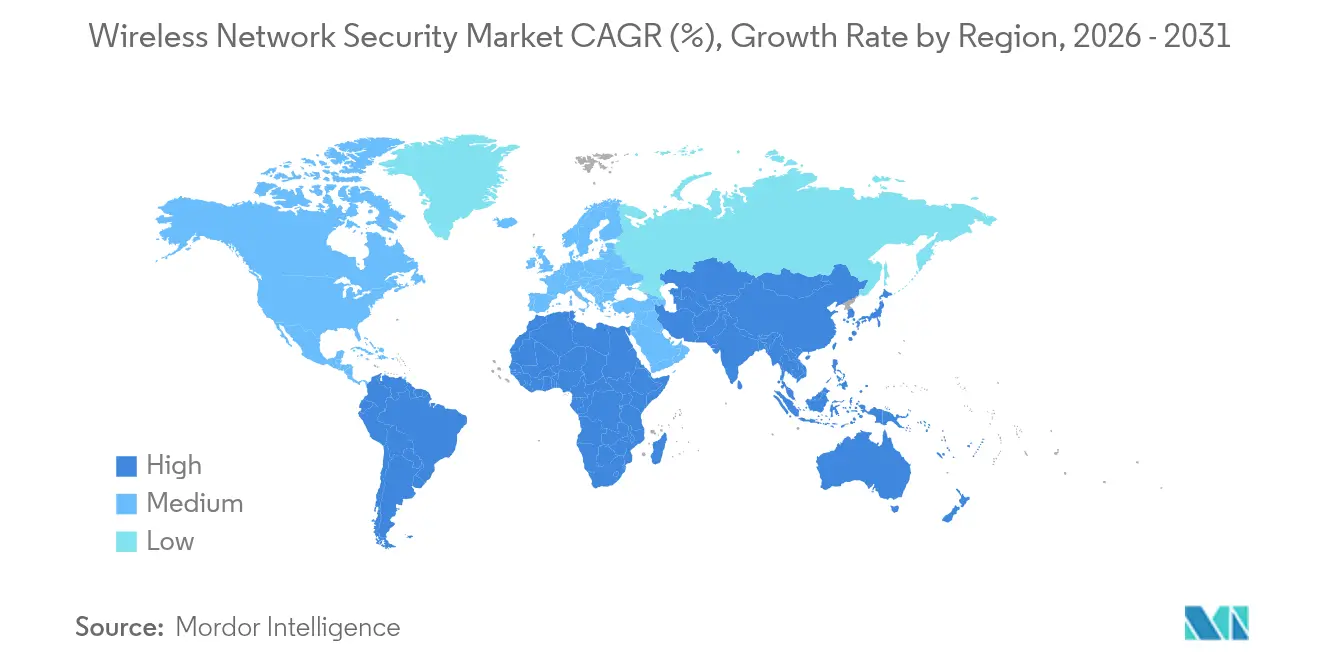
| Fastest Growing Market | Asia Pacific |
| Largest Market | North America |
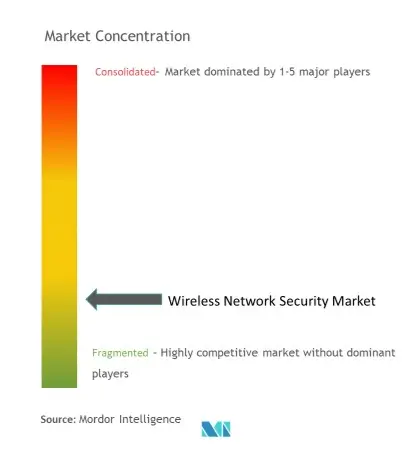
| Market Concentration | Low |
Major Players *Disclaimer: Major Players sorted in no particular order Image © Mordor Intelligence. Reuse requires attribution under CC BY 4.0. | |
Wireless Network Security Market Analysis by Mordor Intelligence
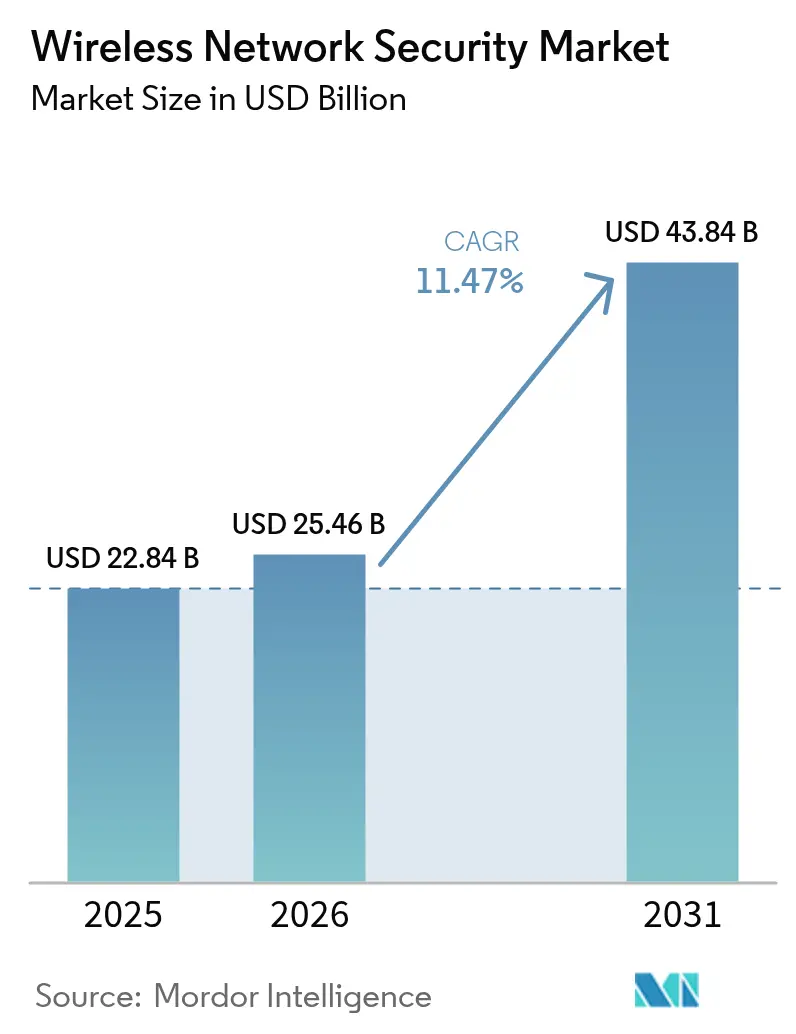
The Wireless Network Security Market size was valued at USD 22.84 billion in 2025 and estimated to grow from USD 25.46 billion in 2026 to reach USD 43.84 billion by 2031, at a CAGR of 11.47% during the forecast period (2026-2031).
Robust demand stems from rapid Wi-Fi 6E and Wi-Fi 7 adoption, cloud-first strategies and private-5G rollouts that collectively enlarge the attack surface and necessitate next-generation zero-trust protection. Enterprises are replacing perimeter-centric defenses with integrated security stacks that blend seamlessly with Secure Access Service Edge frameworks, while multifactor authentication mandates in the United States accelerate uptake of unified wireless safeguards. Hardware refresh cycles are underway because legacy deep-packet inspection engines cannot sustain multi-gigabit throughput without latency penalties, compelling vendors to redesign silicon specifically for 6 GHz operations. North America leads on the back of the USD 3 billion Rip-and-Replace program, whereas Asia-Pacific registers the fastest expansion as mobile-first economies pour capital into 5G-driven digitalization. Intensifying competitive dynamics push suppliers toward AI-enabled anomaly detection, quantum-resistant encryption and cloud-native delivery models to preserve margin and relevance.
Key Report Takeaways
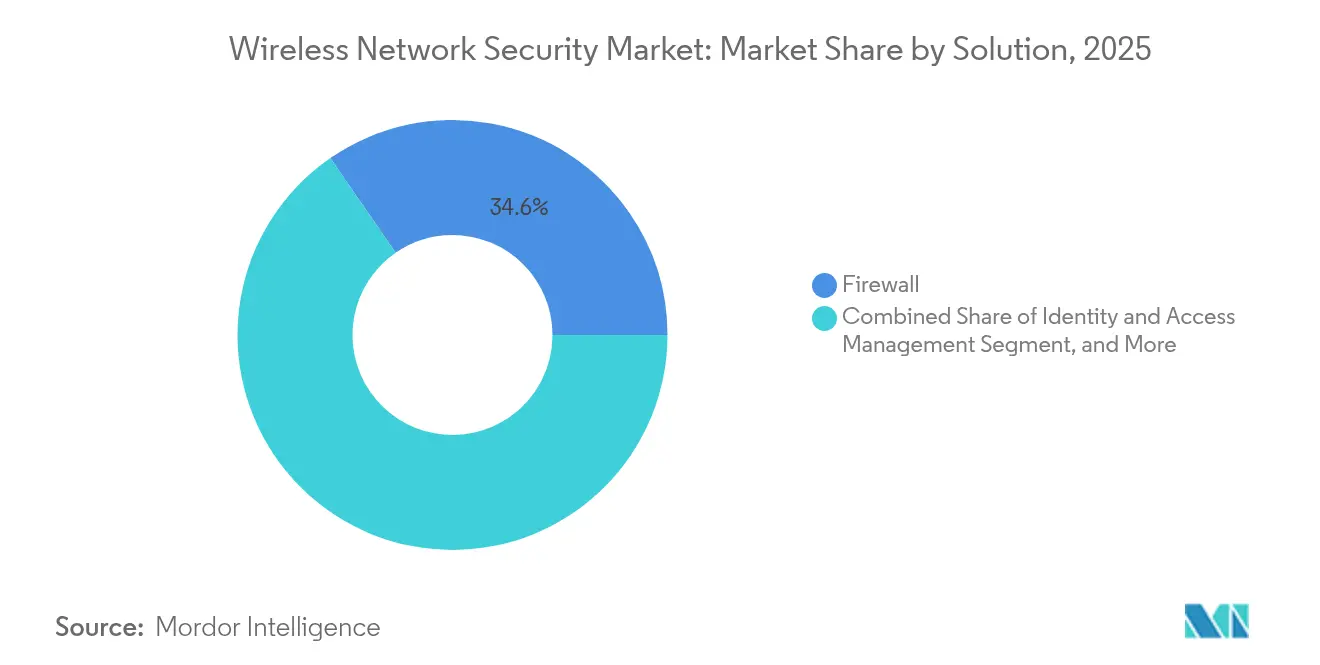
- By solution: Traditional firewalls retained 34.62% of the wireless network security market share in 2025, while Secure Access Service Edge (SASE) platforms are forecast to post a 15.93% CAGR through 2031.
- By deployment model: On-premises architectures accounted for 57.12% of the wireless network security market size in 2025, yet cloud-based deployments are set to expand at 15.55% CAGR to 2031.
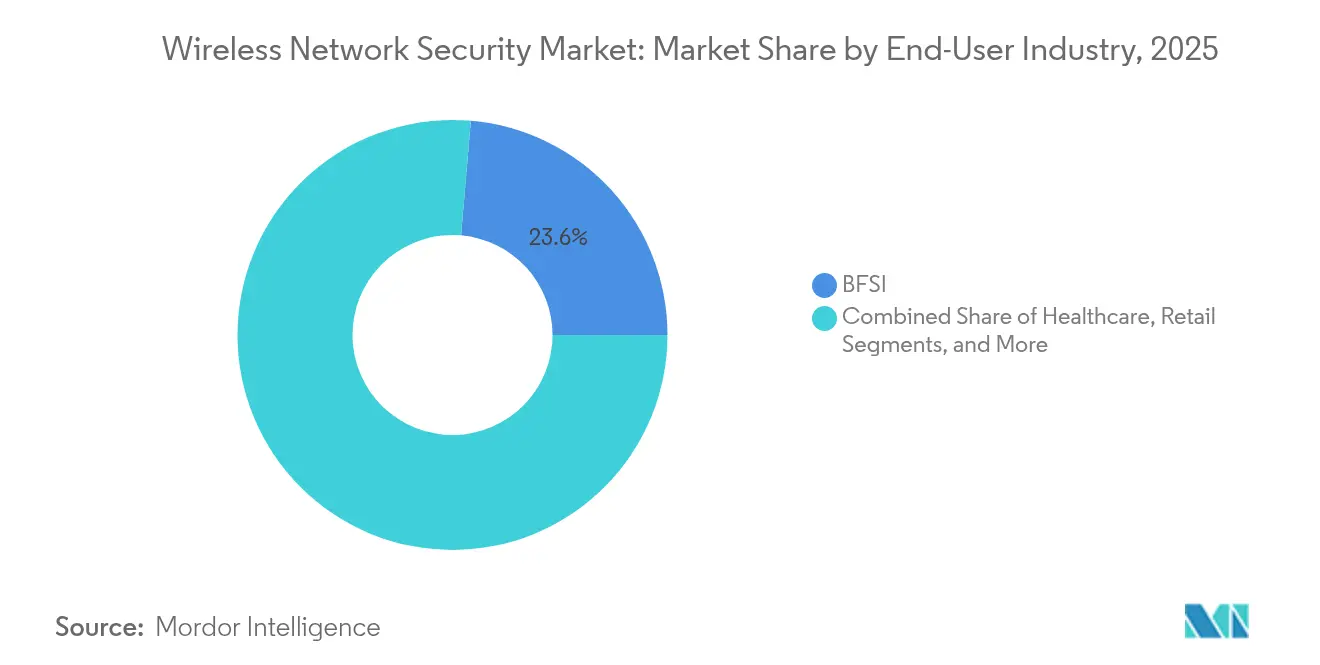
- By end-user industry: Banking, Financial Services and Insurance held 23.64% revenue share of the wireless network security market in 2025; Small & Medium Enterprises are projected to grow at 14.62% CAGR during 2026-2031.
- By organization size: Large enterprises commanded 61.25% of the wireless network security market share in 2025, with SMEs providing the fastest incremental demand.
- By geography: North America led with a 37.54% revenue contribution in 2025, whereas Asia-Pacific is poised for a 15.18% CAGR to 2031.
- Company concentration: Cisco, Fortinet and Palo Alto Networks together exceeded 40% of global revenue in 2024, underscoring moderate consolidation within the wireless network security market.
Note: Market size and forecast figures in this report are generated using Mordor Intelligence’s proprietary estimation framework, updated with the latest available data and insights as of 2026.
Global Wireless Network Security Market Trends and Insights
Drivers Impact Analysis*
| Driver | ( ~ )% Impact on CAGR Forecast | Geographic Relevance | Impact Timeline |
|---|---|---|---|
| Exponential growth of wireless traffic post-Wi-Fi 6E/7 | +2.1% | Global; strongest in North America and Europe | Medium term (2-4 years) |
| Cloud migration and mobile-first architectures | +1.8% | Global; weighted to developed markets | Short term (≤ 2 years) |
| IoT/IIoT proliferation requiring micro-segmentation | +2.3% | Asia-Pacific core, spill-over to North America and Europe | Long term (≥ 4 years) |
| Private-5G and Wi-Fi 7 driving zero-trust investments | +1.9% | North America and Europe, expanding to Asia-Pacific | Medium term (2-4 years) |
| SASE and edge compute fostering integrated WLAN security | +1.7% | Global enterprise markets | Short term (≤ 2 years) |
| AI-driven autonomous penetration testing | +1.4% | North America and Europe technology leaders | Long term (≥ 4 years) |
| Source: Mordor Intelligence | |||
Exponential Growth of Wireless Traffic Post-Wi-Fi 6E/7
Mandatory WPA3 encryption, 320 MHz channels and multi-link operation in Wi-Fi 7 lift aggregate throughput beyond 30 Gbps, overwhelming legacy inspection appliances and prompting enterprises to refresh security hardware capable of real-time analytics at 6 GHz. Field trials confirmed sustained 1 Gbps at 40 feet—double Wi-Fi 6E—forcing vendors to embed high-speed TLS off-load and hardware-accelerated pattern matching. Automated Frequency Coordination adds policy complexity because threat controls must remain consistent across 2.4, 5 and 6 GHz bands. Organizations therefore allocate capital toward scalable, cloud-managed firewalls that off-load compute-intensive tasks while preserving user experience. Staff retraining becomes essential as engineers adapt to deterministic scheduling, multi-link stack configuration and more granular quality-of-service enforcement.
Cloud Migration & Mobile-First Enterprise Architectures
Collapsing perimeters oblige enterprises to embed stateful inspection and encryption directly inside access points, exemplified by HPE’s CX 10040 switch that furnishes inline firewalling without external appliances. Edge-based security reduces backhaul costs and latency, aligning with employee demand for location-agnostic access. The fusion of SD-WAN and WLAN security fuels managed-service growth because policy orchestration across hybrid clouds challenges internal teams. However, change-control overhead rises as administrators synchronize rulesets spanning on-premises radios, public IaaS and edge compute nodes, elevating the need for AI-driven configuration validation.
Proliferation of IoT/IIoT Devices Requiring Micro-Segmentation
Manufacturing, healthcare and logistics add thousands of sensors that each constitute potential breach points. Intel quantified USD 35 million in five-year net present value from a private-5G deployment that safely connected hitherto isolated machinery. Yet 89% of healthcare operators still run vulnerable devices, exposing patient data unless communications are isolated through micro-segmentation. SIM-based authentication combined with dynamic policy enforcement, as delivered by Celona’s Aerloc, helps enterprises apply zero-trust controls without impeding operational continuity. Scale forces security teams to automate anomaly detection because manual log review is infeasible once device counts stretch into tens of thousands.
Private-5G & Wi-Fi 7 Rollouts Accelerating Zero-Trust Wireless Spend
Dedicated spectrum and network slicing justify premium security budgets for industrial automation, defense and campus deployments. The U.S. Department of Defense mandates Open-RAN compliance alongside multi-vendor security support in its private-5G blueprint, attracting suppliers that can certify against stringent chain-of-custody rules. Siemens forecasts a pivot from pilots to full production in 2025, signalling a step-up in infrastructure orders that bundle integrated wireless security. As organizations blend private-5G backbones with Wi-Fi 7 overlays, unified policy planes rooted in zero-trust design become non-negotiable.
Restraints Impact Analysis*
| Restraint | ( ~ )% Impact on CAGR Forecast | Geographic Relevance | Impact Timeline |
|---|---|---|---|
| High implementation and integration costs | -1.6% | Global; particularly burdens SMEs | Short term (≤ 2 years) |
| Cyber-skills shortage | -1.2% | Global; acute in developed economies | Medium term (2-4 years) |
| Privacy-law limits on deep-packet inspection | -0.9% | Europe and North America, spreading globally | Long term (≥ 4 years) |
| Energy footprint of always-on appliances | -0.7% | Global ESG-focused organizations | Medium term (2-4 years) |
| Source: Mordor Intelligence | |||
High Implementation & Integration Costs
Large-scale wireless security undertakings can exceed USD 10 million upfront because enterprises must align access-point firmware, NAC servers and SIEM analytics while maintaining compliance. High-end appliances such as Advantech’s FWA-6183 wield 192 cores, underscoring the premium hardware required for multi-gigabit inspection. Total ownership balloons once professional services, annual maintenance and workforce upskilling are added, prompting SMEs to prefer subscription-based managed offerings.
Cyber-Skills Shortage
Demand for engineers proficient in both RF networking and security outstrips supply. The National Science Foundation has committed USD 15 million to nurture a new cohort of wireless security specialists, yet the talent gap will persist into the medium term. Salary inflation and extended hiring cycles delay projects, giving rise to managed-service providers that aggregate scarce expertise. Vendors bolster adoption by embedding policy automation and guided workflows, but enterprises still require baseline knowledge to interpret alerts and enforce governance.
*Our forecasts treat driver/restraint impacts as directional, not additive. The impact forecasts reflect baseline growth, mix effects, and variable interactions.
Segment Analysis
By Solution: SASE Platforms Drive Integration
Firewall products captured 34.62% of the wireless network security market share in 2025, reaffirming their role as foundational controls. However, SASE offerings are slated to expand at a 15.93% CAGR, reshaping the wireless network security market as organizations pivot toward single-pass architectures that consolidate gateway, CASB and ZTNA features. Fortinet’s FortiGate 700G underscores the shift with 7-fold throughput gains and post-quantum readiness. Unified Threat Management is slipping because monolithic designs lack the elasticity of cloud-native stacks. Encryption suites remain relevant due to regulatory mandates, whereas identity-driven segmentation gains traction under zero-trust programs. As SASE adoption accelerates, suppliers differentiate on AI-powered correlation engines and end-to-end policy visualizations that cut dwell time.
The wireless network security market size for SASE platforms is forecast to climb steeply as enterprises replace aging VPN concentrators with cloud-delivered edge nodes. By 2030, SASE is positioned to rival firewalls in absolute revenue, buoyed by service-provider variants such as Palo Alto Networks’ Prisma SASE 5G that inject SIM-based identity into policy trees. Meanwhile, quantum-resistant encryption and blockchain-authenticated onboarding sit in the “Other Solutions” bucket, offering early-stage revenue streams that may mature late in the forecast horizon.


By Deployment: Cloud Acceleration Reshapes Architecture
On-premises implementations represented 57.12% of the wireless network security market size in 2025 because financial-services and public-sector operators favour direct control over sensitive data. Yet cloud variants are pacing at a 15.55% CAGR after public agencies such as the U.S. FCC promoted SaaS security in a USD 200 million pilot program. Elastic capacity, automatic signature updates and consumption-based pricing resonate strongly with IT managers seeking lower capex.
Hybrid deployment models crystallize as the dominant design for complex enterprises: core data centers keep high-assurance inspection local, while branch sites and mobile workforces traverse cloud gateways for scale. Supply-chain risks push certain workloads back on-premises, but overall growth trajectory favours cloud as inspection moves closer to content sources. Routed telemetry from cloud consoles fuels vendor-wide machine-learning models, lifting detection fidelity compared with siloed appliance data.
By End-User Industry: BFSI Leadership Amid SME Acceleration
BFSI institutions held 23.64% revenue share in 2025, reflecting tight compliance frameworks such as PCI DSS and the elevated cost of breaches. Stringent audit cycles keep spending resilient even during economic slowdowns, sustaining premium margins for high-assurance vendors. Healthcare saw surging demand after 541 breaches in 2023 exposed more than 100 million patient records, incentivizing protection for Internet-of-Medical-Things endpoints censys.com. Retail and manufacturing invest selectively to balance uptime with risk.
Small & Medium Enterprises log the fastest trajectory at 14.62% CAGR. Cloud-hosted consoles and managed-service bundles allow SMEs to procure enterprise-grade defenses without staffing a security operations center. Policymakers reinforce the trend; OECD guidance presses small firms to improve cyber hygiene, spurring adoption grants and tax incentives.
By Organization Size: Enterprise Scale Versus SME Agility
Enterprises employing more than 1,000 staff controlled 61.25% of 2025 spending as they operate sprawling WLAN estates that demand centralized orchestration, custom rule sets and 24 × 7 monitoring. Budgets allocate for AI-driven threat hunting and future-proof encryption. Conversely, SMEs drive volume growth: the wireless network security industry now delivers subscription bundles that combine SD-WAN, firewall and endpoint controls within a single license, trimming procurement complexity. Frameworks such as the Magna Scientia compliance model help owners pass vendor audits without deep technical staffing.
Geography Analysis
North America maintained a 37.54% slice of global revenue in 2025, catalysed by Executive Order 14028 mandating multifactor authentication and zero-trust implementation across federal systems. The wireless network security market size in the region will keep expanding as the USD 3 billion Rip-and-Replace program removes vulnerable hardware nation-wide. Canada and Mexico piggyback on U.S. standards, standardizing procurement around FIPS-validated cryptography and NIST post-quantum algorithms.
Asia-Pacific is projected to clock a 15.18% CAGR, the highest globally, on the back of swelling mobile-subscriber counts and large-scale private-5G manufacturing corridors. China, Japan and India allocate fiscal incentives for secure campus networks, while South Korea showcases nationwide Wi-Fi 7 rollouts supporting smart-city analytics. Regional governments codify cyber norms tailored to local data-sovereignty rules, driving demand for multi-jurisdictional compliance modules.
Europe shows steady momentum anchored by GDPR enforcement and the NIS2 directive that broadens mandatory breach-reporting. Vendors package policy templates specific to sectoral rules like EU DORA for financial institutions. Meanwhile, Middle East & Africa and South America remain emerging yet promising pockets as telcos modernize with open-RAN and governments channel stimulus into critical infrastructure defense.

Competitive Landscape
The wireless network security market exhibits moderate consolidation. Cisco, Fortinet and Palo Alto Networks combined captured over 40% of 2024 revenue, benefitting from end-to-end portfolios that wrap WLAN controllers, AI-powered analytics and managed-threat services. Cisco’s acquisitions of SnapAttack and Robust Intelligence illustrate the race to embed machine-learning engines that cut time-to-detect for polymorphic exploits. Fortinet’s sustainability report highlights power-efficient ASICs that deliver 5× performance per watt, resonating with ESG-conscious buyers.
Strategic deals continue: NETGEAR bought Exium’s mobile-security platform to extend coverage from residential Wi-Fi to enterprise 5G; HPE pursues Juniper to merge AI-driven routing with Aruba WLAN assets, though regulatory hurdles remain. Niche disruptors focus on quantum-safe key exchange and blockchain-anchored device onboarding, selling modules into incumbent ecosystems rather than displacing full stacks.
Price competition stays muted at the high end because differentiated AI analytics and compliance certifications support premium pricing. Nonetheless, entry-tier segments see downward pressure as white-box hardware plus open-source firmware gains traction among value-focused SMEs. Vendors defend share through bundled support, threat-intelligence feeds and lifecycle-management guarantees.
Wireless Network Security Industry Leaders
Cisco Systems, Inc.
Fortinet, Inc.
Palo Alto Networks, Inc.
HPE (Aruba Networks)
Juniper Networks, Inc.
- *Disclaimer: Major Players sorted in no particular order

Recent Industry Developments
- June 2025: HPE CEO Antonio Neri voiced confidence in prevailing over a DOJ lawsuit opposing the USD 14 billion Juniper Networks takeover, claiming the union will enhance wireless-security competition.
- May 2025: Cisco debuted C9350/C9610 smart switches and Wireless 9179F Wi-Fi 7 access points featuring quantum-resistant security, expanding the cloud-managed Catalyst line.
- May 2025: HPE Aruba Networking introduced the CX 10040 distributed services switch with embedded firewalling plus new Wi-Fi 7 access points, unifying edge connectivity and security.
- May 2025: Fortinet launched FortiGate 700G hybrid mesh firewalls delivering AI-powered defense and post-quantum cryptography support.


Research Methodology Framework and Report Scope
Market Definitions and Key Coverage
Our study defines the wireless network security market as all software, hardware, and cloud-delivered controls that authenticate users, encrypt traffic, and detect or block intrusions across Wi-Fi, Bluetooth, and emerging private-5G and Wi-Fi 7 networks. According to Mordor Intelligence, the focus is strictly on commercially sold security solutions and related managed platforms that safeguard enterprise and public-facing wireless local area networks.
Scope Exclusion: cellular core-network firewalls and standalone endpoint antivirus tools are outside this definition.
Segmentation Overview
- By Solution
- Firewall
- Encryption
- Identity and Access Management
- Unified Threat Management
- Intrusion Prevention / Detection System
- Secure Access Service Edge (SASE)
- Other Solutions
- By Deployment
- On-premise
- Cloud
- By End-user Industry
- BFSI
- Healthcare
- Retail
- Manufacturing
- IT and Telecom
- Government
- Aerospace and Defense
- Other End-user Industries
- By Organization Size
- Large Enterprises
- Small and Medium-sized Enterprises (SMEs)
- By Geography
- North America
- United States
- Canada
- Mexico
- Europe
- United Kingdom
- Germany
- France
- Italy
- Rest of Europe
- Asia-Pacific
- China
- Japan
- India
- South Korea
- Rest of Asia-Pacific
- Middle East
- Israel
- Saudi Arabia
- United Arab Emirates
- Turkey
- Rest of Middle East
- Africa
- South Africa
- Egypt
- Rest of Africa
- South America
- Brazil
- Argentina
- Rest of South America
- North America
- Key Performance Indicators
- Total Addressable Market (TAM)
- Average Deal Size per Secure AP
- Mean Time to Detect (MTTD)
- Mean Time to Respond (MTTR)
- % Zero-Trust WLAN Deployments
- Device Density per Secure AP
Detailed Research Methodology and Data Validation
Primary Research
Mordor analysts interviewed enterprise CISOs, WLAN integrators, channel distributors, and regional telecom regulators across North America, Europe, and Asia-Pacific. Dialogues verified license pricing tiers, zero-trust adoption timelines, and the real pace of Wi-Fi 6E refreshes, letting us refine assumptions that secondary data could not fully capture.
Desk Research
We began with open datasets and standards documents such as IEEE 802.11 specifications, Wi-Fi Alliance certification statistics, ENISA and CISA threat-landscape bulletins, and ITU ICT penetration tables. Public company filings, FCC equipment authorizations, and Eurostat digital-economy indices helped outline installed WLAN bases and spending patterns. Proprietary look-ups in Dow Jones Factiva and D&B Hoovers supplied revenue splits and historical acquisitions that shaped vendor shares. This mix of public and paid sources gave us the starting benchmarks; many other references were also reviewed for context and clarification.
A second desk pass mapped regional shipment flows with customs data, cross-checked against Wi-Fi access-point unit exports available through Volza, and then linked those flows to average selling prices quoted in investor presentations. That linkage created the first provisional size estimate before interviews began.
Market-Sizing & Forecasting
A top-down build started with installed business Wi-Fi nodes by country, which are then multiplied by penetration-rate assumptions for security subscriptions. Supplier roll-ups of sampled ASP x volume, plus channel margin checks, served as bottom-up validation. Key variables include Wi-Fi 6E/7 access-point shipments, number of public hotspots, average firewall ASP, private-5G corridor count, and zero-trust policy adoption indices; shifts in these inputs explain over 85% of revenue variance in a multivariate-regression forecast. Gap areas in granular unit counts are bridged by regional growth proxies from telecom capex surveys.
Data Validation & Update Cycle
Outputs pass anomaly checks against external cyber incident losses and vendor invoice trends, followed by senior-analyst peer review. Our models refresh every twelve months, with interim updates triggered by material events such as new WPA standards or major breach disclosures, ensuring clients receive the latest view at delivery.
Why Mordor's Wireless Network Security Baseline Earns Client Trust
Published figures often diverge because firms choose different base years, bundle services unevenly, or refresh less frequently. By reconciling device shipments with security attach rates and validating price curves directly with buyers, Mordor delivers a traceable midpoint that decision-makers can rely on.
Key gap drivers include broader inclusion of managed SOC services by some publishers, older 2023 baselines that miss Wi-Fi 6E momentum, currency conversions that freeze rates at prior-year averages, and unvetted ASP escalation paths.
Benchmark comparison
| Market Size | Anonymized source | Primary gap driver |
|---|---|---|
| USD 22.84 B (2025) | Mordor Intelligence | - |
| USD 29.60 B (2024) | Global Consultancy A | Bundles managed services and cellular core security |
| USD 26.23 B (2023) | Industry Journal B | Older base year, no hotspot growth adjustment |
| USD 29.60 B (2024) | Regional Consultancy C | Applies uniform ASP uplift, ignores volume discounts |
Taken together, the comparison shows that while others often report bigger totals, they do so by widening scope or freezing key variables. Mordor's disciplined selection of security-only scope, live price checks, and annual refresh cadence yields a balanced, transparent baseline that clients can reproduce with clear steps and publicly traceable inputs.


Key Questions Answered in the Report
What is driving the current growth of the wireless network security market?
Adoption of Wi-Fi 6E/7, private-5G deployments and cloud-first networking is enlarging the attack surface, prompting organizations to adopt zero-trust wireless defenses that fuel an 11.47% CAGR through 2031.
Which region leads spending on wireless network security solutions?
North America held 37.54% of global revenue in 2025 thanks to aggressive government programs like the USD 3 billion Rip-and-Replace initiative and federal zero-trust mandates.
How fast is the Asia-Pacific market expanding?
The region is forecast to post a 15.18% CAGR between 2026 and 2031 as mobile-first economies finance private-5G corridors and smart-city networks.
Why are SASE platforms gaining momentum over traditional firewalls?
Enterprises want integrated, cloud-delivered security that unifies gateway, CASB and ZTNA functions; SASE solutions therefore exhibit a 15.93% CAGR, outpacing standalone appliances.
What challenges hinder wider adoption among SMEs?
High upfront costs and a shortage of skilled personnel remain primary barriers; managed-service bundles and subscription pricing are helping SMEs overcome these hurdles at a 14.62% CAGR.
Page last updated on:


