
Neural Network Software Market Size and Share
Market Overview
| Study Period | 2020 - 2031 |
|---|---|
| Market Size (2026) | USD 45.63 Billion |
| Market Size (2031) | USD 177.55 Billion |
| Growth Rate (2026 - 2031) | 31.25 % |
| Fastest Growing Market | Asia Pacific |
| Largest Market | North America |
| Market Concentration | Medium |
Major Players *Disclaimer: Major Players sorted in no particular order Image © Mordor Intelligence. Reuse requires attribution under CC BY 4.0. | |
Neural Network Software Market Analysis by Mordor Intelligence
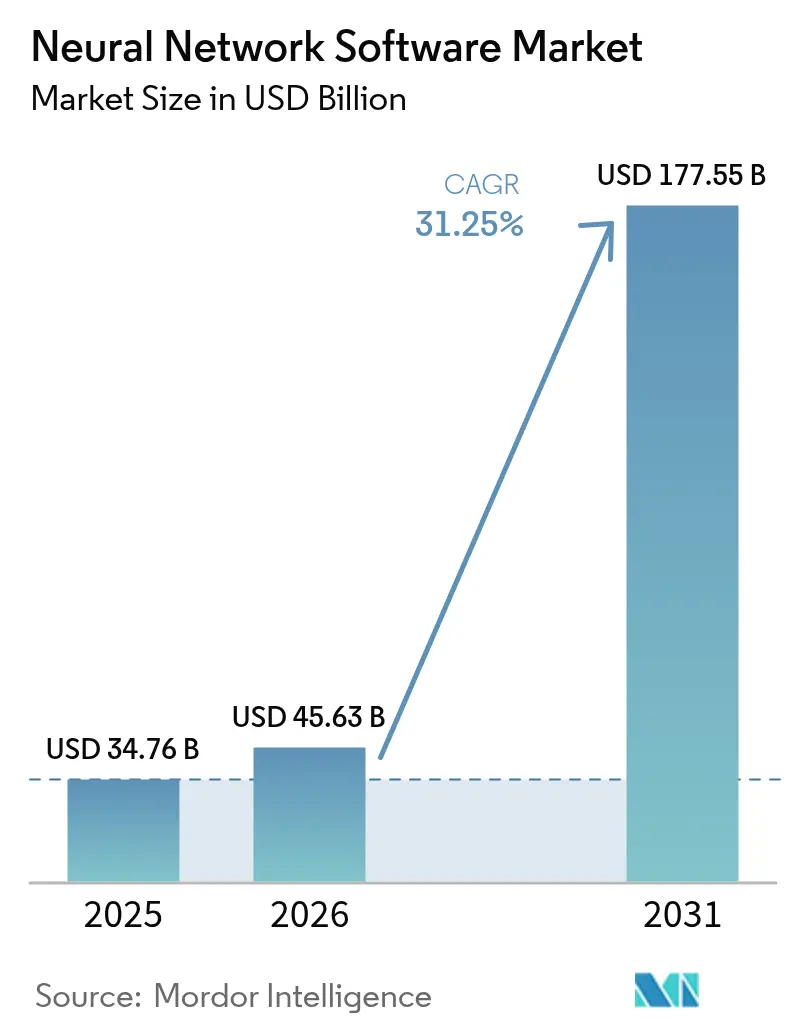
Neural Network Software market size in 2026 is estimated at USD 45.63 billion, growing from 2025 value of USD 34.76 billion with 2031 projections showing USD 177.55 billion, growing at 31.25% CAGR over 2026-2031. Expansion is accelerating as enterprises move from proofs of concept to full-scale rollouts, supported by sovereign-AI programs, foundation-model ecosystems, and cloud platforms that lower adoption barriers. OpenAI’s revenue jump from USD 5.5 billion in December 2024 to USD 10 billion in June 2025, illustrating rising commercial demand for large-scale neural network deployments. Asia-Pacific is the fastest-growing geography because China, Japan, India, and South Korea are localizing large language models and building national AI clouds. Component trends show software tools retaining the majority share, yet services are expanding faster as enterprises seek integration and optimization expertise. Competition continues to intensify, with cloud hyperscalers, enterprise software vendors, and specialist AI firms racing to differentiate on model efficiency, governance, and vertical solutions.
Key Report Takeaways
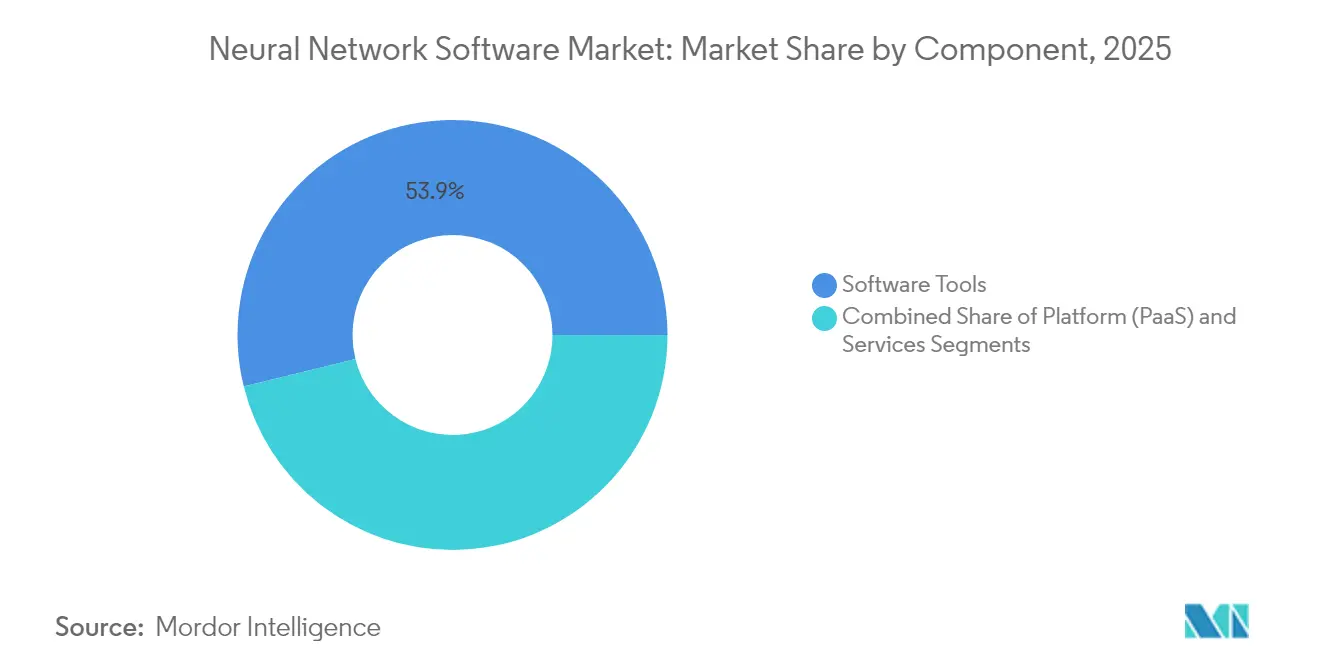
- By component, software tools held 53.85% of 2025 revenue, while services are projected to expand at a 34.15% CAGR through 2031.
- By deployment mode, cloud solutions commanded 60.65% of the neural network software market share in 2025, whereas hybrid architectures are forecast to grow at a 33.6% CAGR to 2031.
- By type, data mining and archiving led with 38.15% revenue share in 2025; optimization software is expected to advance at a 33.1% CAGR through 2031.
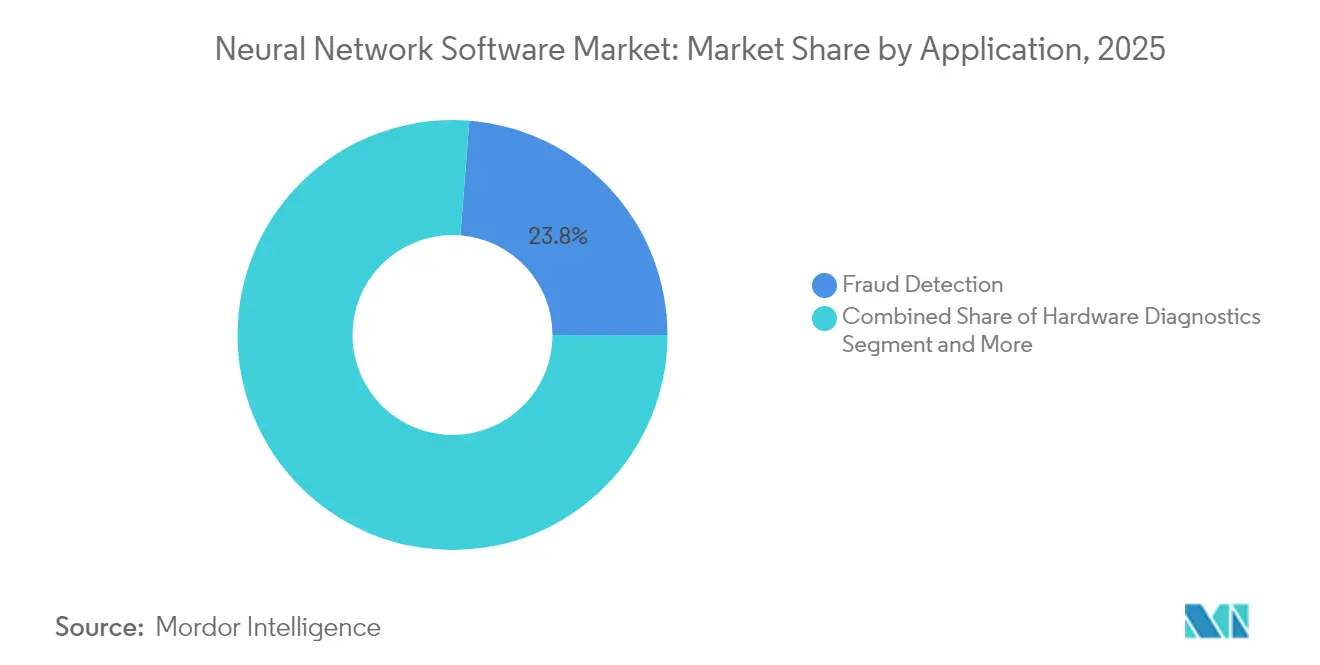
- By application, fraud detection accounted for 23.75% of 2025 revenue; predictive maintenance is projected to record a 34.4% CAGR through 2031.
- By end-user vertical, BFSI represented 23.05% share of the neural network software market size in 2025, while manufacturing is anticipated to expand at a 33.4% CAGR through 2031.
- By geography, North America captured 37.65% revenue in 2025; Asia-Pacific is forecast to post the fastest 34.6% CAGR through 2031.
Note: Market size and forecast figures in this report are generated using Mordor Intelligence’s proprietary estimation framework, updated with the latest available data and insights as of 2026.
Global Neural Network Software Market Trends and Insights
Drivers Impact Analysis*
| Driver | (~) % Impact on CAGR Forecast | Geographic Relevance | Impact Timeline |
|---|---|---|---|
| Cloud-based AI platforms democratize neural networks | +8.2% | Global, stronger adoption in North America and Europe | Medium term (2-4 years) |
| Rising enterprise demand for predictive analytics | +7.5% | Global, led by manufacturing hubs in APAC and North America | Short term (≤2 years) |
| Growing availability of big data and GPUs | +6.8% | North America and APAC core, tempered by supply constraints | Medium term (2-4 years) |
| Foundation models create new toolchain demand | +5.9% | Global, concentrated in technology-forward regions | Long term (≥4 years) |
| Open-source model marketplaces accelerate adoption | +4.1% | Global, particularly strong in developer communities | Short term (≤2 years) |
| Sovereign-AI initiatives need local neural-network stacks | +3.7% | Europe, APAC, and select emerging markets | Long term (≥4 years) |
| Source: Mordor Intelligence | |||
Cloud-based AI Platforms Democratize Access
Enterprise generative-AI spending is rising 30% in 2025 as mid-market firms adopt managed platforms that remove capital barriers. Red Hat’s purchase of Neural Magic adds optimized inference libraries to its hybrid cloud suite, enabling efficient deployments within private clusters. [1]Red Hat, “Red Hat Announces Definitive Agreement to Acquire Neural Magic,” redhat.com Rackspace’s AI Anywhere service packages pre-built models with predictable subscription pricing, making complex neural network architectures attainable for firms lacking in-house expertise. [2]Rackspace Technology, “Enhance AI Performance in Private Cloud With Rackspace AI,” rackspace.com Google’s Gemini family extends democratization by embedding text-to-image and video generation APIs inside standard cloud consoles, letting developers test multimodal inference without bespoke infrastructure. These platform moves reduce time-to-value and expand the neural network software market across new corporate adopters.
Rising Enterprise Demand for Predictive Analytics
Manufacturers are shifting from reactive to proactive maintenance as neural networks reach 94% accuracy in fault prediction. BMW’s Regensburg plant prevents over 500 minutes of annual assembly disruption by analyzing existing component data, confirming strong ROI in industrial contexts. [4]BMW Group, “Smart Maintenance Using Artificial Intelligence,” press.bmwgroup.com General Motors cut unexpected downtime by 15% and saved USD 20 million yearly after linking IoT sensors with AI-driven scheduling engines. Financial institutions see parallel benefits, with hybrid deep-learning models catching 98.7% of fraudulent payments. Such clear economic gains accelerate software procurement cycles and raise expectations for rapid deployment support from vendors.
Growing Availability of Big Data and GPUs
Global AI compute capacity is projected to grow tenfold by 2027, aided by chip-node advances and advanced packaging, yet supply remains tight because NVIDIA controls 88% of discrete GPU volume and depends on limited CoWoS lines. Scarcity creates a two-tier hardware market where resource-rich firms pursue frontier models while others rely on smaller architectures. Intel’s Arc GPUs, paired with PyTorch, lower entry costs, broaden hardware choice. The net result is continued capacity expansion, but also heightened interest in efficient model compression that keeps performance high on limited resources, sustaining neural network software market momentum.
Foundation Models Create New Toolchain Demand
Databricks’ DBRX shows how open foundation models let enterprises fine-tune on proprietary data while retaining ownership, cutting vendor lock-in expenses. TorchTitan achieves 65% faster training across 128 GPUs, highlighting the need for distributed training orchestration. Governance layers mature in parallel; IBM watsonx.governance automates EU AI Act compliance checkpoints, ensuring models meet transparency mandates. [3]IBM Staff, “IBM watsonx.governance,” IBM, ibm.com These specialized toolchains create new revenue pools across MLOps, observability, and policy engines, broadening the neural network software market footprint.
Restraints Impact Analysis*
| Restraint | (~) % Impact on CAGR Forecast | Geographic Relevance | Impact Timeline |
|---|---|---|---|
| Shortage of deep-learning MLOps talent | -4.8% | Global, most acute in Europe and North America | Medium term (2-4 years) |
| Data-privacy and governance burdens | -3.2% | Europe (GDPR) with expanding global influence | Long term (≥4 years) |
| GPU supply-chain volatility inflates costs | -2.9% | Global, concentrated impact on compute-intensive applications | Short term (≤2 years) |
| Energy and ESG scrutiny of training workloads | -1.7% | Developed markets enforcing sustainability mandates | Long term (≥4 years) |
| Source: Mordor Intelligence | |||
Shortage of Deep-Learning MLOps Talent
Only 28% of AI adopters employ dedicated MLOps engineers, and 75% of European employers struggled to fill AI roles in 2024, spotlighting a persistent skills gap. Tech giants now deliver certification curricula to accelerate reskilling, yet curricula cannot match rapid framework changes. Without sufficient practitioners to operationalize models, deployment timelines lengthen and service revenues climb, capping short-term neural network software market gains even as demand grows.
Data-Privacy and Governance Burdens
The EU AI Act introduces mandatory risk assessments and disclosure, increasing compliance overhead. Financial institutions in Asia avoid AI for AML tasks because legacy systems cannot satisfy data lineage tests. GDPR further compels privacy-preserving inference, prompting investment in model monitoring and synthetic-data techniques. Smaller firms face higher proportional costs, discouraging early adoption despite strong interest, and thereby tempering neural network software market expansion.
*Our forecasts treat driver/restraint impacts as directional, not additive. The impact forecasts reflect baseline growth, mix effects, and variable interactions.
Segment Analysis
By Component: Software Stability and Services Upswing
Software frameworks, libraries, and AutoML suites delivered 53.85% of 2025 revenue, underscoring their role as the structural backbone of the neural network software market. Core development kits such as TensorFlow, PyTorch, and JAX remain essential, yet buyers increasingly demand turnkey modules that shorten experimentation cycles. Services, including professional consulting and managed operations, are rising at 34.15% CAGR as firms outsource integration, tuning, and lifecycle management.
Managed services captured incremental gains equal to 34.2% of the neural network software market size in 2025 as cloud providers embedded AI specialists within subscription packages to accelerate time-to-production. Professional service teams respond to sector-specific needs—e.g., healthcare imaging compliance—further boosting service share. Over the forecast window, vendor differentiation will hinge on domain depth and outcome-based pricing rather than licensing alone.



By Deployment Mode: Hybrid Flexibility Underpins Sovereign AI
Public cloud retained 60.65% of the neural network software market share in 2025 because hyperscalers offer elastic compute for training and inference. Enterprises leverage GPU clusters on demand, avoiding up-front capital outlays. Yet sovereignty, latency, and regulatory requirements are shifting growth toward hybrid deployments, forecast at 33.6% CAGR to 2031.
Hybrid architectures let data reside on-premise or in private clouds while model training happens in scalable public environments. Financial services and healthcare operators adopt this topology to protect sensitive data while exploiting cloud scale. The growing use of confidential computing and federated learning will amplify hybrid demand, reshaping resource planning for vendors.
By Type: Optimization Engines Gain Momentum
Data mining and archiving applications controlled 38.15% revenue in 2025, reflecting entrenched usage for pattern discovery across large datasets. Visualization and analytical dashboards translate neural network outputs into actionable insights for business users, cementing their place within analytics stacks.
Optimization software is rising fastest at 33.1% CAGR, targeting supply-chain routing, production scheduling, and resource allocation. Early adoption in automotive assembly lines shows predictive algorithms reducing changeover time and scrap rates, driving direct cost savings. As lean manufacturing and ESG targets converge, demand for optimization modules will add fresh layers to the neural network software market.
By Application: Predictive Maintenance Takes Flight
Fraud detection dominated with a 23.75% share in 2025, boosted by BFSI's focus on transaction monitoring. Accuracy above 98% is now table stakes, pushing vendors toward explainable-AI add-ons.
Predictive maintenance accounts for just a fraction today, but adds the highest incremental weight to the neural network software market size, growing at 34.4% CAGR. Industrial equipment makers and process manufacturers embed neural networks into edge gateways to anticipate faults days ahead, curbing downtime and inventory costs. Successful pilots across automotive, chemicals, and mining spark enterprise-wide rollouts, ensuring robust future demand.
By End-user Vertical: Manufacturing Rises, BFSI Holds Ground
BFSI kept 23.05% of revenue in 2025 through broad adoption in fraud, credit scoring, and algo-trading. Regulatory reporting obligations keep spending steady.
Manufacturing is projected to post 33.4% CAGR as Industry 4.0 projects converge with IoT sensor rollouts. The segment captured 33.9% of new neural network software market size between 2025 and 2026, driven by condition monitoring suites that deliver measurable yield gains. The transition from proof-of-concept to plant-wide deployment fuels multi-year subscription commitments, consolidating vendor relationships.
Geography Analysis
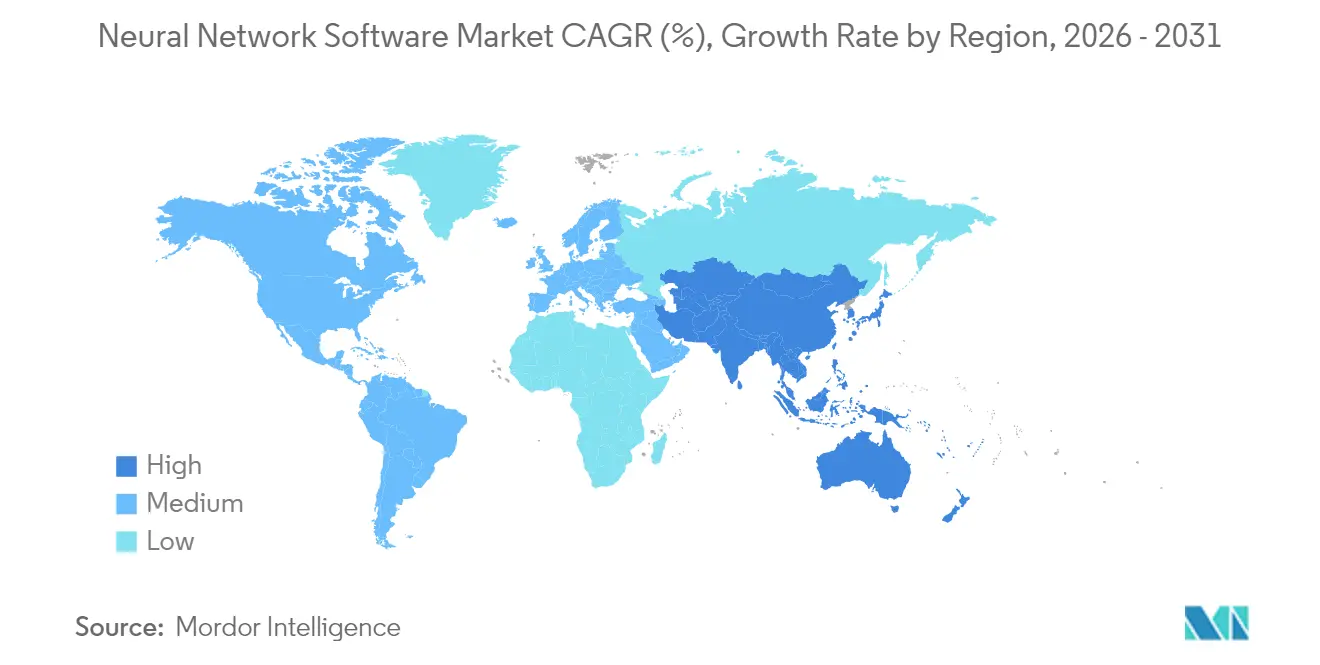
North America held 37.65% revenue in 2025 due to an established venture-capital ecosystem, advanced cloud infrastructure, and dense talent pools. OpenAI doubling annual recurring revenue to USD 10 billion highlights commercial maturity, while hyperscalers continually widen managed-AI portfolios. Canada leverages academic clusters in Montreal and Toronto, yet chip fabrication dependence on Asia limits sovereign compute ambitions. Mexico leverages nearshoring to integrate neural network solutions in logistics and automotive production, strengthening regional supply chains.
Asia-Pacific is forecast to grow at 34.6% CAGR, with the neural network software market size jumping to USD 72.4 billion by 2031 as China, Japan, India, and South Korea implement national AI clouds. China leads 37 of 44 critical R&D disciplines, channelling state financing toward industrial AI upgrades. Japan hosts OpenAI’s first Indo-Pacific office, confirming local demand for enterprise GPT solutions that respect linguistic nuance and data-residency laws. India nurtures start-ups through government sandboxes, while Australia and Singapore invest in safety and governance research, creating diversified regional opportunities.
Europe pursues technological autonomy through sovereign-AI projects. NVIDIA is supplying over 3,000 exaflops of Blackwell clusters to European data-center partners, forming a continental spine for regulated AI workloads. Germany’s industrial AI cloud and France’s telco-led model-hosting hubs add depth. However, talent shortages persist, with 75% of employers unable to staff AI roles, driving wage inflation and cross-border migration. Strict GDPR and forthcoming AI-Act requirements favor vendors offering governance tooling, shaping procurement priorities.

Regulatory Landscape
Regulation is tightening around AI governance, transparency, and safety, pushing neural network software vendors to embed risk management and auditability into their toolchains. In the European Union, the EU AI Act (Regulation (EU) 2024/1689, dated 13 June 2024 and published in July 2024) establishes a risk-based framework and governance bodies including an AI Office within the European Commission, with high-risk system rules transitioning through extended timelines noted up to 2 August 2028. Annex VII requirements referenced for high-risk AI systems include documented risk management, data governance, technical documentation, record-keeping, transparency to deployers, human oversight, and accuracy, robustness, and cybersecurity, which raises the importance of model observability and governance modules within platforms.
In the United States, compliance attention also extends to cross-border distribution and access to advanced AI capabilities due to export controls. The BIS \"Framework for Artificial Intelligence Diffusion\" was published in the Federal Register on January 15, 2025, expanding controls tied to advanced computing and related AI enablement, alongside BIS guidance such as the May 13, 2025 policy statement highlighting export-authorization considerations for advanced computing items used to train AI models for sensitive end uses. Separately, widely adopted frameworks and standards influence procurement and internal controls, including NIST AI RMF 1.0 (January 2023) as a voluntary risk-management framework and ISO/IEC 42001:2023 for establishing an AI management system, both of which are increasingly used to structure governance evidence for enterprise deployments.
Value Chain Analysis
The neural network software value chain spans compute infrastructure (GPUs/accelerators and servers), cloud and orchestration layers, data engineering and labeling, model development and training toolchains (frameworks, libraries, distributed training, and optimization), and finally deployment, monitoring, and application delivery (MLOps, observability, governance, and vertical apps). Cloud hyperscalers, AI platform vendors, and open-source ecosystems act as primary distribution channels through marketplaces and managed services, while system integrators and professional services accelerate production rollouts for regulated or legacy-heavy environments.
Key constraints and bargaining power cluster upstream around accelerator supply and packaging, influencing software choices that improve throughput per scarce GPU. In 2025, advanced packaging (including CoWoS) and high-bandwidth memory (HBM) were cited as major production constraints, and the largest AI chip designers consumed a dominant share of that capacity, which amplifies demand for model compression, efficient inference runtimes, and scheduling software. At the training layer, distributed workloads also face network bandwidth and software overhead bottlenecks, raising the value of communications backends, cluster-aware orchestration, and runtime optimization that reduce synchronization and data-transfer penalties.
Competitive Landscape
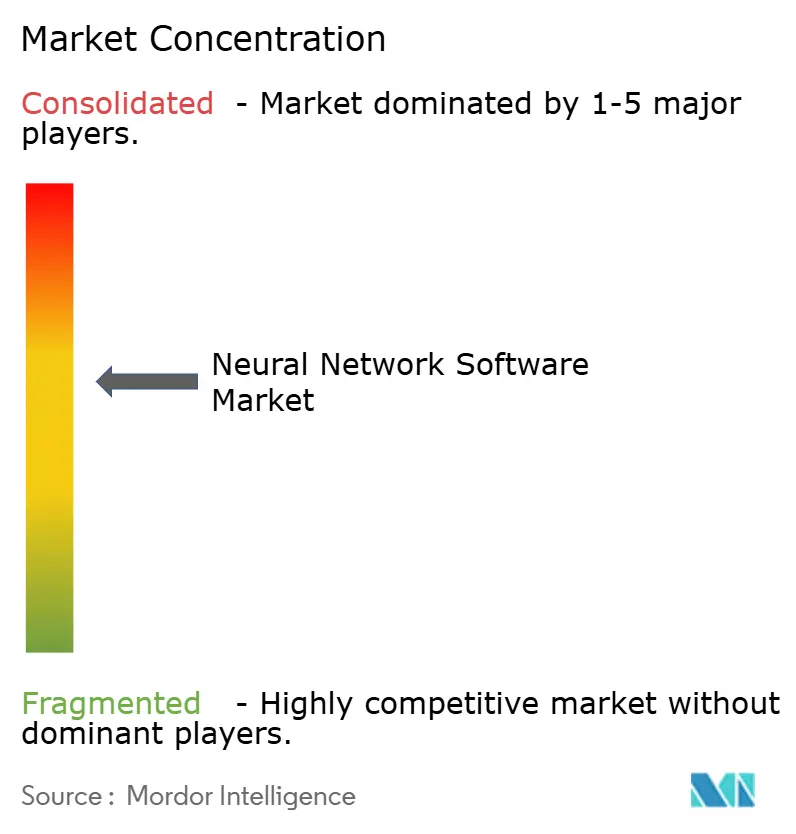
The neural network software market remains moderately fragmented. Cloud hyperscalers leverage integrated stacks, bundling compute, frameworks, and managed services under consumption-based pricing. Enterprise application vendors target sector requirements; for example, SAP embeds neural networks into S/4HANA manufacturing modules. Pure-play AI firms such as DataRobot command premium valuations, reflecting investor appetite for domain-agnostic AutoML and MLOps suites.
Strategic mergers are rising. Red Hat’s acquisition of Neural Magic secures sparse-matrix inference technology that slashes model latency on off-the-shelf CPUs, differentiating hybrid cloud performance. IBM integrates watsonx.governance with mainstay data catalog products, positioning governance as a cross-sell catalyst. Partnerships also matter: NVIDIA aligns with European governments to embed Blackwell systems inside sovereign data centers, while Databricks and Hugging Face co-develop optimized transformer pipelines for regulated industries.
Technology differentiation is shifting from raw benchmark scores to efficiency and governance. DeepSeek’s mixture-of-experts model achieved near-frontier performance with only USD 5.6 million in training expenditure, proving cost-effective innovation possible and intensifying competitive pressure on compute-heavy incumbents. Vendors now emphasize quantization, pruning, and distillation toolkits alongside observability dashboards to ensure responsible AI. Supply-chain constraints around GPUs elevate software that maximizes throughput on scarce hardware, creating a premium on efficiency algorithms.
Neural Network Software Industry Leaders
DataRobot Inc.
H2O.ai Inc.
C3.ai Inc.
Hugging Face Inc.
DeepMind Technologies Ltd.
- *Disclaimer: Major Players sorted in no particular order

Market Opportunities and Future Outlook
Opportunity centers on efficiency software and managed toolchains that translate scarce compute into higher training and inference throughput. Supply constraints around advanced packaging and HBM, alongside the concentration of accelerator access among hyperscalers and a few chip designers, are pushing enterprises to adopt quantization, pruning, distillation, and cluster scheduling features within neural network software stacks, especially for large-scale inference and agentic workloads. Platform releases such as AWS Neuron 2.31.0 (July 2026), which adds capabilities like NKI updates and an operator for automated workload allocation on Amazon EKS, highlight demand for software that improves utilization and operational resilience when deploying models on purpose-built AI instances.
A second whitespace is governed and auditable enterprise deployment for regulated industries and sovereign AI programs, where compliance requirements are increasingly translated into product features. The EU AI Act (Regulation (EU) 2024/1689) and its high-risk system obligations elevate the need for embedded documentation workflows, monitoring, and human-oversight controls, reinforcing the role of governance toolchains such as IBM watsonx.governance already positioned around EU AI Act checkpoints in this market context. In parallel, the foundation-model ecosystem is widening distribution through managed catalogs and marketplaces, as shown by OpenAI models becoming generally available via Amazon Bedrock (July 2026), which increases demand for integration, monitoring, and cost-control layers that standardize procurement-to-production across cloud and hybrid deployments.
Recent Industry Developments
- June 2026: C3 AI announced that Shell expanded its multi-year agreement to scale C3 AI Reliability deployments and add AI agent-based root cause analysis across global asset operations. The move reinforces production-grade neural network software demand in heavy-asset environments where uptime, traceability, and integration with existing operational systems are critical.
- December 2025: The U.S. Department of Health and Human Services selected C3 AI as an enterprise AI platform to build a data foundation spanning the National Institutes of Health and the Centers for Medicare and Medicaid Services. This selection signals continued expansion of enterprise AI platforms into complex public-sector environments that require governance, security, and cross-agency data interoperability.
- November 2024: Red Hat agreed to acquire Neural Magic to enhance generative AI inference across hybrid clouds with optimized inference libraries. The acquisition strengthens hybrid deployment pathways by improving performance on off-the-shelf CPUs, which supports broader enterprise rollouts when GPU access is constrained.


Research Methodology Framework and Report Scope
Market Definition and Coverage
This market covers revenue generated from software used to build, train, deploy, and manage neural network models in real-world workflows, across cloud, on-premise, and hybrid environments. It includes tools, platforms, and related services that directly support neural network development and operations.
Scope exclusions: Hardware accelerators and chips, general-purpose analytics software not designed for neural networks, and unrelated IT services are excluded from this market sizing.
Segmentation Overview
- By Component
- Software Tools
- Frameworks and Libraries
- AutoML Platforms
- Platform (PaaS)
- Services
- Managed Services
- Professional Services
- Software Tools
- By Deployment Mode
- Cloud
- On-premise
- Hybrid
- By Type
- Data Mining and Archiving
- Analytical Software
- Optimization Software
- Visualization Software
- By Application
- Fraud Detection
- Hardware Diagnostics
- Financial Forecasting
- Image Optimization
- Predictive Maintenance
- Natural Language Processing
- Speech Recognition
- Others
- By End-user Vertical
- BFSI
- Healthcare
- Retail and E-Commerce
- Defense and Government
- Media and Entertainment
- Logistics and Transportation
- Energy and Utilities
- Manufacturing
- Other End-user Verticals
- By Geography
- North America
- United States
- Canada
- Mexico
- South America
- Brazil
- Argentina
- Chile
- Rest of South America
- Europe
- Germany
- United Kingdom
- France
- Italy
- Spain
- Russia
- Rest of Europe
- Asia-Pacific
- China
- India
- Japan
- South Korea
- Malaysia
- Singapore
- Australia
- Rest of Asia-Pacific
- Middle East and Africa
- Middle East
- United Arab Emirates
- Saudi Arabia
- Turkey
- Rest of Middle East
- Africa
- South Africa
- Nigeria
- Rest of Africa
- Middle East
- North America
Data Sources, Market Sizing, and Validation
Desk Research
For the starting structure of the model, we relied on public and official sources that help explain adoption, spending capacity, and deployment patterns. Examples include the US Bureau of Economic Analysis for macro indicators, the US Bureau of Labor Statistics for tech labor cost signals, OECD digital economy indicators, World Bank datasets for country-level IT and cloud readiness proxies, and standards and guidance published by NIST around AI risk management.
We also reviewed company filings, earnings decks, product documentation, open technical repositories, and credible press coverage to map common packaging, usage terms, and typical buying motions. Select paid subscriptions that compile company financials and news, plus patent databases, were used to cross-check vendor exposure and product positioning when public disclosures were limited. These desk sources are illustrative only, and many other public references were used during data collection, validation, and clarification.
Primary Interviews and Surveys
Primary interviews and surveys were used to stress-test assumptions that desk sources do not explain well, such as how buyers bundle tools with platforms, how services are priced, and what counts as neural network specific usage versus general AI spending. We spoke with supply-side and demand-side practitioners across Americas, EMEA, and APAC so the model reflects differences in cloud maturity, regulation, and enterprise rollout pace.
Distribution of primary research fieldwork respondents
| Company type | Respondent position | Region |
|---|---|---|
| Top tier: 28% | CXOs: 16% | APAC: 48% |
| Mid tier: 56% | Functional/Unit leaders: 41% | EMEA: 29% |
| Smaller Players: 16% | Managers: 43% | Americas: 23% |
Market-Sizing & Forecasting
Sizing is built using a top-down approach where software demand is reconstructed from enterprise AI spending capacity, the cloud and on-premise deployment mix, and the share attributable to neural network workloads rather than adjacent analytics. That total is then reconciled with selective bottom-up checks, such as rolling up sampled vendor revenues by component and validating implied spend per adopting organization using channel feedback.
Key inputs in the model include cloud adoption rates for AI workloads, enterprise deployment mix (cloud, on-premise, hybrid), the split of spend across software tools, platform, and services, average subscription and support price progression, and the pace of moving from pilots to scaled rollouts in regulated industries. Where smaller vendors have limited disclosures, we bridge gaps using proxy indicators like hiring intensity in ML roles, product usage signals found in public materials, and conservative revenue-to-customer benchmarks validated through interviews.
For forecasting, scenario analysis is used so growth can be adjusted based on how quickly governance requirements, model lifecycle management needs, and infrastructure constraints evolve in each region. The scenarios are anchored to interview consensus on budget cycles and rollout timing, and then reviewed against the historical study period trendline to avoid unrealistic step changes.
Data Validation & Update Cycle
Validation is done through repeated triangulation across independent signals, including component mix checks, deployment share consistency, and year-over-year growth sanity tests against broader enterprise software and cloud indicators. If an outlier appears, the underlying drivers are rechecked and, when needed, the assumption is taken back to the field for a quick re-confirmation before the numbers are finalized.
A multi-step internal review is followed so definitions, arithmetic, and logic stay consistent across regions and time periods. Reports are refreshed annually, and interim updates are made when major market events materially change spending patterns. Before delivery, the latest public updates are re-scanned so clients receive a current view rather than an older cut of the model.
Mordor Intelligence's Neural Network Software Market Size Measured Against Other Published Estimates
Published market sizes for neural network software can look far apart even when the topic sounds the same, since each publisher draws the line differently on what is counted and how revenues are recognized. The biggest drivers usually come from scope (what is included), the year used as the current reference point, and how cloud subscriptions, platform usage, and services are treated in the revenue total.
Hardware accelerators and chips sit outside Mordor Intelligence's scope, which is one reason the 2026 value can be higher or lower than estimates that blend software with compute infrastructure or broader AI platforms. Differences also show up when one estimate counts generic analytics and data tools as neural network software, or when currency conversion timing and price progression for subscriptions are not refreshed with recent contract patterns.
Benchmark comparison
| Source | Market Size | Gaps in Research Methodology |
|---|---|---|
| Mordor Intelligence | USD 45.63 B (2026) | |
| Global Research Publisher A | USD 32.39 B (2024) | Uses an earlier base year and a longer horizon, and may apply a broader component definition that mixes software, platform, and services without consistently separating neural network specific spend from general AI tooling. |
| Industry Publisher B | USD 30.77 B (2024) | Anchors the model to 2024 values and applies a component structure that can bundle managed services differently, which changes the total when subscription pricing and deployment mix shift toward cloud and hybrid. |
Looking across the figures, the spread is mostly explained by timing and what is counted inside the revenue pool, rather than a simple math error. When the scope is kept tightly tied to neural network software tools, platforms, and directly related services, and the adoption and pricing inputs are refreshed with field checks, the resulting market value stays more repeatable from one update cycle to the next.


Key Questions Answered in the Report
What is the neural network software market’s current value and growth outlook?
The market was valued at USD 45.63 billion in 2026 and is forecast to reach USD 177.55 billion by 2031, advancing at a 31.25% CAGR.
Which region is expected to grow the fastest over the forecast period?
Asia-Pacific is projected to post the highest 34.6% CAGR through 2031, driven by national AI-cloud programs in China, Japan, India, and South Korea.
Which application segment is expanding most rapidly?
Predictive maintenance is the fastest-growing use case, with a 34.4% CAGR as manufacturers adopt neural networks to cut downtime and extend equipment life.
Why are service revenues rising faster than software license sales?
Enterprises require integration, tuning, and ongoing MLOps support, so professional and managed services are growing at 34.15% CAGR while core toolkits remain essential.
What key challenges could restrain market expansion?
Acute shortages of deep-learning MLOps talent and stringent data-privacy mandates increase deployment costs and lengthen implementation timelines.
How are companies coping with limited GPU availability?
Firms optimize models through quantization and pruning, adopt alternative hardware such as Intel Arc GPUs, and prioritize hybrid cloud deployments that balance cost with compute access.
Page last updated on:





