Natural Stone Market Size and Share
Market Overview
| Study Period | 2020 - 2031 |
|---|---|
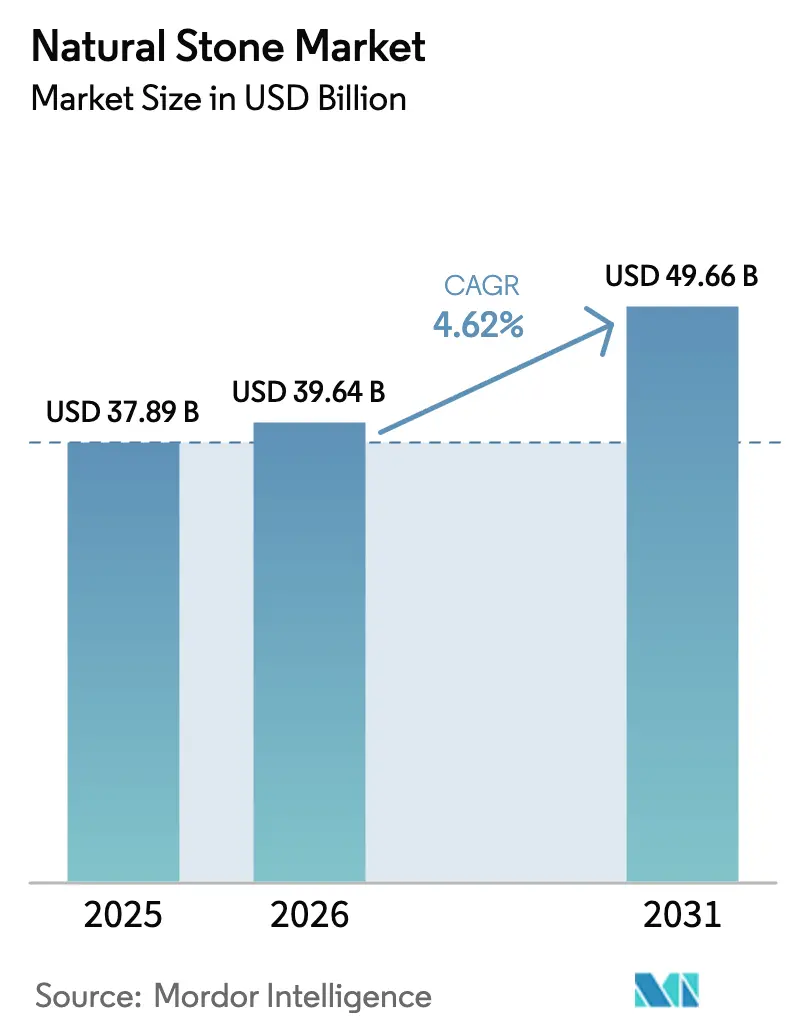
| Market Size (2026) | USD 39.64 Billion |
| Market Size (2031) | USD 49.66 Billion |
| Growth Rate (2026 - 2031) | 4.62% CAGR |
| Fastest Growing Market | Asia Pacific |
| Largest Market | Asia Pacific |
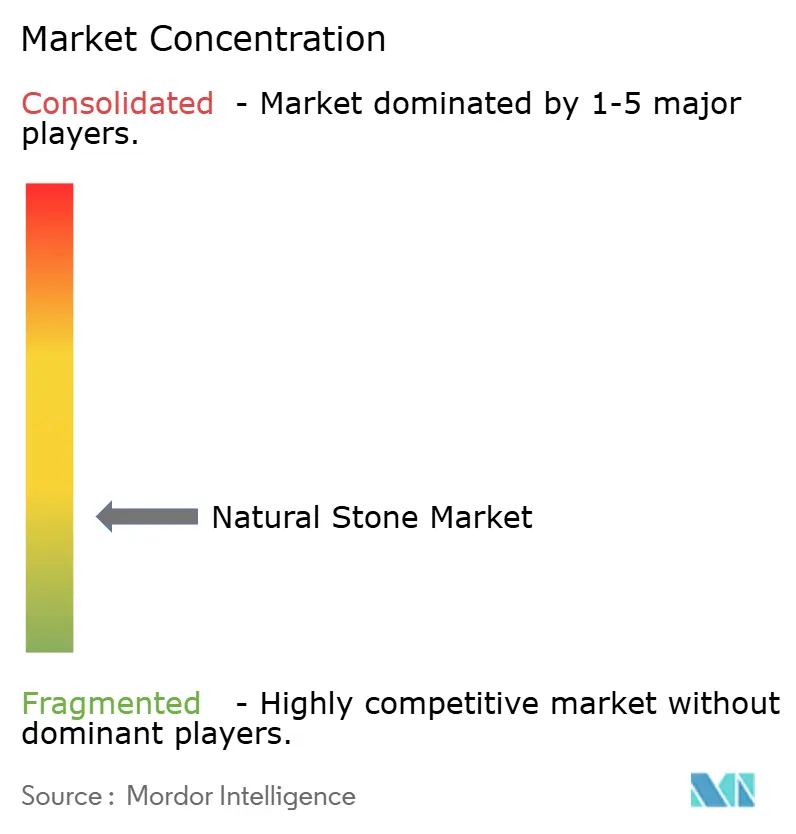
| Market Concentration | Low |
Major Players *Disclaimer: Major Players sorted in no particular order Image © Mordor Intelligence. Reuse requires attribution under CC BY 4.0. | |
Natural Stone Market Analysis by Mordor Intelligence
The Natural Stone Market size was valued at USD 37.89 billion in 2025 and estimated to grow from USD 39.64 billion in 2026 to reach USD 49.66 billion by 2031, at a CAGR of 4.62% during the forecast period (2026-2031). The natural stone market size stands at USD 37.89 billion in 2025 and is forecast to reach USD 47.63 billion by 2030, advancing at a 4.68% CAGR over the period. Growing public-sector infrastructure outlays, expanding middle-class spending on premium housing, and tightening sustainability requirements together underpin this expansion. Long-range projections calling for USD 94 trillion in global infrastructure investments by 2040 indicate a durable runway for large-volume stone applications in transport, utility, and urban renewal projects. China’s green-construction initiatives, India’s 7.6% GDP-linked construction surge, and steady North American highway upgrades sustain baseline demand even as engineered alternatives proliferate. Meanwhile, digital quarry mapping, AI-enabled yield optimization, and electric cutting systems are lowering extraction costs and curbing waste, allowing producers to meet stricter carbon metrics without eroding margins . These shifts collectively position the natural stone market to retain relevance alongside synthetics, provided suppliers demonstrate measurable progress on environmental impact and product traceability.
Key Report Takeaways
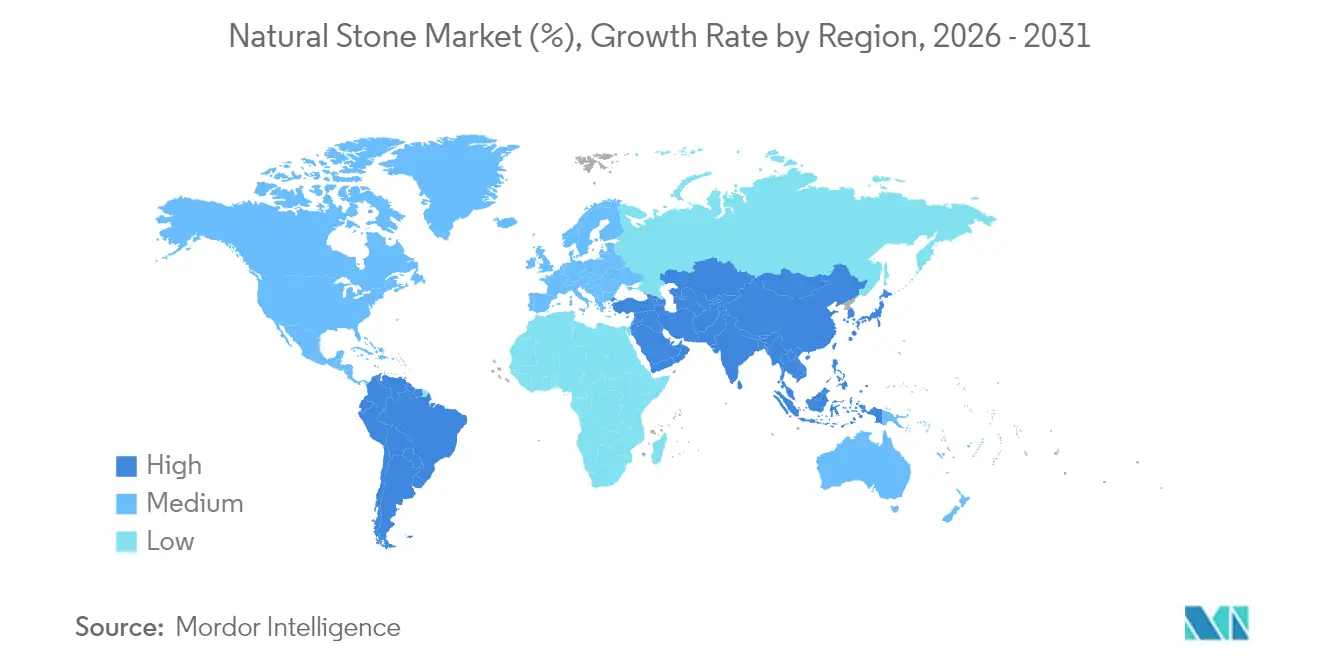
- By geography, Asia-Pacific led the natural stone industry with 48.02% revenue share in 2025 and is expanding at a 5.88% CAGR to 2031.
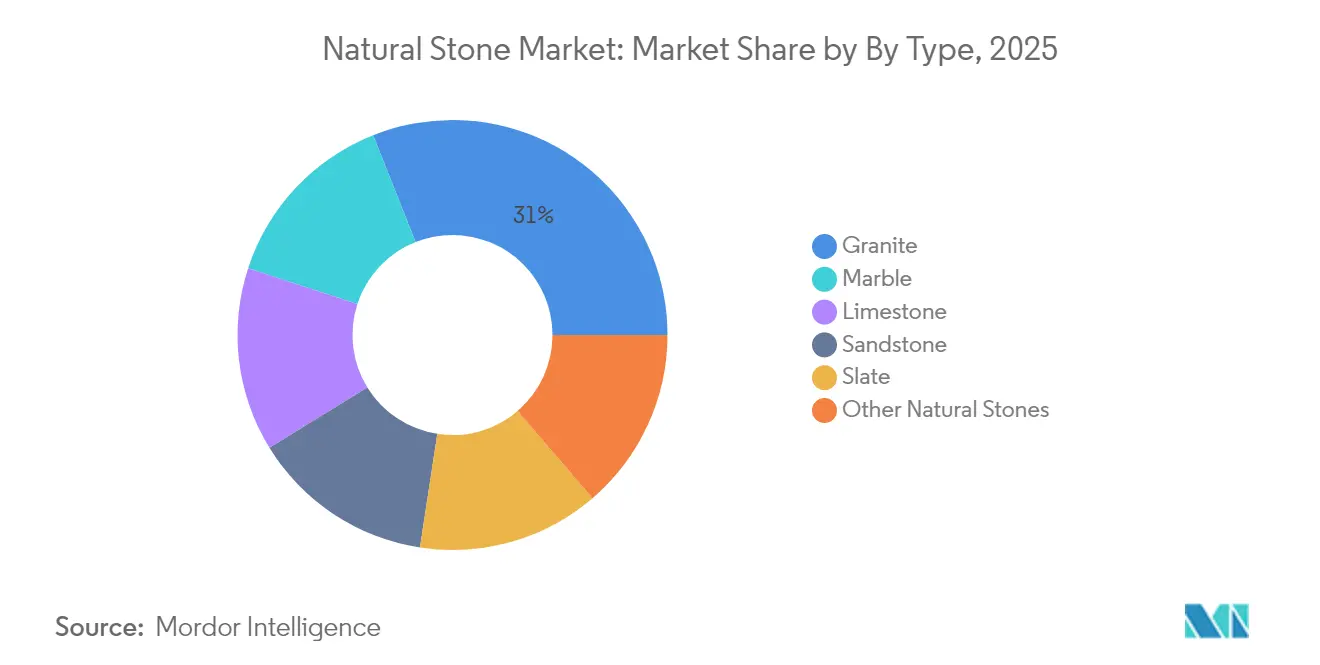
- By type, granite held 31.02% of the natural stone market share in 2025, while marble is projected to grow at 5.78% CAGR over the same horizon.
- By form, slabs accounted for 44.92% of the 2025 natural stone market size and tiles are advancing at 5.83% CAGR through 2031.
- By color group, white and light stones captured 29.78% share of the natural stone market size in 2025, whereas dark stones are forecast to climb at 5.42% CAGR to 2031.
- By application, flooring and wall cladding dominated the natural stone industry with 39.74% share in 2025; exterior uses will rise at a 4.79% CAGR through 2031.
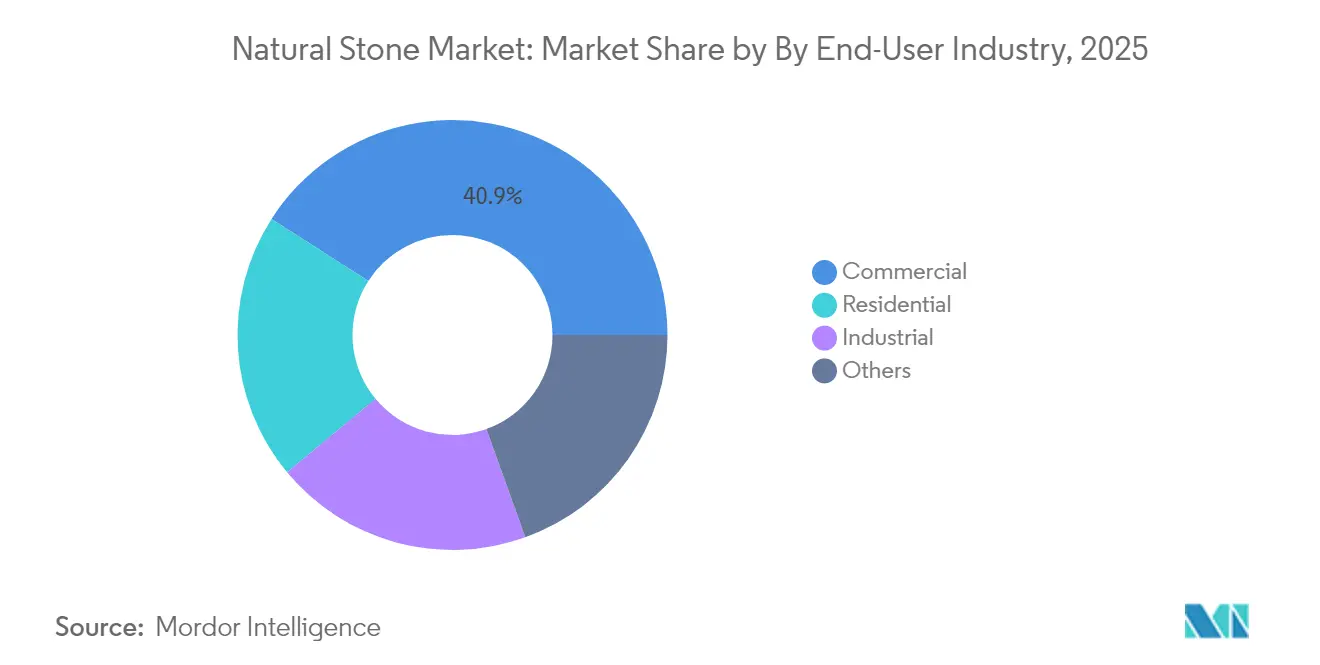
- By end-user industry, commercial projects commanded 40.92% of the natural stone market size in 2025, while residential construction registered the fastest 5.92% CAGR to 2031.
- Polycor, Levantine, and Cosentino together accounted for an estimated 18% natural stone market share in 2024.
Note: Market size and forecast figures in this report are generated using Mordor Intelligence’s proprietary estimation framework, updated with the latest available data and insights as of 2026.
Global Natural Stone Market Trends and Insights
Drivers Impact Analysis*
| Driver | % Impact on CAGR Forecast | Geographic Relevance | Impact Timeline |
|---|---|---|---|
| Robust construction and infrastructure pipeline | 1.8% | Global, with concentration in Asia-Pacific and North America | Long term (≥ 4 years) |
| Rising adoption in interior décor and landscaping | 1.2% | North America & EU, expanding to Asia-Pacific | Medium term (2-4 years) |
| Shift toward sustainable, low-embodied-carbon materials | 1.1% | Global, with early adoption in EU and North America | Medium term (2-4 years) |
| Tourism-led demand for premium stones | 0.9% | Global, particularly Asia-Pacific and Mediterranean regions | Medium term (2-4 years) |
| Digital quarry mapping and AI-driven yield optimization | 0.6% | North America & EU leading, with spillover to Asia-Pacific | Short term (≤ 2 years) |
| Source: Mordor Intelligence | |||
Robust Construction and Infrastructure Pipeline
Public spending programs widen the addressable base for the natural stone market as governments prioritize resilient materials in transport, energy, and civic upgrades. The United States Infrastructure Investment and Jobs Act has already funded more than 56,000 roadway and bridge projects, lifting the count of contracts above USD 50 million by 42% versus 2024. Asia-Pacific remains the epicenter: China is embedding natural stone façades within low-carbon city pilots, while India’s National Infrastructure Pipeline accelerates metro rail, freight corridor, and airport schemes that favor locally quarried granite and sandstone. Investors also channel capital into utility-scale renewables where substation platforms and inverter housings require dimension stone for thermal mass. BNY Mellon observes that re-shoring policies spur additional manufacturing plants needing long-life flooring and loading bays, further reinforcing structural demand. With project backlogs stretching past 2030, market participants anticipate predictable volume offtake across both core and specialty grades of stone.
Rising Adoption in Interior Decor and Landscaping
High-end residential and hospitality designers favor authentic surfaces that age gracefully, strengthening premium demand within the natural stone market. Grey travertine, for example, surged in 2025 showroom specifications owing to its neutral palette that pairs with minimalist interiors. Landscaping professionals report strong uptake of limestone patios, slate garden paths, and sandstone pool surrounds because these stones provide slip resistance, permeability for storm-water recharge, and lifecycle costs below polymer-composite decking. Local sourcing cuts freight emissions and accentuates regional character, an attribute architects now emphasize in LEED v5 submittals where half the available points align to embodied-carbon criteria. Realtors further corroborate that natural-stone hardscapes can lift resale premiums, motivating homeowners to invest even during interest-rate plateaus. This confluence keeps mid-single-digit growth intact for décor-centric formats such as tiles, cut-to-size vanity tops, and thin stone veneers.
Tourism-Led Demand for Premium Stones
Hotel developers renovating flagship properties post-pandemic are specifying marble lobbies and onyx feature walls to signal luxury and justify rate premiums. Prefabricated guest-room pods containing stone shower pans demonstrate speed-to-market advantages while meeting brand standards for durability and cleanliness. RevPAR gains above pre-2024 levels in Southeast Asia and the Mediterranean unlock capital budgets for statement façades, grand staircases, and rooftop bars finished in dark granites and slate. Resort operators highlight lower total cost of ownership relative to high-maintenance composite panels, supporting adoption across high humidity zones. Real-estate funds chasing “flight-to-quality” trends require eye-catching natural finishes that age organically and support ESG narratives. The cumulative pull from leisure investments therefore injects steady incremental volume into the natural stone market through 2030.
Digital Quarry Mapping and AI-Driven Yield Optimization
Producers are applying photogrammetry, LiDAR, and drone imaging to build centimeter-accurate digital twins of quarry faces, enabling precise blast design and block extraction. BHP’s deployment of predictive analytics has cut unplanned crusher downtime by 25%, showcasing the transferability of mining AI into dimension-stone operations. Northwood Machine’s Raptor SawJet interprets scanned slab data to plot cut paths that raise usable yield by as much as 12% while lowering water consumption. In Australia, Roy Hill’s fleet autonomy roadmap is echoed by medium-size stone quarries that retrofit haul trucks with collision-avoidance sensors to bolster safety compliance[1]. Early adopters in the natural stone market can therefore report higher output with stable headcount, allowing them to absorb rising regulatory fees without passing costs quickly to buyers. Efficiency gains serve as a buffer against tariff volatility and carbon taxes, keeping the natural stone market competitive with engineered substitutes.
Restraints Impact Analysis*
| Restraint | % Impact on CAGR Forecast | Geographic Relevance | Impact Timeline |
|---|---|---|---|
| Environmental scrutiny of quarrying practices | -0.8% | Global, with stricter enforcement in EU and North America | Long term (≥ 4 years) |
| High logistics and cutting-tool costs | -0.7% | Global, with higher impact in import-dependent regions | Medium term (2-4 years) |
| Rising competition from sintered/engineered surfaces | -0.5% | North America & EU primarily, expanding to Asia-Pacific | Medium term (2-4 years) |
| Source: Mordor Intelligence | |||
Environmental Scrutiny of Quarrying Practices
Regulators now demand verifiable mitigation plans that extend well beyond dust and noise abatement in the natural stone market. The Texas Commission on Environmental Quality requires annual registration and tri-yearly onsite inspections for all commercial aggregate and dimension-stone producers[2]. EU directives compel comprehensive biodiversity audits and post-closure land-use commitments, while the US EPA’s Part 436 effluent rule sets tough discharge limits on total suspended solids and pH for stone operations. Research in Cameroon identifying vegetation loss and habitat fragmentation from uncontrolled blasting has galvanized NGOs to lobby for satellite monitoring of quarries. Australia’s McNaught’s Quarry showcases a potential compliance model by pledging farmland rehabilitation and strict water-runoff controls to secure its permit. Meeting these stipulations inflates capital expenditure, particularly for small firms, and can delay project mobilization, tempering near-term growth.
Rising Competition from Sintered/Engineered Surfaces
Engineered-quartz suppliers have responded to silicosis litigation with lower-silica recipes and fully silica-free lines. Cosentino’s latest Silestone collections contain under 10% crystalline silica and rely on 99% recycled process water and renewable energy, countering health and sustainability critiques. Neolith unveiled a proprietary binder system that eliminates respirable silica altogether. Breton is layering digital-print technology over bio-resin matrices, producing aesthetics that closely mimic rare marbles at scale. While legal settlements such as Caesarstone’s USD 52 million payout underscore liabilities, the engineered sector’s agility keeps price points attractive and color consistency high. The natural stone market counters by highlighting its inherently lower embodied carbon and unique veining, yet must still overcome specification inertia driven by fabricator familiarity with engineered slabs.
*Our forecasts treat driver/restraint impacts as directional, not additive. The impact forecasts reflect baseline growth, mix effects, and variable interactions.
Segment Analysis
By Type: Granite Leadership Meets Marble Renaissance
Granite accounted for 31.02% of the natural stone market in 2025, a position rooted in its compressive strength, weather resistance, and broad color palette. Architects continue to specify polished black and salt-and-pepper granites for high-traffic transit terminals and super-regional malls, keeping baseline volumes robust. The marble category is scaling fastest at a 5.78% CAGR as luxury villas, boutique hotels, and corporate flagship offices pivot toward expressive Calacatta and Pietra Grey panels that complement minimalist lighting schemes. Marble’s porosity once deterred heavy-duty flooring use, yet new impregnating sealers have prolonged maintenance cycles, widening its acceptance in hospitality bathrooms and reception counters. Limestone enjoys steady demand from civic projects seeking locally quarried materials to minimize transport emissions, while sandstone and slate maintain niche status for heritage façades and upscale roofing. Exotic species such as quartzite and onyx command premium pricing within bespoke fit-outs and sculpture parks, adding incremental value even if volume share stays modest. The type mix therefore illustrates the natural stone market’s capacity to serve both commodity and aspirational design briefs without diluting authenticity.
Premium marble’s acceleration signals rising design literacy among emerging-market developers who aim to differentiate assets visually and environmentally. Investment in specialized gang-saws and resin lines likewise enables processors to optimize block yield across varied lithologies, mitigating cost disparities between commodity granite and fragile marbles. Suppliers that couple robust logistics with in-house finishing can capture cross-selling opportunities, bundling rough granite for exterior cladding with vein-matched marble for interior accents. Joint marketing by quarry clusters also educates specifiers on each stone’s carbon profile, supporting LEED v5 documentation. Consequently, granite’s leadership remains secure, yet marble’s renaissance adds margin richness, reinforcing healthy top-line growth in the natural stone market.


By Form: Slab Dominance Versus Tile Innovation
Slabs represented 44.92% of the 2025 natural stone market size, reflecting their popularity for kitchen tops, conference tables, and large-format wall panels. Shipments of jumbo slabs (≥ 3.3 m) increased on the back of optimized wire-sawing and vacuum epoxy reinforcement, which reduce breakage rates during fabrication and installation. Slab demand further benefits from the adoption of concealed wireless chargers as Cosentino and FreePower embed induction coils beneath 20 mm surfaces, marrying aesthetics with smart-home functionality. Tiles, advancing at 5.83% CAGR, are gaining as budget-friendly yet upscale substitutes for ceramic alternatives in mid-tier housing renovations. Digital inkjet printers now apply high-resolution imagery onto cut stone, enabling French-pattern modular sets that deliver visual variety without intensive layout labor. Block sales remain the upstream feedstock; their offtake tracks quarry output and is closely linked to export compliance documentation such as chain-of-custody certificates.
Continued mechanization shrinks per-unit finishing costs, allowing mid-sized factories in India, Vietnam, and Turkey to match global tolerance standards and participate in multinational supply chains. Tile innovation aligns with rising do-it-yourself culture, as contractors appreciate thinner, lighter panels that simplify handling. Meanwhile, mega-slab deploys remain preferred by luxury showrooms seeking seamless book-matched walls. By combining advanced resins, back-lighting options, and integrated device charging, suppliers broaden use cases, ensuring both slabs and tiles advance in tandem and foster balanced revenue streams across the natural stone market.
By Color Group: Classic Preferences Meet Contemporary Trends
White and light varieties claimed 29.78% share of the natural stone market in 2025 because of their compatibility with open-plan interiors and daylight-harvesting strategies. Carrara, Bianco Sivec, and Thassos White continue to headline European exports to North American cabinet manufacturers targeting light-toned kitchen aesthetics. Dark stones, posting a brisk 5.42% CAGR through 2031, resonate with luxury retail and hotel designers who leverage Nero Marquina and Cambrian Black granites to craft dramatic statement walls. Consumers also gravitate toward charcoal and midnight hues that hide grout lines and pair with matte-black fixtures. Colored stones, emerald quartzite, Rosso Verona, or Azul Bahia, serve gallery floors, worship spaces, and boutique fashion houses where unique chromatic identity justifies premium budgets.
Regional climate and cultural symbolism steer color selection: tropical markets prefer cool whites that temper solar gain, whereas Nordic countries embrace darker stones to accentuate refined lighting schemes. Suppliers manage color-match consistency via advanced photo-spectrometry sorting, thereby reducing job-site rejections. Trending greys and taupes emerge from travertine quarries that selectively fill natural voids to accentuate stratified patterns. As personalization rises, color mixing within single projects unlocks incremental square-meter volumes, reinforcing revenue diversity for quarries and fabricators in the natural stone market.
By Application: Flooring Strength Drives Exterior Growth
Flooring and wall cladding generated 39.74% of 2025 revenues within the natural stone market, propelled by airports, museums, and state capitols that regard stone as both structural surface and cultural emblem. Dimensional tolerances have tightened, enabling thin-set installations that reduce dead load while preserving longevity. Exterior landscaping and paving, growing at 4.79% CAGR, reflects rising demand for biophilic public realms that integrate permeable stone pavers and seating blocks into urban greenscapes. Countertops sustain double-digit square-foot prices thanks to resilience against thermal shock and cut marks, preserving their position even as sintered substitutes compete. Monumental art and civic memorials maintain a specialized but steady flow of orders for sculptors and stonemasons.
European municipalities now require life-cycle assessments for plaza refurbishments, tipping specifications toward local granite cobbles over imported concrete units. In North America, pool-deck retrofits favor sandstone and quartzite that remain cool underfoot and resist chlorine abrasion. Architects also revitalize facades by replacing aging aluminum panels with ventilated natural-stone rain-screens, improving thermal mass and extending building life. Across these use cases, natural stone’s authenticity and recycling potential advantage it over polymer composites, securing its role in next-generation public and private developments.
By End-User Industry: Commercial Leadership Yields to Residential Growth
Commercial construction absorbed 40.92% of the natural stone market size in 2025 as corporate campuses, malls, and institutional buildings prioritize materials that withstand continuous footfall and deliver prestige branding. Natural-stone clad façades help firms achieve corporate-responsibility targets by demonstrating investment in low-maintenance, low-VOC envelopes. Residential demand, climbing at a 5.92% CAGR, reflects a consumer pivot toward wellness-oriented home environments where natural textures and thermal comfort score highly. Upscale subdivisions specify stone driveways and porch columns to elevate curb appeal, while condominium developments install book-matched marble lobbies to attract premium buyers. Industrial facilities rely on acid-resistant dolomite and basalt flooring in chemical plants, representing a niche yet margin-rich segment.
Remote work adoption drives renovation spending on home offices and outdoor kitchens lined with durable stone counters. Real-estate developers have packaged such amenities as value differentiation, accelerating volume uptake. Conversely, office sector headwinds moderate commercial momentum but are offset by refurbishment projects aimed at creating hybrid collaboration spaces accented with tactile stone finishes. Overall, the end-user mix underscores balanced secular growth for the natural stone market.
Geography Analysis
Asia-Pacific commanded 48.02% of the natural stone market in 2025 and is registering the fastest 5.88% CAGR through 2031, underpinned by megacity expansions, high-speed rail corridors, and government-backed housing schemes. China’s Ministry of Housing is piloting digital material passports for public buildings, incentivizing traceable limestone and granite that tally precise embodied carbon values. India remains both a top limestone importer at USD 711 million in 2023 and the eighth-largest exporter at USD 21.6 million, illustrating bidirectional trade driven by grade differentiation. Southeast Asian tourism hubs such as Vietnam and Indonesia are adding beachfront resorts that feature indigenous and imported marble, further amplifying regional demand.
North America represents a mature yet technologically progressive natural stone market. Federal infrastructure stimulus strengthens backlogs in bridge deck guard walls, subway concourses, and civic squares. Tariffs of 145% on Chinese stone imports, alongside variable duties on Turkey, Brazil, and India, are steering distributors to diversify sourcing strategies, often favoring domestic quarries to lock in lead-time certainty. The upcoming LEED v5 framework, pegged to launch in early 2025, incentivizes carbon reporting and could elevate demand for stones with Environmental Product Declarations. Producers are therefore investing in electric fleets and renewable-powered saw halls to position favorably with US designers.
Europe upholds its reputation for artisanal craftsmanship and tight environmental oversight within the natural stone market. Italy, Portugal, and Spain collectively anchor continental exports of slab and cut-to-size marble, commanding premium pricing. Rising freight and energy tabs have led French industry associations to dissect total-landed-cost differentials, illuminating advantages of intra-EU sourcing where workable. Architects across Germany and the Nordics are increasingly specifying local amphibolite and gneiss to meet municipal carbon budgets. At the same time, Eastern European nations leverage EU cohesion funds to modernize quarry equipment, bringing them into competitive alignment and diversifying supply.
Collectively, these regional dynamics cement a global natural stone market in which Asia-Pacific remains the volume leader, North America shapes sustainability benchmarks, and Europe pioneers design trends, each contributing distinct growth levers that together reinforce the market’s long-term stability.

Competitive Landscape
The natural stone market encompasses more than 7,000 quarries and processing plants worldwide making the market fragmented, yet ownership consolidation is accelerating as integrated players snap up strategically located deposits. Polycor extended its North American footprint by acquiring several legacy marble quarries, enabling cradle-to-gate transparency and shorter lead times for LEED projects. Levantina’s investment in photovoltaic arrays across Spanish plants has sliced electricity costs and improved Scope 2 emission metrics, aligning with client sustainability scorecards. Cosentino demonstrates product innovation leadership by embedding FreePower wireless charging technology into Dekton and Silestone surfaces, pushing natural stone and hybrid surfaces into the smart-home arena.
Competitive differentiation increasingly hinges on digital supply-chain management in the natural stone market. AI-enabled inventory platforms allow producers to live-stream slab images and reserve lots in real time, reducing double-handling and supporting just-in-sequence fabrication for large projects. Meanwhile, vertical ties with logistics providers mitigate container shortages and tariff exposure, crucial for US distributors navigating fluctuating duties on Chinese cargo. Companies are also adopting the Natural Stone Institute’s ANSI/NSI 373 standard to validate responsible sourcing, a credential now demanded by major architectural practices.
Engineered-surface suppliers intensify rivalry by broadening low-silica and carbon-neutral lines, but the firms in the natural stone market fight back through narrative marketing that highlights geological uniqueness and lower embodied energy. Joint advocacy campaigns underscore recyclability and cradle-to-cradle lifespans, positioning stone as a circular-economy material. As procurement teams incorporate carbon shadow pricing, quarry operators with renewable-powered cutting mills and electric haul trucks gain negotiating leverage. Over the forecast window, M&A activity is expected to concentrate additional share among the top 10 brands, yet hundreds of regional specialists will remain essential to serve locale-specific design aesthetics, ensuring continued moderate fragmentation.
Natural Stone Industry Leaders
Polycor Inc.
Levantina y Asociados de Minerales S.A.
Cosentino Global, S.L.U.
Temmer Mermer Madencilik İnşaat Sanayi ve Ticaret Anonim Şirket
Antolini Luigi and C. S.p.A.
- *Disclaimer: Major Players sorted in no particular order

Recent Industry Developments
- April 2025: Mosaic Companies acquired Opustone, a South Florida decorative stone specialist, following its January 2021 acquisition of Walker Zanger, enhancing its presence in the luxury natural and engineered stone market across North America
- September 2024: Cosentino launched the Le Chic Bohème line of Silestone featuring low silica content (less than 10% crystalline silica) and sustainable manufacturing using 99% reused water and 100% renewable energy


Global Natural Stone Market Report Scope
| Marble |
| Granite |
| Limestone |
| Sandstone |
| Slate |
| Other Natural Stones |
| Slabs |
| Blocks |
| Tiles |
| White and Light |
| Dark (Black, Brown) |
| Colored (Green, Red, Others) |
| Monuments and Statues |
| Flooring and Wall Cladding |
| Exterior (Paving, Landscaping) |
| Countertops and Vanity Tops |
| Other Applications |
| Residential |
| Commercial |
| Industrial |
| Others |
| North America | United States |
| Canada | |
| Mexico | |
| South America | Brazil |
| Argentina | |
| Rest of South America | |
| Europe | Germany |
| United Kingdom | |
| France | |
| Italy | |
| Spain | |
| Rest of Europe | |
| Asia-Pacific | China |
| India | |
| Japan | |
| Australia | |
| South Korea | |
| Rest of Asia-pacific | |
| Middle-East and Africa | Saudi Arabia |
| Turkey | |
| South Africa | |
| Rest of Middle-East and Africa |
| By Type | Marble | |
| Granite | ||
| Limestone | ||
| Sandstone | ||
| Slate | ||
| Other Natural Stones | ||
| By Form | Slabs | |
| Blocks | ||
| Tiles | ||
| By Color Group | White and Light | |
| Dark (Black, Brown) | ||
| Colored (Green, Red, Others) | ||
| By Application | Monuments and Statues | |
| Flooring and Wall Cladding | ||
| Exterior (Paving, Landscaping) | ||
| Countertops and Vanity Tops | ||
| Other Applications | ||
| By End-user Industry | Residential | |
| Commercial | ||
| Industrial | ||
| Others | ||
| By Geography | North America | United States |
| Canada | ||
| Mexico | ||
| South America | Brazil | |
| Argentina | ||
| Rest of South America | ||
| Europe | Germany | |
| United Kingdom | ||
| France | ||
| Italy | ||
| Spain | ||
| Rest of Europe | ||
| Asia-Pacific | China | |
| India | ||
| Japan | ||
| Australia | ||
| South Korea | ||
| Rest of Asia-pacific | ||
| Middle-East and Africa | Saudi Arabia | |
| Turkey | ||
| South Africa | ||
| Rest of Middle-East and Africa | ||


Key Questions Answered in the Report
What is the current size of the natural stone market?
The natural stone market size is USD 39.64 billion in 2026.
How fast is the natural stone market expected to grow?
It is projected to record a 4.62% CAGR between 2026 and 2031.
Which region leads the natural stone market?
Asia-Pacific holds 48.02% share and is also the fastest-growing region at 5.88% CAGR through 2031.
Which product type dominates the natural stone market?
Granite leads with 31.02% natural stone market share, while marble is the fastest-growing type at 5.78% CAGR.
Page last updated on:


