Limestone Market Size and Share
Market Overview
| Study Period | 2020 - 2031 |
|---|---|
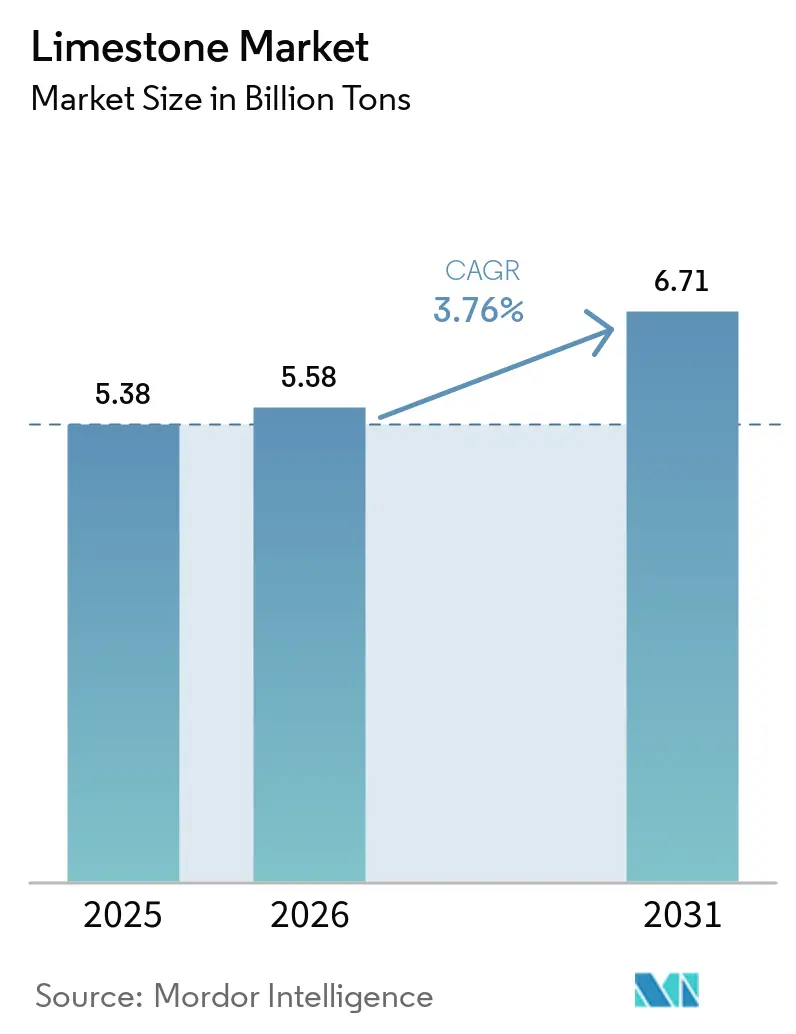
| Market Volume (2026) | 5.58 Billion tons |
| Market Volume (2031) | 6.71 Billion tons |
| Growth Rate (2026 - 2031) | 3.76% CAGR |
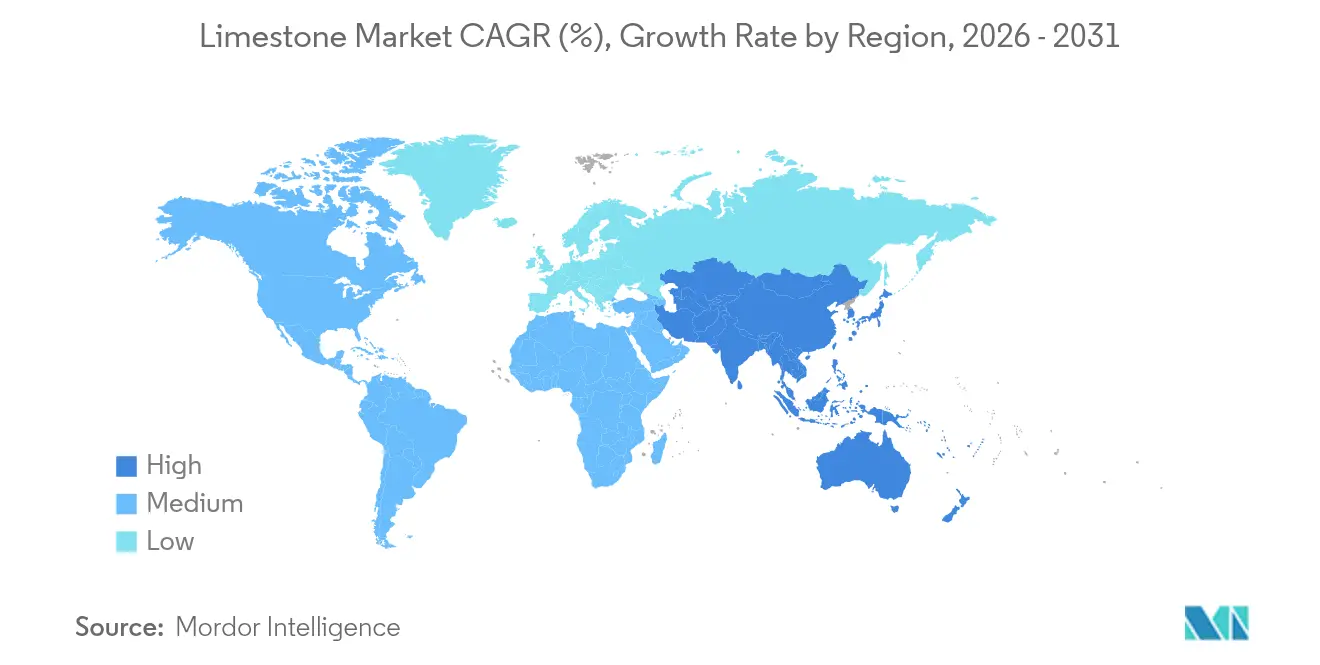
| Fastest Growing Market | Asia Pacific |
| Largest Market | Asia Pacific |
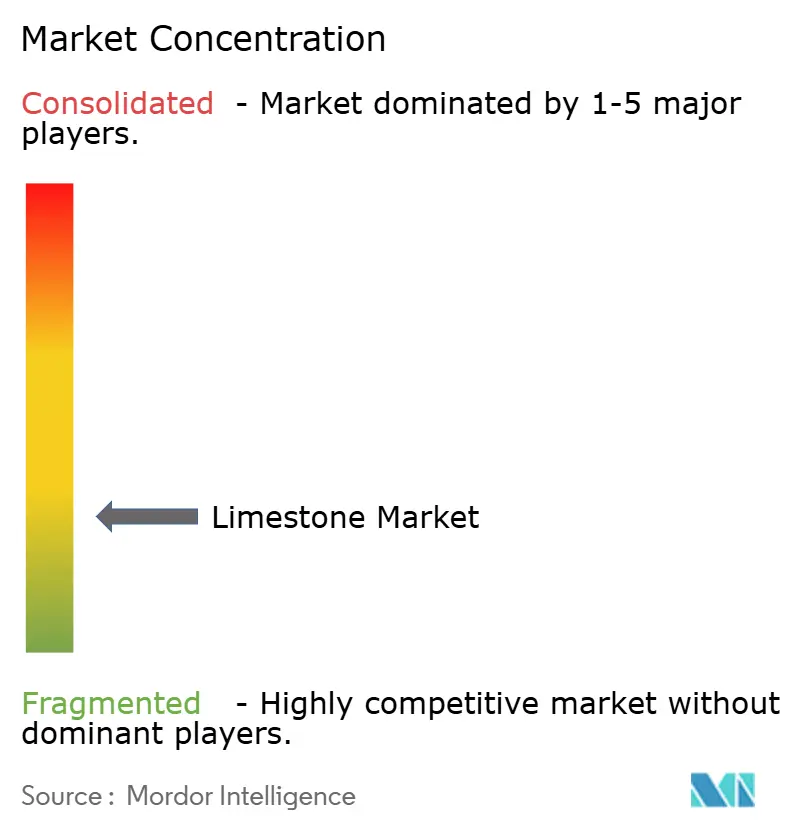
| Market Concentration | Low |
Major Players *Disclaimer: Major Players sorted in no particular order Image © Mordor Intelligence. Reuse requires attribution under CC BY 4.0. | |
Limestone Market Analysis by Mordor Intelligence
Limestone market size in 2026 is estimated at 5.58 Billion tons, growing from 2025 value of 5.38 Billion tons with 2031 projections showing 6.71 Billion tons, growing at 3.76% CAGR over 2026-2031. This steady rise is anchored in limestone’s irreplaceable role in steel flux, cement clinker, flue-gas desulfurization (FGD), and emerging carbon-removal technologies. Industrial lime applications continue to dominate volume demand as steelmakers shift to hydrogen-based direct-reduction processes that consume more flux per ton of output. Construction activity in emerging Asia, stricter environmental regulations in coal-reliant economies, and premium-grade demand from direct-air-capture pilots add further momentum. Competitive activity centers on acquisitions that secure long-life quarries and integrate downstream processing, while tightening quarry permits and rising carbon-tax exposure shape cost structures.
Key Report Takeaways
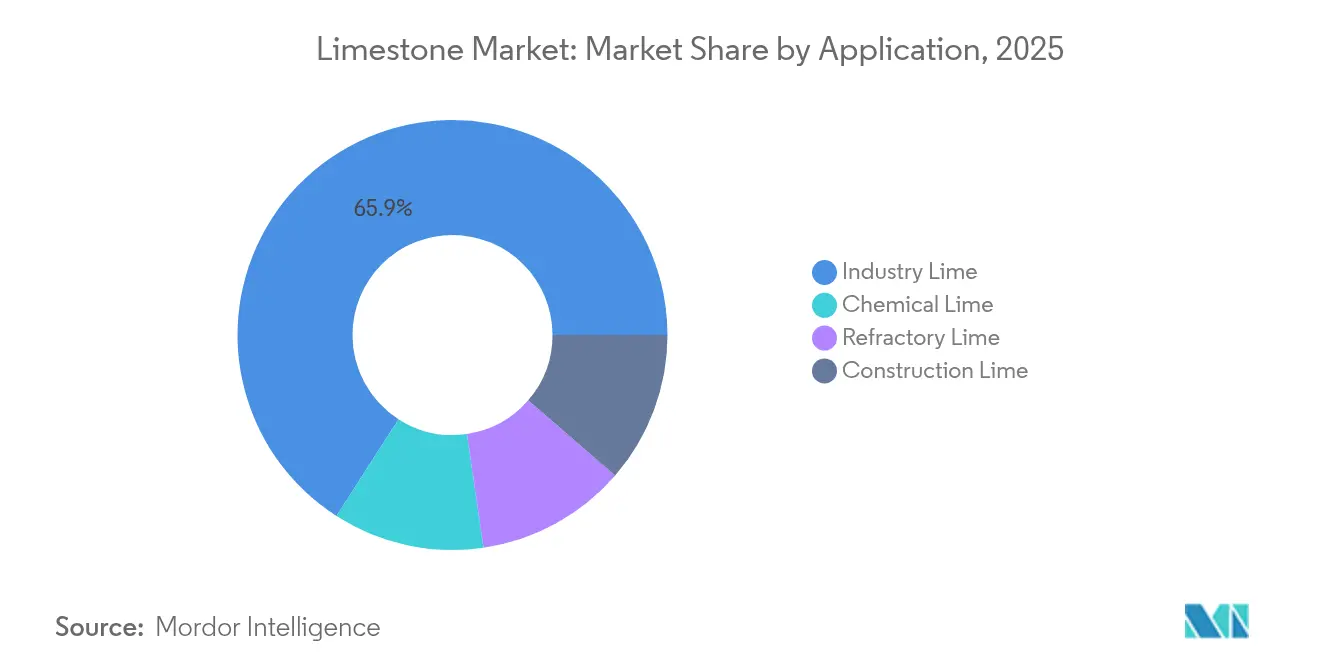
- By application, industry lime held 65.92% of limestone market share in 2025 and is forecast to expand at a 4.02% CAGR through 2031.
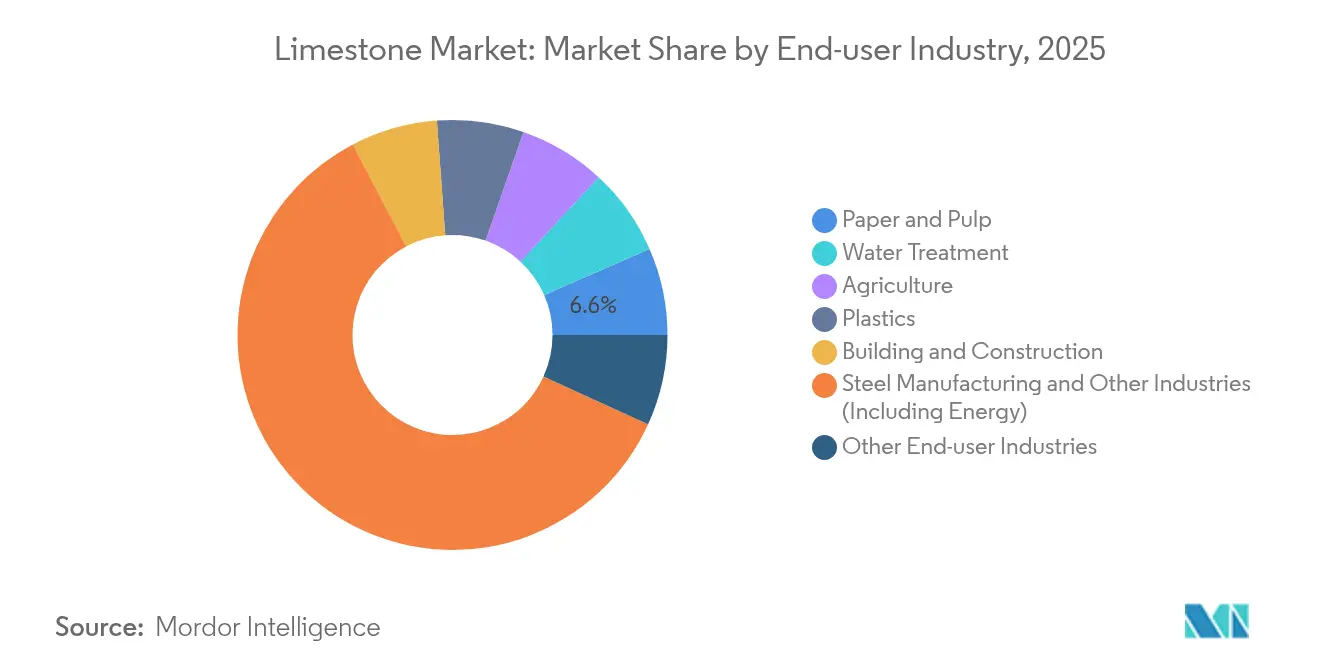
- By end-user industry, steel manufacturing and other energy-intensive sectors captured 60.52% of the limestone market size in 2025 and show a 4.03% growth outlook to 2031.
- By geography, Asia-Pacific commanded 71.62% of global market share in 2025; the region is also the fastest-growing, with a 4.49% CAGR projected to 2031.
Note: Market size and forecast figures in this report are generated using Mordor Intelligence’s proprietary estimation framework, updated with the latest available data and insights as of 2026.
Global Limestone Market Trends and Insights
Driver Impact Analysis*
| Drivers | (~) % Impact on CAGR Forecast | Geographic Relevance | Impact Timeline |
|---|---|---|---|
| Construction super-cycle in emerging Asia | +1.2% | Asia-Pacific core; spill-over to MEA | Medium term (2-4 years) |
| Steel-intensive energy-transition projects | +0.8% | Global; concentration in North America and EU | Long term (≥ 4 years) |
| Desulfurization mandates in coal economies | +0.6% | Asia-Pacific; Eastern Europe | Short term (≤ 2 years) |
| Direct-air-capture and ocean mineralization | +0.4% | North America; Western Europe | Long term (≥ 4 years) |
| Ultra-fine CaCO₃ in bio-based plastics | +0.3% | Global; led by Asia-Pacific manufacturing hubs | Medium term (2-4 years) |
| Source: Mordor Intelligence | |||
Construction Super-cycle in Emerging Asia Drives Bulk Limestone Demand
Accelerated infrastructure programs across India, Indonesia, Vietnam, and Cambodia keep cement kilns running near nameplate capacity, raising limestone pull-through because the mineral accounts for roughly 80% of cement feedstock. The short haul radius that quarry stone can travel economically, typically less than 200 km, concentrates supply risk near large urban projects. Nevertheless, abundant reserves in Rajasthan, Odisha, and Andhra Pradesh continue to anchor India’s cost advantage in the limestone market.
Steel-intensive Energy-transition Projects Boost Flux Consumption
Wind-turbine foundations require 200-400 tons of steel per megawatt, driving parallel limestone industry demand because steel flux rates in basic-oxygen and electric-arc furnaces rise as operators chase cleaner chemistries. Hydrogen-based direct-reduction iron (DRI-H₂) flowsheets consume 15-20% more flux to manage increased gangue pickup, while solar-grade glass for utility-scale photovoltaics needs limestone-derived soda-lime silicates at 3-4 tons per megawatt. Global renewables expansion toward 11,000 GW by 2030 therefore keeps industrial lime volumes growing even as steel shifts to low-carbon pathways.
Desulfurization Environmental Mandates in Coal-heavy Economies
China, India, and several Southeast Asian nations have tightened sulfur-dioxide emission ceilings, compelling power-plant operators to retrofit FGD units that absorb SO₂ at 1.2-1.5 tons of limestone per ton of pollutant removed. These specifications demand more than or equal to 90% CaCO₃ and narrow particle-size distributions, conferring pricing power on quarries capable of beneficiation within the limestone market. Policy momentum remains intact until at least 2030, providing a predictable offtake stream that underwrites new mine development despite the eventual coal-phase-out trajectory.
Ultra-fine CaCO₃ in Bio-based Plastics
Polymer compounders in China and Malaysia incorporate sub-1 µm calcium-carbonate masterbatches to lower petroleum resin share and improve stiffness in compostable films. The shift is incremental today but aligns with plastic-tax regimes in the EU and U.S., positioning limestone fillers as key enablers of cost-effective bio-polymers.
Restraint Impact Analysis*
| Restraints | (~) % Impact on CAGR Forecast | Geographic Relevance | Impact Timeline |
|---|---|---|---|
| Quarry-footprint litigation | -0.7% | North America; Western Europe; Australia | Short term (≤ 2 years) |
| High process CO₂ from lime kilns | -0.5% | EU; North America with carbon pricing | Medium term (2-4 years) |
| Engineered stone and geopolymer cement | -0.3% | Global; concentrated in developed markets | Long term (≥ 4 years) |
| Source: Mordor Intelligence | |||
Quarry-footprint and Biodiversity Litigation Tighten Operating Licenses
Ontario’s Aggregate Resources Act now requires multi-year ecological baselines, water-table modeling, and post-closure rehabilitation guarantees that lift pre-production costs by 8-12% of life-of-mine capital[1]Ontario Ministry of Natural Resources, “Aggregate Resources,” ontario.ca . Similar hurdles in Queensland and California extend approval cycles beyond two years, pressuring smaller operators to consolidate or divest. Water-abstraction permits, such as Longcliffe’s request to boost intake to 350,000 m³/year, face public consultation and environmental scrutiny that add time and cost[2]UK Government, “Longcliffe Quarries Limited: application made to abstract water,” gov.uk. Deposits situated in habitat-rich areas thus face rising legal risks, restricting supply of premium stone grades in the limestone industry.
High Process CO₂ from Lime Kilns Invites Carbon-tax Exposure
Calcination releases 0.785 tons of CO₂ per ton of lime, making process emissions 65-75% of a plant’s footprint. The EU Emissions Trading System and its forthcoming Carbon Border Adjustment Mechanism raise effective carbon costs, prompting producers like Carmeuse to budget 15-25% higher capex for post-combustion capture and utilization schemes. North American operators anticipate similar liabilities as regional carbon-pricing frameworks proliferate. Without carbon capture, delivered-cost parity against substitutes such as slag or fly-ash weakens, threatening demand in price-sensitive construction markets within the limestone market.
*Our forecasts treat driver/restraint impacts as directional, not additive. The impact forecasts reflect baseline growth, mix effects, and variable interactions.
Segment Analysis
By Application: Industrial Lime Underpins Decarbonizing Steel Supply Chains
Industrial lime held 65.92% of limestone market share in 2025. Intensifying hydrogen-DRI trials in the EU and the U.S. underpin a 4.02% CAGR outlook, ensuring industrial lime remains the anchor of the global market through 2031. Chemical lime follows at mid-single-digit growth, fueled by stricter wastewater norms and sulfur-capture mandates in Asia. Construction lime volumes stay flat as alternative binders gain traction, while refractory grades show niche expansion tied to electric-arc furnace ladle linings.
Long-term supply contracts between integrated steel mills and quarry owners stabilize cash flow, insulating the largest miners from cyclical spot swings. Players such as Lhoist have signed memoranda with green-steel developers to deliver certified low-carbon lime, leveraging vertical partnerships to hedge against carbon taxes.


By End-User Industry: Steel Manufacturing Sets the Demand Tone
Steel and allied energy sectors absorbed 60.52% of the limestone market size in 2025, and are on track for a 4.03% CAGR to 2031. Each new gigawatt of offshore wind requires more than 100,000 tons of steel plate, indirectly routing limestone into tower and foundation manufacturing. Water-treatment operators represent a distant but stable second-tier consumer as municipalities tighten heavy-metal discharge limits. Paper and pulp mills retain limestone use in calcium-carbonate coated sheets, though digital substitution caps growth.
Building-and-construction volumes remain large yet increasingly substitution-prone, as engineered stone and geopolymer cements reduce clinker factors. Agriculture applications display mid-single-digit gains on rising soil-health spending in Brazil and Vietnam. Plastics compounders now trial ultra-fine CaCO₃ masterbatches to curb feedstock costs, signaling a future micro-segment with premium margin potential. The diversified end-user mix cushions total demand, but steel’s sheer scale means any prolonged output dip would ripple quickly through quarry order books.
Geography Analysis
Asia-Pacific accounted for 71.62% of global limestone market share in 2025 and is poised for a 4.49% CAGR through 2031. Abundant on-shore deposits in Rajasthan, Guangxi, and Java keep delivered-cost curves low despite rising diesel prices. Southeast Asian governments mandate FGD retrofits on coal plants, adding specialized limestone demand that local quarries in Vietnam’s Ha Nam and Indonesia’s South Sumatra have begun to supply.
North America and Europe offer smaller volumes but higher value, driven by downstream decarbonization technologies. Graymont’s rebrand toward “calcium-based solutions” and Carmeuse’s CO₂ road-map position regional leaders for DAC supply contracts and Portland Limestone Cement expansions.
The Middle East and Africa register accelerating limestone market growth as Saudi Arabia expands quarry licensing to feed giga-projects and Egypt positions itself as a GCC supplier of precipitated calcium carbonate. South America’s trajectory hinges on Brazil’s infrastructure stimulus and Argentina’s political stability. Indonesian state-backed producer Semen Baturaja posted record 2024 earnings, reflecting strong domestic cement pull.
Mordor Intelligence provides coverage of the limestone market across other key regional markets, including North America, each with their regulatory frameworks and demand patterns.

Competitive Landscape
The global limestone market remains highly fragmented. Technology deployment differentiates operators. Environmental credentials form a second competitive axis. Carmeuse pilots amine-scrubbed carbon-capture on Belgian kilns, seeking to monetize CO₂ as synthetic limestone aggregate, whereas Graymont’s portfolio prioritizes renewable-powered grinding circuits. Regional mid-tier players defend share with proximity and customer service. In the UK, Longcliffe’s USD 3 million mill upgrade enhances 10 µm top-size powders for pharmaceutical and food applications.
Limestone Industry Leaders
Imerys
Carmeuse
Graymont Limited
Holcim
Lhoist
- *Disclaimer: Major Players sorted in no particular order

Recent Industry Developments
- August 2025: CALIDRA announced a USD 30 million investment to expand limestone operations in Argentina and Chile, targeting growth in Latin America’s mining, steel, and construction sectors.
- April 2024: Longcliffe Quarries committed USD 3 million for two new ultra-fine grinding mills to meet tightening purity requirements in high-spec calcium-carbonate applications while lowering energy intensity.


Global Limestone Market Report Scope
Limestone is a sedimentary rock that is primarily composed of calcium carbonate, generally in the form of mineral calcite or aragonite. It is typically a biological sedimentary rock that is formed from the accumulation of shell, algal, fecal, coral, and other organic debris. However, some limestones are also formed by chemical sedimentary processes, including the precipitation of calcium carbonate from ocean or lake water.
The limestone market is segmented by application, end-user industry, and geography. By application, the market is segmented into industry lime, chemical lime, construction lime, and refractory lime. By end-user industry, the market is segmented into paper and pulp, water treatment, agriculture, plastics, building and construction, steel manufacturing, and other end-user industries (glass and mining, among others). The report also covers the sizes and forecasts for the limestone market in 27 countries across major regions. For each segment, the market sizing and forecasts have been done on the basis of volume (kilotons).
| Industry Lime |
| Chemical Lime |
| Construction Lime |
| Refractory Lime |
| Paper and Pulp |
| Water Treatment |
| Agriculture |
| Plastics |
| Building and Construction |
| Steel Manufacturing and Other Industries (Including Energy) |
| Other End-user Industries |
| Asia-Pacific | China |
| India | |
| Japan | |
| South Korea | |
| ASEAN | |
| Rest of Asia-Pacific | |
| North America | United States |
| Canada | |
| Mexico | |
| Europe | Germany |
| United Kingdom | |
| France | |
| Italy | |
| Spain | |
| Nordic Countries | |
| Russia | |
| Rest of Europe | |
| South America | Brazil |
| Argentina | |
| Colombia | |
| Middle-East and Africa | Saudi Arabia |
| South Africa | |
| Rest of Middle-East and Africa |
| By Application | Industry Lime | |
| Chemical Lime | ||
| Construction Lime | ||
| Refractory Lime | ||
| By End-User Industry | Paper and Pulp | |
| Water Treatment | ||
| Agriculture | ||
| Plastics | ||
| Building and Construction | ||
| Steel Manufacturing and Other Industries (Including Energy) | ||
| Other End-user Industries | ||
| By Geography | Asia-Pacific | China |
| India | ||
| Japan | ||
| South Korea | ||
| ASEAN | ||
| Rest of Asia-Pacific | ||
| North America | United States | |
| Canada | ||
| Mexico | ||
| Europe | Germany | |
| United Kingdom | ||
| France | ||
| Italy | ||
| Spain | ||
| Nordic Countries | ||
| Russia | ||
| Rest of Europe | ||
| South America | Brazil | |
| Argentina | ||
| Colombia | ||
| Middle-East and Africa | Saudi Arabia | |
| South Africa | ||
| Rest of Middle-East and Africa | ||


Key Questions Answered in the Report
What is the current global volume for limestone?
The limestone market size measured 5.58 billion tons in 2026.
How fast is global demand growing?
Aggregate demand is projected to rise at a 3.76% CAGR through 2031.
Which application consumes the most limestone?
Industrial lime for steel and environmental services captured 65.92% of 2025 volume.
Why does Asia-Pacific dominate consumption?
Rapid infrastructure builds and steel-intensive renewable-energy projects give the region a 71.62% share of global demand.
How do carbon taxes affect limestone producers?
Process-emission costs from lime kilns expose operators in carbon-pricing regions to 15-25% higher production expenses, favoring plants with capture technology.
What strategic moves are leading companies making?
Firms such as UltraTech and Heidelberg Materials are acquiring quarry assets to secure long-term reserves and integrate downstream processing.
Page last updated on:


