Market Overview
| Study Period | 2020 - 2031 |
|---|---|
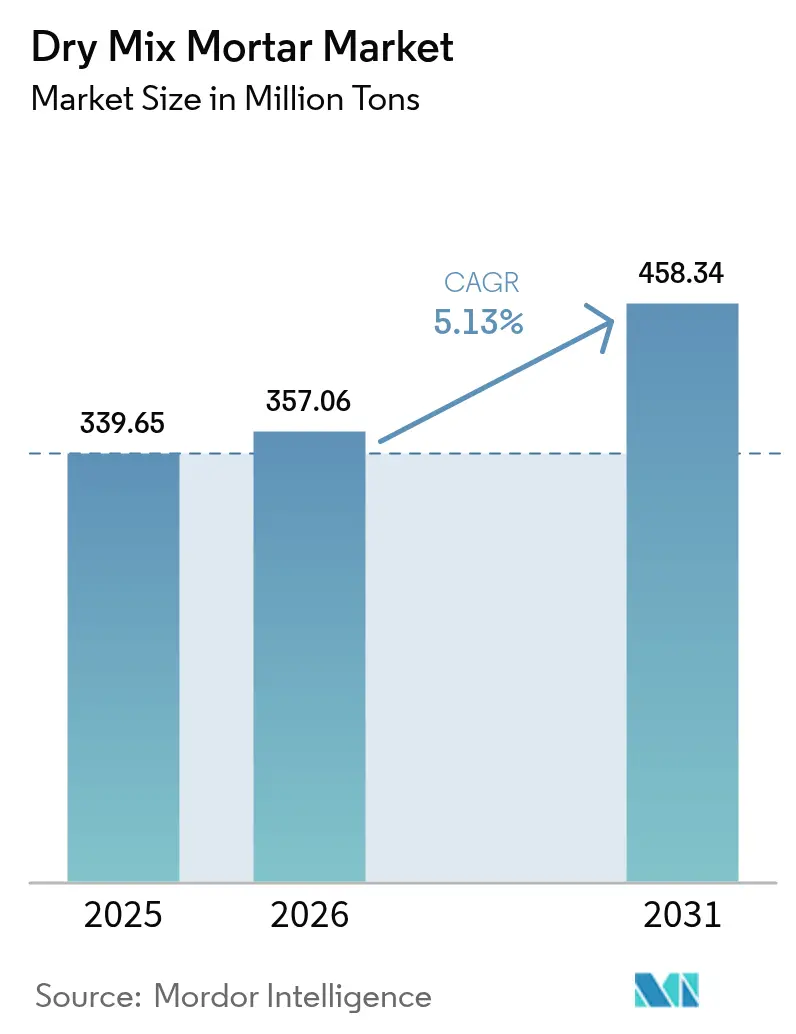
| Market Volume (2026) | 357.06 Million Tons |
| Market Volume (2031) | 458.34 Million Tons |
| Growth Rate (2026 - 2031) | 5.13% CAGR |
| Fastest Growing Market | Asia Pacific |
| Largest Market | Asia-Pacific |
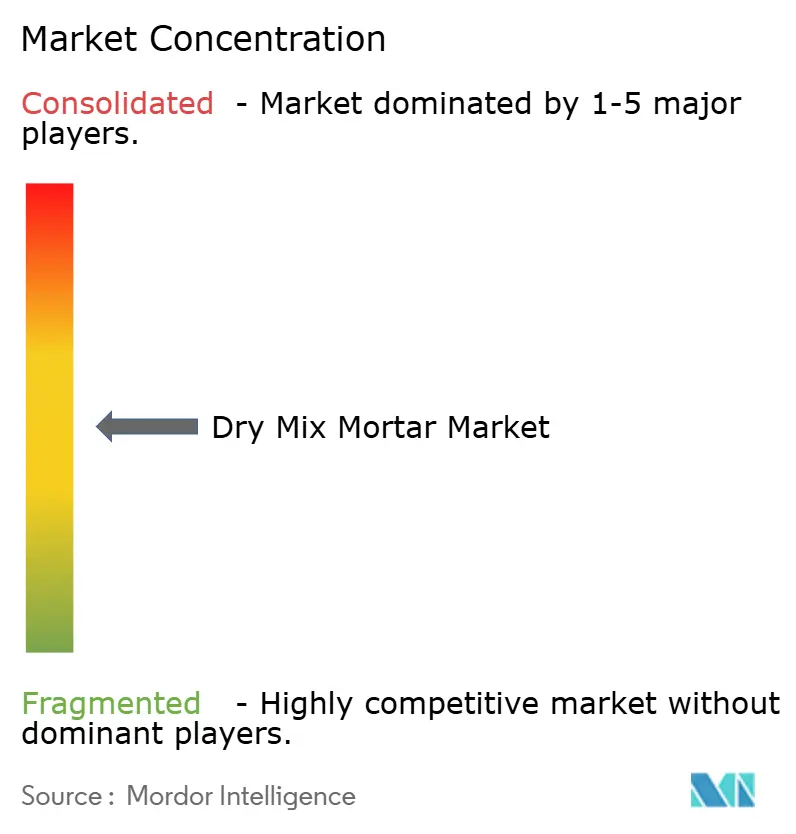
| Market Concentration | Medium |
Major Players *Disclaimer: Major Players sorted in no particular order Image © Mordor Intelligence. Reuse requires attribution under CC BY 4.0. | |
Dry Mix Mortar Market Analysis by Mordor Intelligence
The Dry Mix Mortar Market size is expected to grow from 339.65 million tons in 2025 to 357.06 million tons in 2026 and is forecast to reach 458.34 million tons by 2031 at 5.13% CAGR over 2026-2031. Persistently high urbanization rates, mandatory pre-mixed mortar policies in several Asian countries, and contractors’ need to shorten project schedules underpin this expansion. Factory-produced formulations minimize on-site variability, improve quality consistency, and reduce labor requirements, advantages that resonate strongly in regions facing skilled-worker shortages. Segmental demand is also shifting toward value-added blends such as tile adhesives, EIFS mortars, and renovation compounds that deliver higher productivity or energy-saving functionality. Consolidation among leading manufacturers continues as they secure raw material supplies and invest in automated production lines that cut operating costs and reduce carbon intensity. At the same time, volatile cement and additive prices, as well as the significant capital required for state-of-the-art plants, temper the overall growth outlook.
Key Report Takeaways
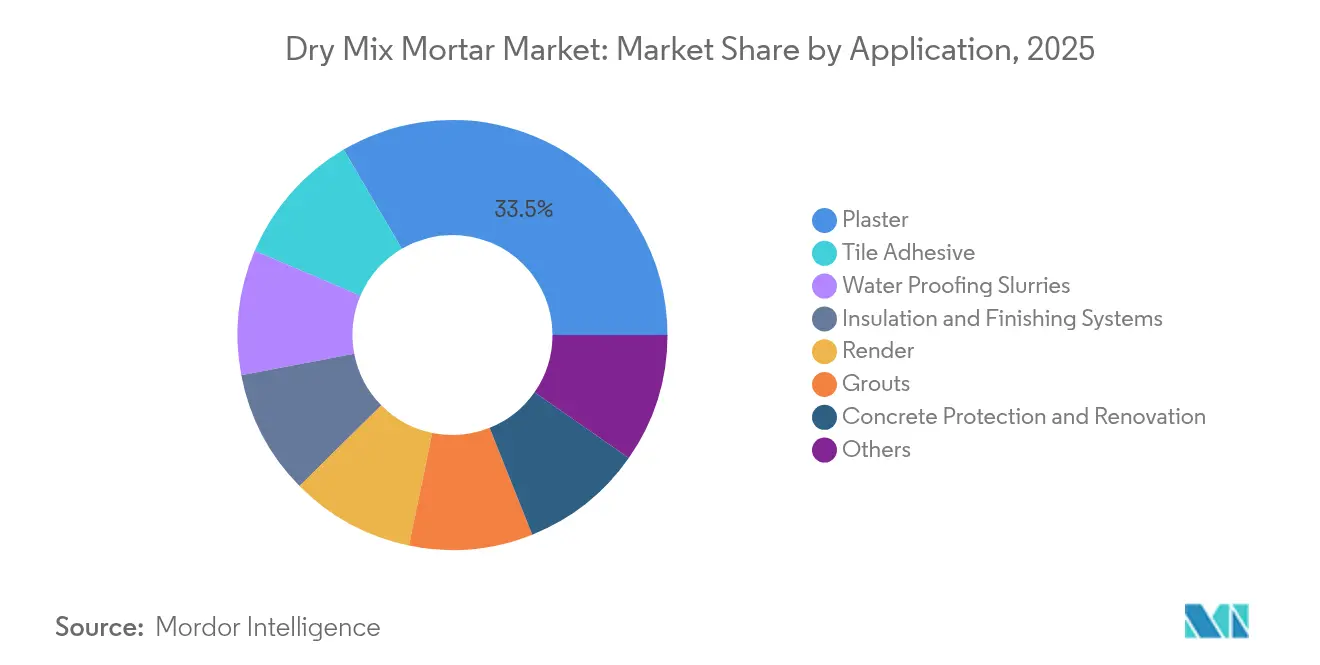
- By application, plaster led with a 33.45% share of the dry mix mortar market in 2025; tile adhesive is projected to post a 6.35% CAGR through 2031.
- By end-use sector, the residential segment held 55.60% of the dry mix mortar market share in 2025, while commercial construction is projected to expand at a 5.17% CAGR through 2031.
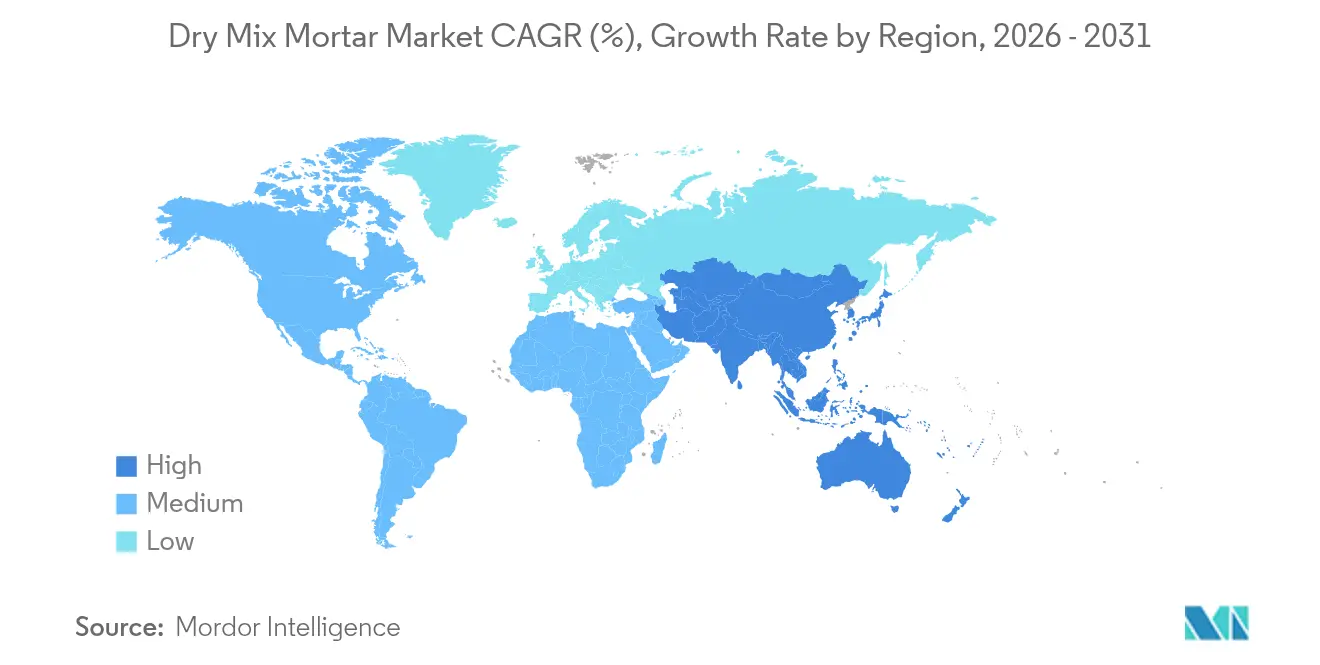
- By geography, the Asia-Pacific region commanded 46.80% of the revenue in 2025; it is forecasted to grow at a 5.32% CAGR through 2031.
Note: Market size and forecast figures in this report are generated using Mordor Intelligence’s proprietary estimation framework, updated with the latest available data and insights as of 2026.
Global Dry Mix Mortar Market Trends and Insights
Drivers Impact Analysis*
| Drivers | (~) % Impact on CAGR Forecast | Geographic Relevance | Impact Timeline |
|---|---|---|---|
| Rapid urbanization and infrastructure outlay in Asia-Pacific | +1.8% | Asia-Pacific core, spill-over to MEA | Long term (≥ 4 years) |
| Energy-efficient building codes – demand for EIFS and insulation mortars | +1.2% | Global, with early gains in Europe, North America | Medium term (2-4 years) |
| Labour shortages driving ready-to-use pre-mixed solutions | +0.9% | North America and EU, expanding to APAC | Short term (≤ 2 years) |
| Smart-job-site adoption of RFID-linked silo dosing | +0.6% | Global, concentrated in developed markets | Medium term (2-4 years) |
| 3-D concrete printing using mortar-based printable mixes | +0.4% | Global, pilot projects in US, EU, China | Long term (≥ 4 years) |
| Source: Mordor Intelligence | |||


Rapid Urbanization and Infrastructure Outlay in Asia-Pacific
China’s urbanization rate reached 68% in 2025, resulting in steady demand for mortar in residential renovations and infrastructure upgrades. High-speed rail expansion is driving an increase in specialized mortar consumption, as thin-layer products gain traction in prefabricated segments. Government infrastructure budgets in Thailand and Vietnam are sustaining double-digit construction spending, encouraging local producers to boost capacity and replace imported volumes. The region’s incremental use of fly ash and slag lowers production costs and addresses environmental mandates. Together, these elements contribute significantly to the long-term growth of the dry mix mortar market.
Energy-Efficient Building Codes – Demand for EIFS and Insulation Mortars
Tighter thermal-performance regulations raise demand for mortars that bond and coat insulation boards in EIFS systems. The European Union’s Carbon Border Adjustment Mechanism imposes charges on high-emission imports, prompting local sourcing of low-carbon mortars. China’s new autoclaved aerated concrete standard increased compressive-strength metrics, prompting builders to adopt compatible high-adhesion mixes. Digital quality-monitoring prototypes, such as the DigiCoPro system, highlight the shift toward sensor-enabled mortars that track curing conditions and ensure optimal performance. Revised ISO 13007:2025 benchmarks and China’s stricter certification rules formalize these higher requirements, supporting specialty-mortar uptake in multiple regions[1]“Digital monitoring system can make concrete work more reliable, safer and economical,” TechXplore, techxplore.com .
Labor Shortages Driving Ready-to-Use Pre-Mixed Solutions
Construction employment constraints in North America and parts of Europe spur contractors to embrace mortars that are 4-12 times faster to apply than on-site mixes. Simplified formulations with extended working times are also gaining acceptance in emerging markets where trained applicators are scarce. Producers channeled capital spending into automated lines that cut manual handling and enhance product uniformity. Rising B2B e-commerce penetration enables direct shipping from plants to job sites, reducing distribution layers and manual offloading. These dynamics collectively raise the appeal of factory-produced materials across all major regions.
Smart-Job-Site Adoption of RFID-Linked Silo Dosing
Connected silos equipped with RFID readers accurately meter out mortar volumes and transmit usage data, thereby reducing waste and preventing stockouts. IoT sensors that log temperature and humidity further optimize on-site curing, trimming rework rates. Patent submissions related to automated binder technology increased in 2025, indicating robust research and development activity. Logistics platforms now integrate route-optimization algorithms that reduce fuel spend and shorten delivery windows, dovetailing with contractors’ just-in-time scheduling. The convergence of these digital tools enhances operating efficiency and solidifies demand for compatible, pre-mixed products.
Restraints Impact Analysis*
| Restraints | (~) % Impact on CAGR Forecast | Geographic Relevance | Impact Timeline |
|---|---|---|---|
| Raw-material (cement and additive) price volatility | -1.1% | Global, acute in commodity-dependent regions | Short term (≤ 2 years) |
| High capex for automated dry-mix plants | -0.7% | Global, concentrated in emerging markets | Medium term (2-4 years) |
| Shortage of skilled applicators in emerging economies | -0.5% | APAC emerging, MEA, Latin America | Long term (≥ 4 years) |
| Source: Mordor Intelligence | |||
Raw-Material Price Volatility
Cement input costs fluctuated considerably in 2024, while river-sand prices fell, producing margin swings that small-scale manufacturers struggle to absorb. Producers respond by increasing industrial-waste substitution rates; however, these alternatives often require additional processing and stricter quality controls. Regional carbon pricing further compounds variability. Supply disruptions tied to trade disputes and additive shortages aggravate the challenge, forcing frequent price revisions that strain customer relations.
High Capex for Automated Dry-Mix Plants
Modern continuous-mix plants require capital outlays of tens of millions of RMB, a hurdle for small and mid-sized entrants. Regulatory pressure for dust and VOC controls inflates retrofit budgets, while the need for trained technicians raises indirect costs. Limited financing options in parts of Southeast Asia and Africa prolong payback periods to beyond seven years, curbing the adoption of advanced equipment. As a result, plant modernization progresses slowly outside leading multinational and state-owned operators.
*Our forecasts treat driver/restraint impacts as directional, not additive. The impact forecasts reflect baseline growth, mix effects, and variable interactions.
Segment Analysis
By Application: Tile Adhesive Drives Premium Growth
Tile adhesive holds the fastest trajectory within the dry mix mortar market, growing at a 6.35% CAGR through 2031, driven by the sales of ceramic tiles. Large-format tiles require high-performance bonding agents with extended open times, and off-site panelization in prefabricated schemes amplifies the demand for controlled-viscosity products. In contrast, plaster maintains the largest volume base at 33.45% in 2025, due to its ubiquity across both structural and finishing layers. Render and grouts capture incremental volume from renovation of kitchens and bathrooms in urban housing stock, while waterproofing slurries find niche uptake in coastal infrastructure facing elevated moisture stress. Insulation-compatible mortars align with energy-code upgrades, bundling thermal and structural performance.
The dry mix mortar market size tied to tile adhesive is projected to surge as new housing starts pivot toward premium interior finishes. Commercial flooring contractors cite lower rework rates and quicker turnaround as key benefits, justifying price premiums. Manufacturers differentiate via polymer-modified formulations that resist efflorescence and accommodate substrate movement. The plaster sub-segment remains price-competitive, with growth largely tracking floor-space additions. Specialist providers, meanwhile, focus on composite-layer systems where a single brand can supply adhesive, grout, and waterproofing components to capture higher lifecycle value.


By End-Use Sector: Commercial Acceleration Outpaces Residential Stability
Commercial construction is expected to post a 5.17% growth pace through 2031, surpassing the broader market and increasing the dry mix mortar market share of premium blends used in high-specification office, retail, and institutional projects. Developers favor ready-mix mortars that enhance schedule certainty, particularly in multi-trade fit-outs where sequencing is critical. Energy-efficient retrofits in public buildings also stimulate demand for insulation and renovation mortars. In contrast, the residential sector retained a 55.60% volume share in 2025 and is expected to advance steadily alongside urban household formation, sustained renovation cycles, and government-backed affordable housing schemes.
Industrial and infrastructure demand adds further support. The expansion of logistics hubs and factory floors utilizes fast-setting screeds and dust-suppressed floor toppings, while high-speed rail corridors rely on sulfate-resistant grouts and anchoring mortars. Contractors deploying precast elements in bridges and stations favor thin-layer bonding compounds that speed assembly. These trends broaden product mix and allow suppliers to market technical support services, bolstering revenue beyond commodity volumes.

Geography Analysis
The Asia-Pacific region continued to dominate the dry mix mortar market in 2025, accounting for 46.80% of the global volume, and is forecast to expand at a 5.32% CAGR through 2031. Chinese regulations mandating the use of pre-mixed mortar in new buildings, coupled with ongoing urban renewal, sustain the momentum in demand. Southeast Asian governments are pushing transport and energy projects, which reinforces volume growth while localizing production to reduce imports.
North America is expected to post moderate growth, anchored by infrastructure bills and a rebound in commercial interiors. Persistent skilled-labor constraints heighten the appetite for bucketed or silo-fed mortars that streamline wall assemblies. Domestic producers continue adding regional depots to offset a drop in Chinese imports triggered by trade barriers. Canada’s residential starts and Mexico’s industrial build-outs stabilize regional consumption, with cross-border supply chains ensuring a steady flow of materials.
Europe retains a sizeable base fueled by stringent energy regulations and accelerated refurbishments of aging building stock. The Carbon Border Adjustment Mechanism effectively rewards local low-carbon mortars, giving regional producers a cost advantage versus importers. Standardization of fly-ash-blended mixes gains traction across Germany, France, and the Nordics. South America shows promise, particularly in Brazil, where rail and metro projects are adopting specialty grouts, while the Middle East and Africa benefit from construction chemicals expenditure tied to large-scale housing and tourism developments.

Competitive Landscape
The dry mix mortar market remains moderately fragmented. Automation is a core investment theme. Most of 2024's capital expenditures were allocated to robotic bagging, inline mixing, and enclosed-silo systems, which reduce dust emissions and improve batch consistency. Sika AG inaugurated a mortar production facility in Singapore[2]Sika AG, “Sika opens new mortar production plant in Singapore,” sika.com. Patent filings related to binder chemistry and IoT-enabled dispensing increased, indicating active product innovation. Regional challengers concentrate on niche applications and quick responsiveness. Producers in Southeast Asia and the Gulf Cooperation Council offer turnkey installation packages, bundling product supply with on-site training and support. European mid-caps specialize in lime-based heritage mortars that meet conservation codes. While price competition persists in commodity plaster blends, differentiation through performance additives, digital job-site services, and cradle-to-grave carbon disclosures is deepening.
Dry Mix Mortar Industry Leaders
Saint-Gobain
Sika AG
HANIL HOLDINGS CO., LTD.
SCG International Corporation
Ardex Group
- *Disclaimer: Major Players sorted in no particular order

Recent Industry Developments
- January 2025: Sika AG inaugurated a mortar production facility in Singapore. This strategic development enables Sika to better address local market demands while significantly reducing logistical distances. The establishment of an advanced plant by Sika strengthens its position in the dry mix mortar market by enhancing supply chain efficiency and driving regional growth.
- August 2024: Sika AG significantly increased the production capacity at its Bekasi plant, the largest manufacturing facility in Indonesia. Located near Jakarta, the capital city, this site specializes in the production of mortar mix for the mortar market and enhances it. This expansion is expected to strengthen Sika AG's market presence, drive growth in the dry mix mortar market, and improve supply chain efficiency.


Global Dry Mix Mortar Market Report Scope
Commercial, Industrial and Institutional, Infrastructure, Residential are covered as segments by End Use Sector. Concrete Protection and Renovation, Grouts, Insulation and Finishing Systems, Plaster, Render, Tile Adhesive, Water Proofing Slurries are covered as segments by Application. Asia-Pacific, Europe, Middle East and Africa, North America, South America are covered as segments by Region.By Application
| Plaster |
| Render |
| Tile Adhesive |
| Grouts |
| Water Proofing Slurries |
| Concrete Protection and Renovation |
| Insulation and Finishing Systems |
| Others |
By End-use Sector
| Commercial |
| Industrial and Institutional |
| Infrastructure |
| Residential |
By Geography
| Asia-Pacific | China |
| India | |
| Japan | |
| South Korea | |
| Indonesia | |
| Malaysia | |
| Thailand | |
| Vietnam | |
| Rest of Asia-Pacific | |
| North America | United States |
| Canada | |
| Mexico | |
| Europe | France |
| Germany | |
| Italy | |
| Russia | |
| Spain | |
| United Kingdom | |
| Rest of Europe | |
| South America | Brazil |
| Argentina | |
| Rest of South America | |
| Middle-East and Africa | Saudi Arabia |
| South Africa | |
| Rest of Middle-East and Africa |
| By Application | Plaster | |
| Render | ||
| Tile Adhesive | ||
| Grouts | ||
| Water Proofing Slurries | ||
| Concrete Protection and Renovation | ||
| Insulation and Finishing Systems | ||
| Others | ||
| By End-use Sector | Commercial | |
| Industrial and Institutional | ||
| Infrastructure | ||
| Residential | ||
| By Geography | Asia-Pacific | China |
| India | ||
| Japan | ||
| South Korea | ||
| Indonesia | ||
| Malaysia | ||
| Thailand | ||
| Vietnam | ||
| Rest of Asia-Pacific | ||
| North America | United States | |
| Canada | ||
| Mexico | ||
| Europe | France | |
| Germany | ||
| Italy | ||
| Russia | ||
| Spain | ||
| United Kingdom | ||
| Rest of Europe | ||
| South America | Brazil | |
| Argentina | ||
| Rest of South America | ||
| Middle-East and Africa | Saudi Arabia | |
| South Africa | ||
| Rest of Middle-East and Africa | ||


Market Definition
- END-USE SECTOR - Dry mix mortar consumed in the construction sectors such as commercial, residential, industrial, institutional, and infrastructure are considered under the scope of the study.
- PRODUCT/APPLICATION - Under the scope of the study, consumption of dry mix mortar products for plaster, render, tile adhesive, grouts, waterproofing slurries, concrete protection and renovation, insulated and finishing systems along with other applications are considered.
| Keyword | Definition |
|---|---|
| Accelerator | Accelerators are admixtures used to fasten the setting time of concrete by increasing the initial rate and speeding up the chemical reaction between cement and the mixing water. These are used to harden and increase the strength of concrete quickly. |
| Acrylic | This synthetic resin is a derivative of acrylic acid. It forms a smooth surface and is mainly used for various indoor applications. The material can also be used for outdoor applications with a special formulation. |
| Adhesives | Adhesives are bonding agents used to join materials by gluing. Adhesives can be used in construction for many applications, such as carpet laying, ceramic tiles, countertop lamination, etc. |
| Air Entraining Admixture | Air-entraining admixtures are used to improve the performance and durability of concrete. Once added, they create uniformly distributed small air bubbles to impart enhanced properties to the fresh and hardened concrete. |
| Alkyd | Alkyds are used in solvent-based paints such as construction and automotive paints, traffic paints, flooring resins, protective coatings for concrete, etc. Alkyd resins are formed by the reaction of an oil (fatty acid), a polyunsaturated alcohol (Polyol), and a polyunsaturated acid or anhydride. |
| Anchors and Grouts | Anchors and grouts are construction chemicals that stabilize and improve the strength and durability of foundations and structures like buildings, bridges, dams, etc. |
| Cementitious Fixing | Cementitious fixing is a process in which a cement-based grout is pumped under pressure to fill forms, voids, and cracks. It can be used in several settings, including bridges, marine applications, dams, and rock anchors. |
| Commercial Construction | Commercial construction comprises new construction of warehouses, malls, shops, offices, hotels, restaurants, cinemas, theatres, etc. |
| Concrete Admixtures | Concrete admixtures comprise water reducers, air entrainers, retarders, accelerators, superplasticizers, etc., added to concrete before or during mixing to modify its properties. |
| Concrete Protective Coatings | To provide specific protection, such as anti-carbonation or chemical resistance, a film-forming protective coat can be applied on the surface. Depending on the applications, different resins like epoxy, polyurethane, and acrylic can be used for concrete protective coatings. |
| Curing Compounds | Curing compounds are used to cure the surface of concrete structures, including columns, beams, slabs, and others. These curing compounds keep the moisture inside the concrete to give maximum strength and durability. |
| Epoxy | Epoxy is known for its strong adhesive qualities, making it a versatile product in many industries. It resists heat and chemical applications, making it an ideal product for anyone needing a stronghold under pressure. It is widely used in adhesives, electrical and electronics, paints, etc. |
| Fiber Wrapping Systems | Fiber Wrapping Systems are a part of construction repair and rehabilitation chemicals. It involves the strengthening of existing structures by wrapping structural members like beams and columns with glass or carbon fiber sheets. |
| Flooring Resins | Flooring resins are synthetic materials applied to floors to enhance their appearance, increase their resistance to wear and tear or provide protection from chemicals, moisture, and stains. Depending on the desired properties and the specific application, flooring resins are available in distinct types, such as epoxy, polyurethane, and acrylic. |
| High-Range Water Reducer (Super Plasticizer) | High-range water reducers are a type of concrete admixture that provides enhanced and improved properties when added to concrete. These are also called superplasticizers and are used to decrease the water-to-cement ratio in concrete. |
| Hot Melt Adhesives | Hot-melt adhesives are thermoplastic bonding materials applied as melts that achieve a solid state and resultant strength on cooling. They are commonly used for packaging, coatings, sanitary products, and tapes. |
| Industrial and Institutional Construction | Industrial and institutional construction includes new construction of hospitals, schools, manufacturing units, energy and power plants, etc. |
| Infrastructure Construction | Infrastructure construction includes new construction of railways, roads, seaways, airports, bridges, highways, etc. |
| Injection Grouting | The process of injecting grout into open joints, cracks, voids, or honeycombs in concrete or masonry structural members is known as injection grouting. It offers several benefits, such as strengthening a structure and preventing water infiltration. |
| Liquid-Applied Waterproofing Membranes | Liquid-Applied membrane is a monolithic, fully bonded, liquid-based coating suitable for many waterproofing applications. The coating cures to form a rubber-like elastomeric waterproof membrane and may be applied over many substrates, including asphalt, bitumen, and concrete. |
| Micro-concrete Mortars | Micro-concrete mortar is made up of cement, water-based resin, additives, mineral pigments, and polymers and can be applied on both horizontal and vertical surfaces. It can be used to refurbish residential complexes, commercial spaces, etc. |
| Modified Mortars | Modified Mortars include Portland cement and sand along with latex/polymer additives. The additives increase adhesion, strength, and shock resistance while also reducing water absorption. |
| Mold Release Agents | Mold release agents are sprayed or coated on the surface of molds to prevent a substrate from bonding to a molding surface. Several types of mold release agents, including silicone, lubricant, wax, fluorocarbons, and others, are used based on the type of substrates, including metals, steel, wood, rubber, plastic, and others. |
| Polyaspartic | Polyaspartic is a subset of polyurea. Polyaspartic floor coatings are typically two-part systems that consist of a resin and a catalyst to ease the curing process. It offers high durability and can withstand harsh environments. |
| Polyurethane | Polyurethane is a plastic material that exists in various forms. It can be tailored to be either rigid or flexible and is the material of choice for a broad range of end-user applications, such as adhesives, coatings, building insulation, etc. |
| Reactive Adhesives | A reactive adhesive is made of monomers that react in the adhesive curing process and do not evaporate from the film during use. Instead, these volatile components become chemically incorporated into the adhesive. |
| Rebar Protectors | In concrete structures, rebar is one of the important components, and its deterioration due to corrosion is a major issue that affects the safety, durability, and life span of buildings and structures. For this reason, rebar protectors are used to protect against degrading effects, especially in infrastructure and industrial construction. |
| Repair and Rehabilitation Chemicals | Repair and Rehabilitation Chemicals include repair mortars, injection grouting materials, fiber wrapping systems, micro-concrete mortars, etc., used to repair and restore existing buildings and structures. |
| Residential Construction | Residential construction involves constructing new houses or spaces like condominiums, villas, and landed homes. |
| Resin Fixing | The process of using resins like epoxy and polyurethane for grouting applications is called resin fixing. Resin fixing offers several advantages, such as high compressive and tensile strength, negligible shrinkage, and greater chemical resistance compared to cementitious fixing. |
| Retarder | Retarders are admixtures used to slow down the setting time of concrete. These are usually added with a dosage rate of around 0.2% -0.6% by weight of cement. These admixtures slow down hydration or lower the rate at which water penetrates the cement particles by making concrete workable for a long time. |
| Sealants | A sealant is a viscous material that has little or no flow qualities, which causes it to remain on surfaces where they are applied. Sealants can also be thinner, enabling penetration to a certain substance through capillary action. |
| Sheet Waterproofing Membranes | Sheet membrane systems are reliable and durable thermoplastic waterproofing solutions that are used for waterproofing applications even in the most demanding below-ground structures, including those exposed to highly aggressive ground conditions and stress. |
| Shrinkage Reducing Admixture | Shrinkage-reducing admixtures are used to reduce concrete shrinkage, whether from drying or self-desiccation. |
| Silicone | Silicone is a polymer that contains silicon combined with carbon, hydrogen, oxygen, and, in some cases, other elements. It is an inert synthetic compound that comes in various forms, such as oil, rubber, and resin. Due to its heat-resistant properties, it finds applications in sealants, adhesives, lubricants, etc. |
| Solvent-borne Adhesives | Solvent-borne adhesives are mixtures of solvents and thermoplastic or slightly cross-linked polymers such as polychloroprene, polyurethane, acrylic, silicone, and natural and synthetic rubbers. |
| Surface Treatment Chemicals | Surface treatment chemicals are chemicals used to treat concrete surfaces, including roofs, vertical surfaces, and others. They act as curing compounds, demolding agents, rust removers, and others. They are cost-effective and can be used on roadways, pavements, parking lots, and others. |
| Viscosity Modifier | Viscosity Modifiers are concrete admixtures used to change various properties of admixtures, including viscosity, workability, cohesiveness, and others. These are usually added with a dosage of around 0.01% to 0.1% by weight of cement. |
| Water Reducer | Water reducers, also called plasticizers, are a type of admixture used to decrease the water-to-cement ratio in the concrete, thereby increasing the durability and strength of concrete. Various water reducers include refined lignosulfonates, gluconates, hydroxycarboxylic acids, sugar acids, and others. |
| Water-borne Adhesives | Water-borne adhesives use water as a carrier or diluting medium to disperse resin. They are set by allowing the water to evaporate or be absorbed by the substrate. These adhesives are compounded with water as a dilutant rather than a volatile organic solvent. |
| Waterproofing Chemicals | Waterproofing chemicals are designed to protect a surface from the perils of leakage. A waterproofing chemical is a protective coating or primer applied to a structure's roof, retaining walls, or basement. |
| Waterproofing Membranes | Waterproofing membranes are liquid-applied or self-adhering layers of water-tight materials that prevent water from penetrating or damaging a structure when applied to roofs, walls, foundations, basements, bathrooms, and other areas exposed to moisture or water. |


Research Methodology
Mordor Intelligence follows a four-step methodology in all our reports.
- Step-1: Identify Key Variables: The quantifiable key variables (industry and extraneous) pertaining to the specific product segment and country are selected from a group of relevant variables & factors based on desk research & literature review; along with primary expert inputs. These variables are further confirmed through regression modeling (wherever required).
- Step-2: Build a Market Model: In order to build a robust forecasting methodology, the variables and factors identified in Step-1 are tested against available historical market numbers. Through an iterative process, the variables required for market forecast are set and the model is built on the basis of these variables.
- Step-3: Validate and Finalize: In this important step, all market numbers, variables and analyst calls are validated through an extensive network of primary research experts from the market studied. The respondents are selected across levels and functions to generate a holistic picture of the market studied.
- Step-4: Research Outputs: Syndicated Reports, Custom Consulting Assignments, Databases & Subscription Platforms


