Natural Disaster Detection IoT Market Size and Share
Market Overview
| Study Period | 2019 - 2030 |
|---|---|
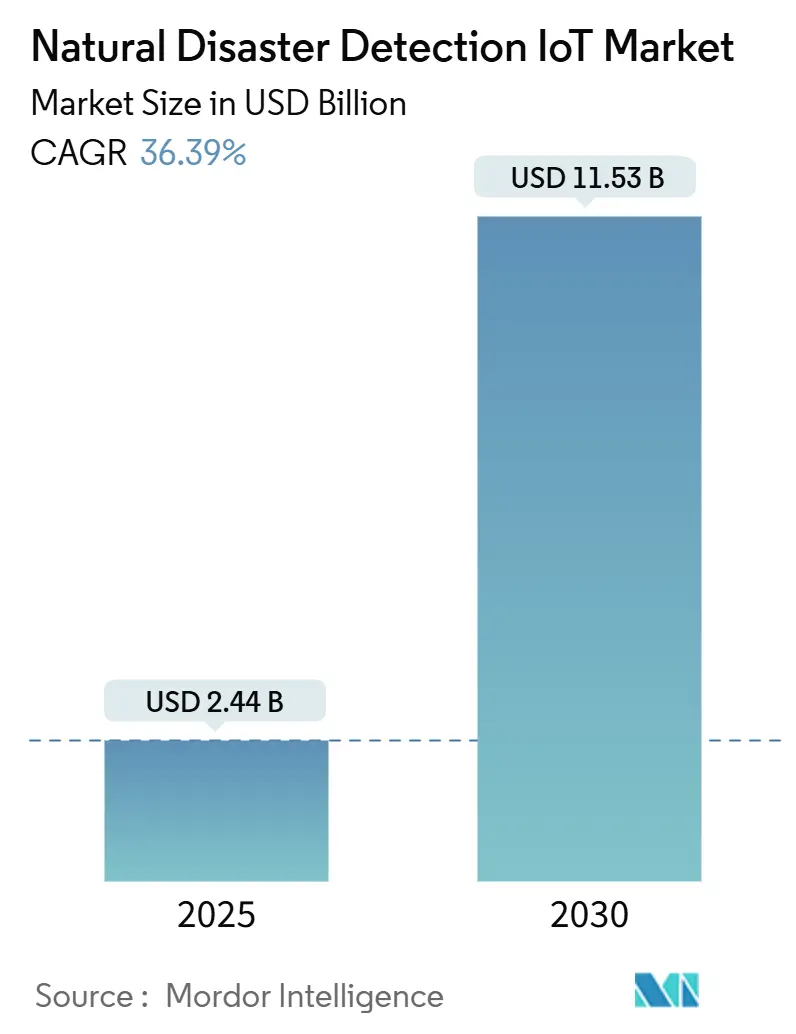
| Market Size (2025) | USD 2.44 Billion |
| Market Size (2030) | USD 11.53 Billion |
| Growth Rate (2025 - 2030) | 36.39% CAGR |
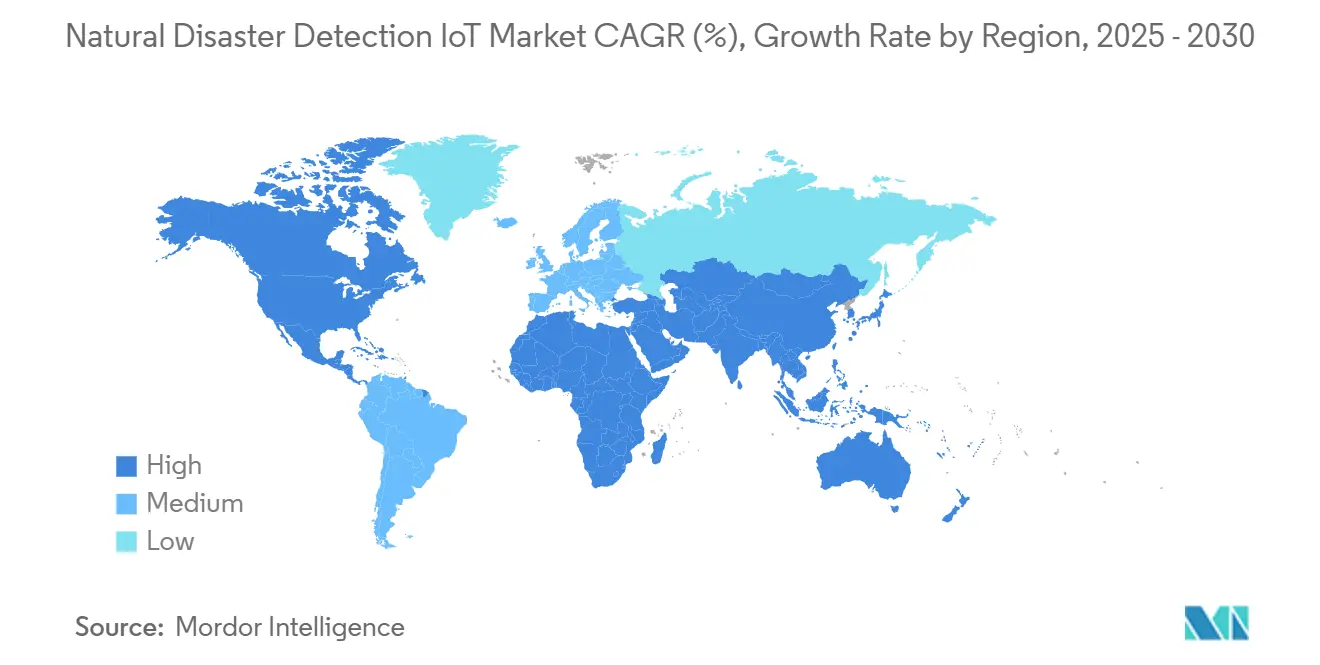
| Fastest Growing Market | Asia Pacific |
| Largest Market | North America |
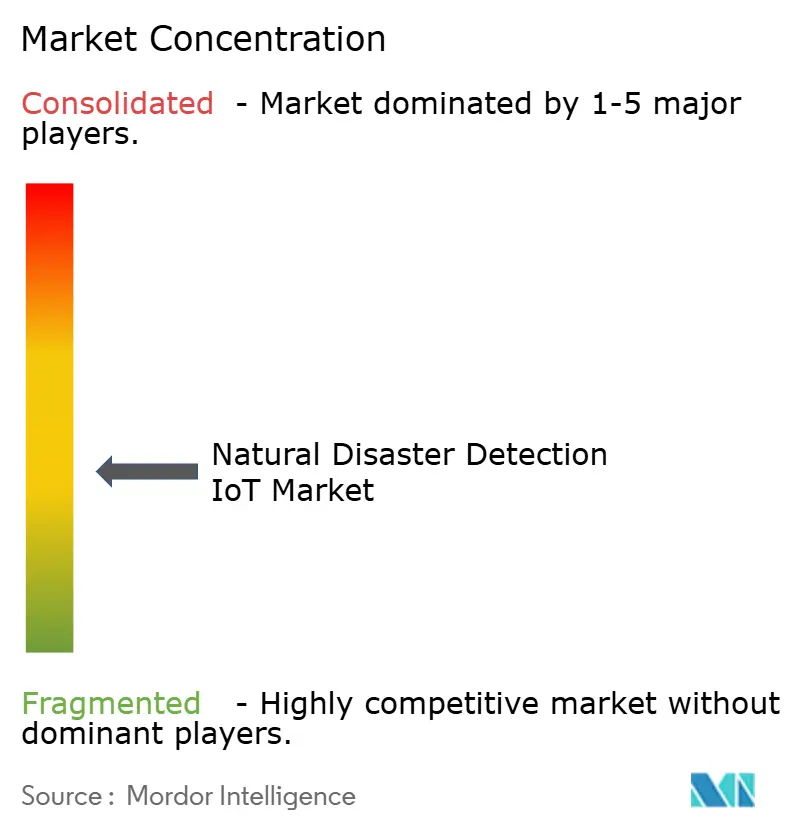
| Market Concentration | Medium |
Major Players *Disclaimer: Major Players sorted in no particular order Image © Mordor Intelligence. Reuse requires attribution under CC BY 4.0. | |
Natural Disaster Detection IoT Market Analysis by Mordor Intelligence
The Natural Disaster Detection IoT market size stands at USD 2.44 billion in 2025 and is forecast to reach USD 11.53 billion by 2030, reflecting a 36.39% CAGR through the period. Rising climate volatility, rapid advances in low-power connectivity, and wider acceptance of AI-based predictive analytics jointly accelerate demand. Public agencies prioritize always-on sensor grids that shift response models from reactive recovery to proactive risk avoidance. Hardware remains capital-intensive, yet cloud-delivered analytics and satellite IoT coverage lower entry barriers for smaller municipalities. Competitive rivalry centers on integrated platforms that fuse sensing, connectivity, and parametric-insurance data streams to deliver verifiable financial outcomes.
Key Report Takeaways
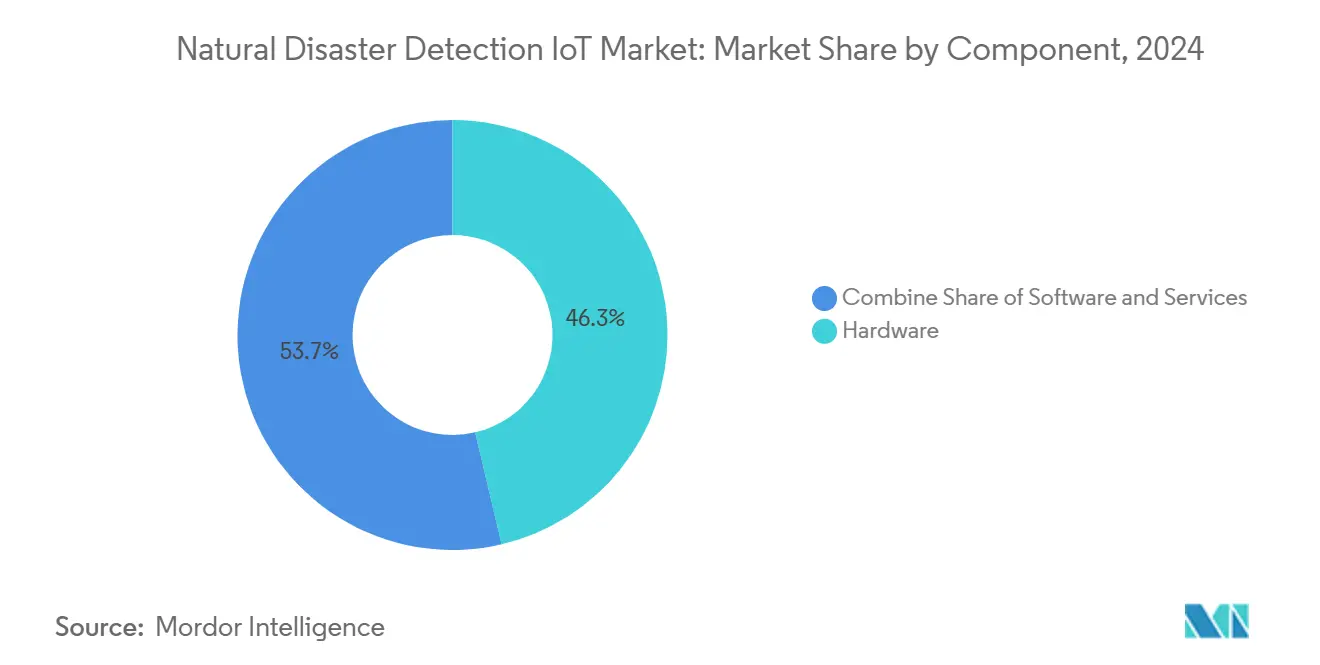
- By component, hardware captured 46.34% of Natural Disaster Detection IoT market share in 2024, while services are expanding at a 38.23% CAGR to 2030
- By disaster type, flood monitoring accounted for 31.23% of the Natural Disaster Detection IoT market size in 2024, and wildfire detection is growing at 39.55% CAGR to 2030.
- By sensor technology, weather sensors held 28.96% revenue share in 2024; optical/infrared imaging is forecast to grow at 40.12% CAGR between 2025-2030.
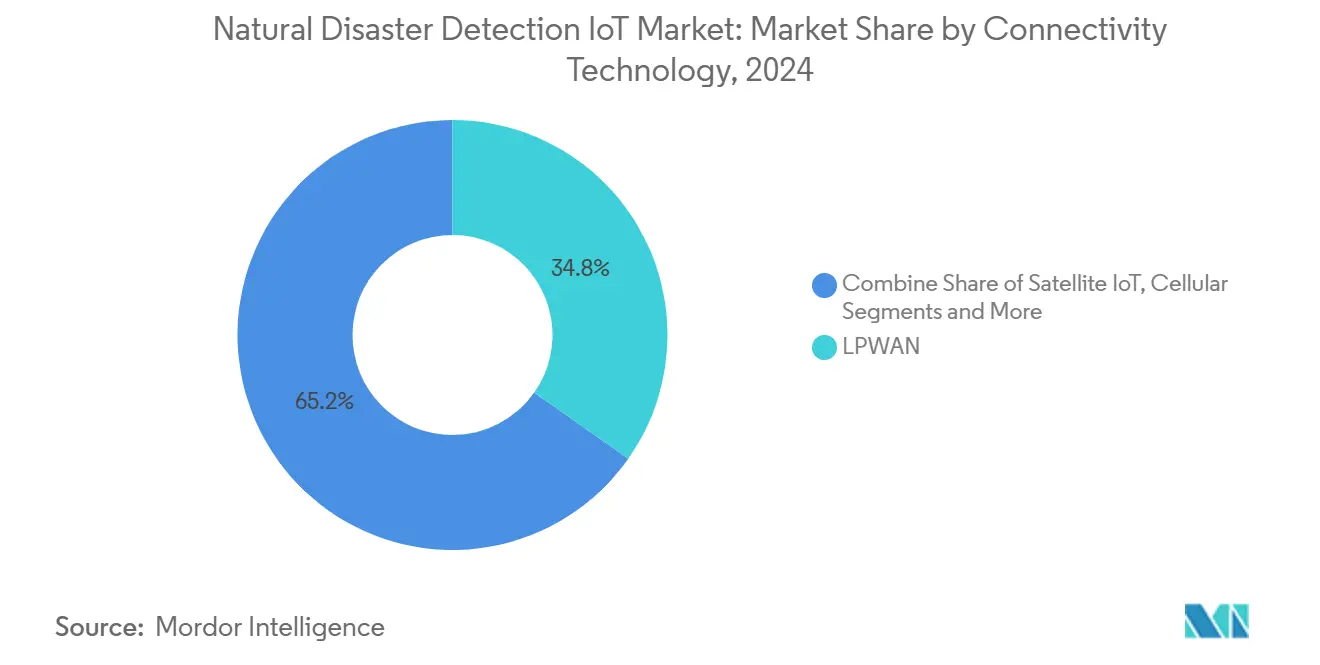
- By connectivity technology, LPWAN held 34.76% revenue share in 2024; satellite IoT connectivity is forecast to grow at 39.64% CAGR between 2025-2030.
- By end user, government and public safety agencies monitoring accounted for 41.37% of the Natural Disaster Detection IoT market size in 2024, and Satellite IoT (LEO/MEO) is growing at 41.45% CAGR to 2030.
- By geography, North America led with 39.64% revenue contribution in 2024; Asia-Pacific is advancing at a 40.11% CAGR through 2030.
Global Natural Disaster Detection IoT Market Trends and Insights
Drivers Impact Analysis*
| Driver | (~) % Impact on CAGR Forecast | Geographic Relevance | Impact Timeline |
|---|---|---|---|
| Rising climate disaster losses | +8.2% | Global, Asia-Pacific focus | Long term (≥ 4 years) |
| Government smart-city funding | +7.8% | North America, EU, Asia-Pacific | Medium term (2-4 years) |
| LPWAN and 5G cost decline | +6.4% | Global | Short term (≤ 2 years) |
| Parametric insurance adoption | +5.1% | North America, EU, Asia-Pacific | Medium term (2-4 years) |
| Satellite IoT coverage expansion | +4.9% | Global remote areas | Long term (≥ 4 years) |
| Source: Mordor Intelligence | |||
Rising frequency and economic losses from climate disasters
Insured natural catastrophe losses exceeded USD 100 billion in 2024, motivating public and private actors to prioritize early warning networks that lower recovery bills. [1]U.S. Department of Homeland Security, “Emergency Management of Tomorrow Research,” dhs.gov Supply-chain disruptions from weather extremes further amplify the business case as real-time IoT data underpins continuity plans. Wildfire programs demonstrate the value of sub-minute ignition alerts that cut property damage and save lives.The economic multiplier of avoided loss underpins sustained investment in scalable sensor nodes and analytics engines.
Government mandates and smart-city funding for early warning
Federal initiatives such as the U.S. Emergency Management of Tomorrow program stipulate IoT integration within municipal operations. [2]Drew Willey, “Can I Sue Kerr County…,” Willey Law Firm, law-dw.com In China, smart emergency pilots across 10 provinces show measurable response-time improvements once multi-hazard sensor grids become operational. International standard bodies like ISO and ITU endorse unified frameworks that ease cross-border cooperation.
LPWAN and 5G cost reduction
Component prices for LoRaWAN gateways and devices continue to fall; autonomous nodes now operate for years on harvested ambient light, cutting maintenance charges. Hybrid LPWAN-5G deployments lower connectivity spend by up to 30% while adding redundancy for mission-critical alerts.
Parametric insurance linked to IoT triggers
The parametric insurance market reached USD 14.8 billion in 2023 and depends on verified sensor measurements to automate payouts. Programs covering 85,000 Filipino farmers rely on satellite rainfall data to initiate immediate indemnity, illustrating the virtuous cycle between insurance demand and sensor density.
Restraints Impact Analysis*
| Restraint | (~) % Impact on CAGR Forecast | Geographic Relevance | Impact Timeline |
|---|---|---|---|
| High CAPEX and maintenance | −4.7% | Developing markets | Short term (≤ 2 years) |
| Interoperability fragmentation | −3.2% | Global | Medium term (2-4 years) |
| Energy-harvesting limits | −2.8% | Harsh zones | Long term (≥ 4 years) |
| Liability risk from false alarms | −2.1% | Developed legal markets | Medium term (2-4 years) |
| Source: Mordor Intelligence | |||
High CAPEX and maintenance of sensor grids
Semiconductor price hikes and scarce advanced nodes add unexpected cost layers to already budget-strained municipalities. Total cost of ownership must also absorb energy harvesting modules, periodic calibration visits, and inevitable hardware refreshes.
Liability risk from false alarms
Wrongful-death suits after the Kerr County, Texas floods illustrate the exposure agencies face when alerts are late or inaccurate. [3]Michael Gruetzmacher, “Parametric: A Complement to Traditional Property Coverage,” Aon, aon.com Conversely, over-sensitive systems that trigger unnecessary evacuations can prompt compensation claims for economic loss, making calibration and validation paramount.
*Our forecasts treat driver/restraint impacts as directional, not additive. The impact forecasts reflect baseline growth, mix effects, and variable interactions.
Segment Analysis
By Component — hardware remains the investment anchor
Hardware accounted for 46.34% of 2024 revenue, underscoring the physical necessity of ruggedized sensors, edge gateways, and power units. Services, however, post a 38.23% CAGR as buyers outsource data hosting, analytics, and maintenance. A shift toward pay-as-you-go contracts reduces upfront liabilities and speeds adoption, especially for small cities. VIAVI’s distributed fiber sensing portfolio shows how next-gen hardware simultaneously advances coverage and lowers lifecycle cost. The Natural Disaster Detection IoT market size for services is forecast to reach USD 5.2 billion by 2030, signaling that value creation increasingly concentrates in analytics and orchestration layers.
The capital intensity of standalone deployments is driving consortium purchasing and shared infrastructure models. As multi-hazard nodes integrate weather, seismic, and infrared modules, per-site costs decline, supporting more granular networks without proportionate spend. Energy-autonomous sensor breakthroughs will further expand the Natural Disaster Detection IoT market by removing battery-related truck rolls in rugged terrain.


By Disaster Type — flood monitoring leads, wildfire systems accelerate
Flood-related products held 31.23% of 2024 revenue as governments protect densely populated river basins. The Natural Disaster Detection IoT market share for floods benefits from mature ultrasonic, radar, and pressure-sensor stacks aligned with hydrological models. Wildfire offerings exhibit the fastest 39.55% CAGR to 2030, powered by infrared imaging, particulate sensors, and AI classification. Satellite and drone imagery fusion now detects ignition within minutes, delivering outsized economic savings in fire-prone California and Australia.
Earthquake monitoring remains essential along the Pacific and Mediterranean fault lines. Japan’s undersea fiber seismic network exemplifies innovation that extends monitoring to ocean trenches. Tsunami, landslide, and avalanche use cases are niche yet vital for high-hazard geographies, introducing specialized ultrasonic and ground-movement sensors that broaden the overall Natural Disaster Detection IoT market.
By Sensor Technology — weather sensors form the baseline
Weather sensors dominated with a 28.96% revenue share in 2024. Their ubiquity makes them the default backbone for multi-risk dashboards. Optical and infrared imaging nodes log the highest 40.12% CAGR, reflecting stronger thermal analytics for early wildfire or volcanic plume detection. The Natural Disaster Detection IoT market size for optical technologies is forecast to exceed USD 3.8 billion by 2030.
Seismic, hydrological, and gas sensors sustain demand within specialized agencies, while integrated multi-hazard nodes reduce installation density and wiring complexity. Energy-harvesting microcontrollers now manage multiple data streams, balancing power budgets while preserving data fidelity
By Connectivity Technology — LPWAN tops volumes, satellites fuel reach
LPWAN captured 34.76% of 2024 spend through favorable cost-per-bit economics and kilometer-scale range. Edge2LoRa architectures add localized processing that slashes backhaul traffic. Satellite IoT capacity grows at 39.64% CAGR, unlocking new revenue in remote watersheds, deserts, and mountainous frontiers. Cellular 4G/5G supports bandwidth-heavy video feeds for field commanders.
Hybrid architectures combining terrestrial and orbital links deliver redundancy that keeps alerts flowing after towers fall. The Natural Disaster Detection IoT market continues to migrate toward multi-connectivity frameworks, ensuring resilience against single-point failures.
By End User — public agencies dominate, insurers scale fastest
Government and public safety entities held 41.37% of 2024 spending because statutory mandates require city-wide coverage. Parametric insurers register the quickest 41.45% CAGR as automated payouts depend on certified sensor data. Smart-city operators deploy combined traffic, lighting, and hazard sensors to raise urban resilience scores. Utilities embed real-time fault detection inside electricity and gas assets to keep lifeline services online during extreme weather.
Agriculture and forestry managers leverage frost, soil moisture, and fire-risk telemetry to protect yield. NGOs increasingly transport portable kits that re-establish situational awareness after storms disrupt terrestrial networks. Collaboration across user groups multiplies sensor density, enlarging the Natural Disaster Detection IoT market.
Geography Analysis
North America held 39.64% of 2024 revenue, buoyed by FEMA and U.S. Geological Survey programs that embed sensors across highways, bridges, and watersheds. ShakeAlert’s rollout to 1,675 seismic stations by the end of 2025 improves earthquake readiness from Washington to California. Cross-border coordination with Canada and Mexico enhances flood and wildfire intelligence along shared basins.
Asia-Pacific expands at a 40.11% CAGR through 2030. China scales smart emergency infrastructure across pilot provinces, delivering double-digit reductions in response times. Japan integrates SAR satellites and AI dashboards that broadcast real-time volcanic and tsunami alerts nationwide. India’s 100-city smart-city program includes IoT flood sensors and landslide monitors, accelerating the Natural Disaster Detection IoT market across South Asia.
Europe maintains steady gains as EU Civil Protection policies require interoperable data platforms among member states. Projects along the Rhine and Danube implement synchronized sensor arrays that feed joint situational centers. The Middle East and Africa see rising adoption around drought-stricken Sahel and flood-prone Nile tributaries, often funded by multilateral climate-adaptation grants. South America concentrates spend in Brazil where agribusiness IoT networks track soil moisture, wildfire threats, and storm cells to safeguard export crops.

Competitive Landscape
The Natural Disaster Detection IoT market is moderately fragmented. IBM applies AI to predict heat and wildfire outbreaks while bundling cloud analytics and consulting. Cisco offers resilient mesh gateways that self-heal after power outages. Motorola Solutions integrates body-worn cameras and radios for unified field awareness. Honeywell merges 5G-enabled meters with utility analytics, bolstering grid stability during storms.
Satellite innovators like Viasat, Spire, and Astroscale partner with sensor OEMs to guarantee coverage inside communications dead zones. Start-ups focus on energy-autonomous edge nodes and AI classifiers that trim false positives. Strategic collaborations span hardware, cloud, and insurance sectors, aiming to deliver turnkey early-warning-as-a-service. No single vendor commands more than 10% revenue, supporting a healthy pipeline of niche innovators that enrich the ecosystem.
Natural Disaster Detection IoT Industry Leaders
International Business Machines Corporation (IBM)
Cisco Systems, Inc.
Motorola Solutions, Inc.
Honeywell International Inc.
Trimble Inc.
- *Disclaimer: Major Players sorted in no particular order

Recent Industry Developments
- July 2025: Senseway Inc. won Tokyo SME Center recognition for Worker Connect, a LoRaWAN/LTE-M wearable that enforces new heat-stroke regulations.
- June 2025: U.S. Geological Survey detailed Grand Canyon River Alert System using satellite messengers to warn rafters of flash floods.
- April 2025: Motorola Solutions launched SVX and Assist to merge voice, video, and AI for frontline responders.
- April 2025: SEALSQ announced quantum-resistant microcontrollers that harden smart-grid IoT against environmental threats.


Global Natural Disaster Detection IoT Market Report Scope
| Hardware |
| Platform / Software |
| Services |
| Earthquake |
| Flood |
| Wildfire |
| Hurricane and Typhoon |
| Landslide and Avalanche |
| Tsunami |
| Volcanic Activity |
| Seismic Sensors |
| Hydrological Sensors |
| Weather Sensors |
| Gas and Air Quality Sensors |
| Optical / Infrared Imaging |
| GNSS and InSAR Sensors |
| Multi-Hazard Integrated Nodes |
| Cellular (4G/5G) |
| LPWAN (LoRaWAN, Sigfox) |
| Satellite IoT (LEO/MEO) |
| Short-Range Mesh (Zigbee/BLE) |
| Hybrid Edge-Cloud Architectures |
| Government and Public Safety Agencies |
| Smart City Operators and Municipalities |
| Utilities and Critical Infrastructure Owners |
| Agriculture and Forestry Management |
| Insurance Providers |
| NGOs and Humanitarian Organizations |
| Early-Warning Service Providers |
| North America | United States | |
| Canada | ||
| Mexico | ||
| Europe | Germany | |
| United Kingdom | ||
| France | ||
| Italy | ||
| Spain | ||
| Netherlands | ||
| Russia | ||
| Rest of Europe | ||
| Asia-Pacific | China | |
| Japan | ||
| India | ||
| South Korea | ||
| Australia and New Zealand | ||
| ASEAN | ||
| Rest of Asia-Pacific | ||
| Middle East and Africa | Middle East | Saudi Arabia |
| United Arab Emirates | ||
| Turkey | ||
| Rest of Middle East | ||
| Africa | South Africa | |
| Nigeria | ||
| Egypt | ||
| Rest of Africa | ||
| South America | Brazil | |
| Argentina | ||
| Rest of South America | ||
| By Component | Hardware | ||
| Platform / Software | |||
| Services | |||
| By Disaster Type | Earthquake | ||
| Flood | |||
| Wildfire | |||
| Hurricane and Typhoon | |||
| Landslide and Avalanche | |||
| Tsunami | |||
| Volcanic Activity | |||
| By Sensor Technology | Seismic Sensors | ||
| Hydrological Sensors | |||
| Weather Sensors | |||
| Gas and Air Quality Sensors | |||
| Optical / Infrared Imaging | |||
| GNSS and InSAR Sensors | |||
| Multi-Hazard Integrated Nodes | |||
| By Connectivity Technology | Cellular (4G/5G) | ||
| LPWAN (LoRaWAN, Sigfox) | |||
| Satellite IoT (LEO/MEO) | |||
| Short-Range Mesh (Zigbee/BLE) | |||
| Hybrid Edge-Cloud Architectures | |||
| By End User | Government and Public Safety Agencies | ||
| Smart City Operators and Municipalities | |||
| Utilities and Critical Infrastructure Owners | |||
| Agriculture and Forestry Management | |||
| Insurance Providers | |||
| NGOs and Humanitarian Organizations | |||
| Early-Warning Service Providers | |||
| By Geography | North America | United States | |
| Canada | |||
| Mexico | |||
| Europe | Germany | ||
| United Kingdom | |||
| France | |||
| Italy | |||
| Spain | |||
| Netherlands | |||
| Russia | |||
| Rest of Europe | |||
| Asia-Pacific | China | ||
| Japan | |||
| India | |||
| South Korea | |||
| Australia and New Zealand | |||
| ASEAN | |||
| Rest of Asia-Pacific | |||
| Middle East and Africa | Middle East | Saudi Arabia | |
| United Arab Emirates | |||
| Turkey | |||
| Rest of Middle East | |||
| Africa | South Africa | ||
| Nigeria | |||
| Egypt | |||
| Rest of Africa | |||
| South America | Brazil | ||
| Argentina | |||
| Rest of South America | |||


Key Questions Answered in the Report
What is the current value of Natural Disaster Detection IoT solutions and how quickly will it expand?
Spending reaches USD 2.44 billion in 2025 and is forecast to climb to USD 11.53 billion by 2030, reflecting a 36.39% CAGR.
Which region is growing fastest for Natural Disaster Detection IoT deployments and what drives the trend?
Asia-Pacific posts the highest 40.11% CAGR through 2030, propelled by rapid urbanization, high climate exposure, and government-funded smart-city programs in China, Japan, and India.
How are services influencing adoption compared with hardware purchases?
While hardware still captures the largest 2024 revenue share, managed services expand at a 38.23% CAGR because municipalities prefer subscription analytics that avoid heavy upfront sensor ownership costs.
Which connectivity options suit remote or infrastructure-poor hazard zones?
Hybrid architectures that pair LPWAN gateways with emerging low-earth-orbit satellite links dominate remote monitoring because they balance ultra-low power draw with global coverage redundancy.
Why is parametric insurance important to Natural Disaster Detection IoT rollouts?
Automated payouts tied to verified sensor triggers lower financial risk for agriculture, utilities, and municipalities, creating a funding channel that directly supports dense, always-on sensor networks.
Which technology providers currently shape competitive dynamics?
IBM, Cisco, Motorola Solutions, Honeywell, and satellite specialists such as Viasat and Spire influence the space by integrating sensing hardware, AI analytics, and multi-network connectivity into turnkey early-warning platforms.
Page last updated on:


