
Market Overview
| Study Period | 2020 - 2031 |
|---|---|
| Market Size (2026) | USD 11.66 Billion |
| Market Size (2031) | USD 47.33 Billion |
| Growth Rate (2026 - 2031) | 32.35 % |
| Fastest Growing Market | Asia Pacific |
| Largest Market | North America |
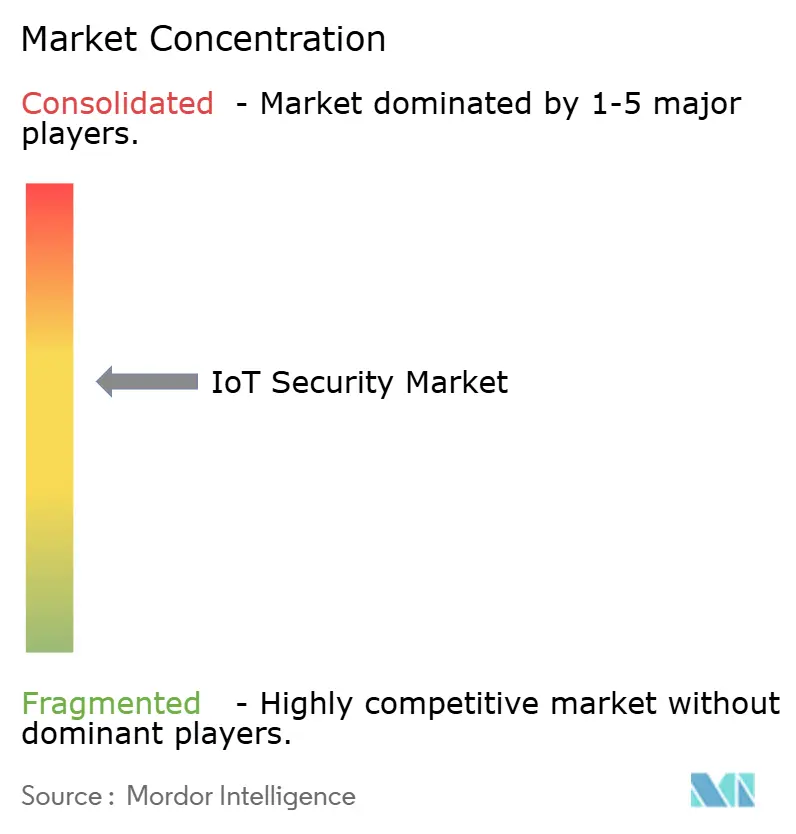
| Market Concentration | Medium |
Major Players *Disclaimer: Major Players sorted in no particular order Image © Mordor Intelligence. Reuse requires attribution under CC BY 4.0. | |
IoT Security Market Analysis by Mordor Intelligence
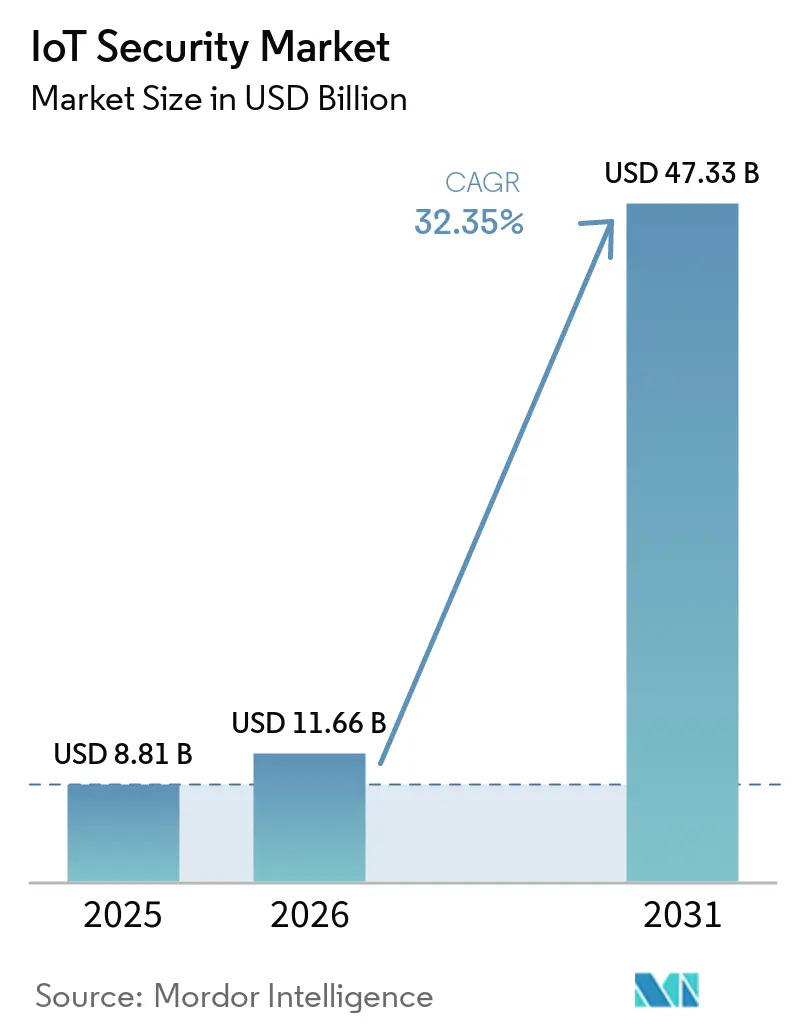
IoT Security Market size in 2026 is estimated at USD 11.66 billion, growing from 2025 value of USD 8.81 billion with 2031 projections showing USD 47.33 billion, growing at 32.35% CAGR over 2026-2031.
Enterprises are accelerating spending because regulators now mandate security-by-design for every connected product, operational technology is converging with IT networks, and AI analytics deliver real-time detection across massive device fleets. The United Kingdom’s Product Security and Telecommunications Infrastructure Act and the European Union’s Cyber Resilience Act have transformed security from a best practice into a legal requirement, diverting budgets from discretionary projects to mandatory compliance. Perimeter-centric defenses retain priority as millions of unmanaged endpoints widen attack surfaces, yet the move toward cloud-delivered controls is reshaping procurement criteria. Vendor differentiation increasingly depends on evidence of automated, standards-aligned protection that scales from factory floors to remote edge nodes.
Key Report Takeaways
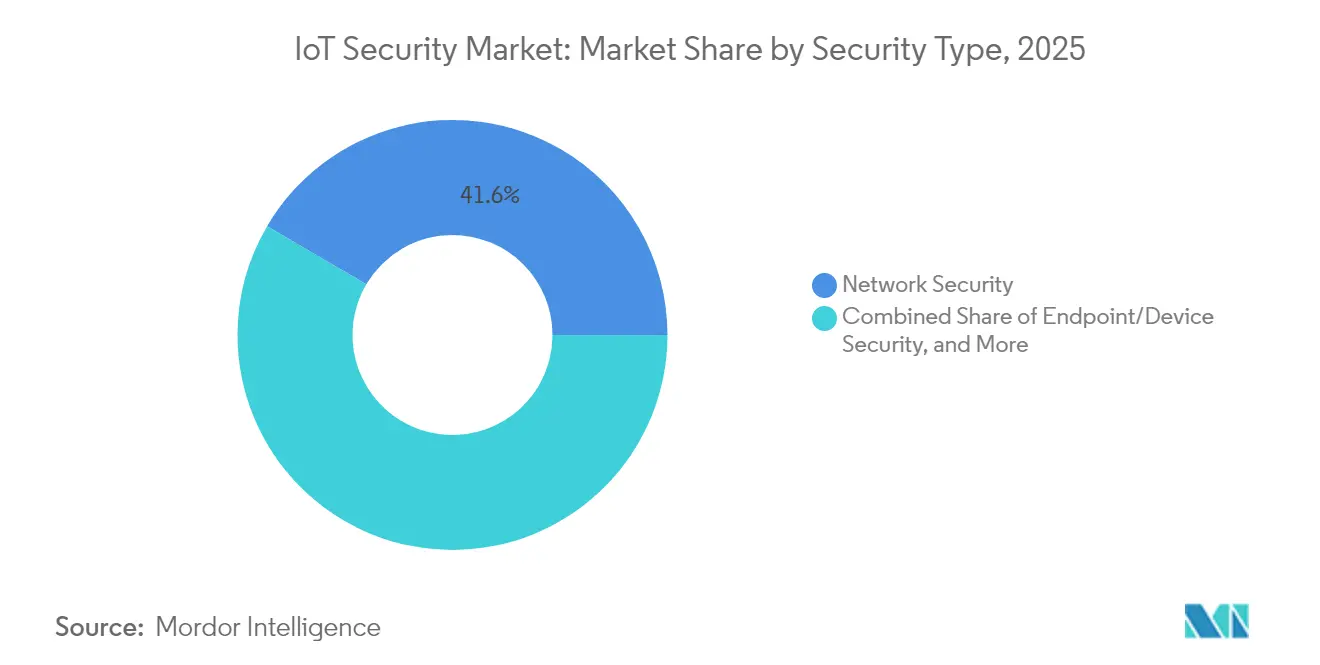
- By security type, Network Security held 41.55% of the IoT security market share in 2025, while Cloud/Virtual Security is poised for a 34.38% CAGR through 2031.
- By component, Solutions led with a 57.35% share of the IoT security market size in 2025; Services are tracking a 35.02% CAGR to 2031.
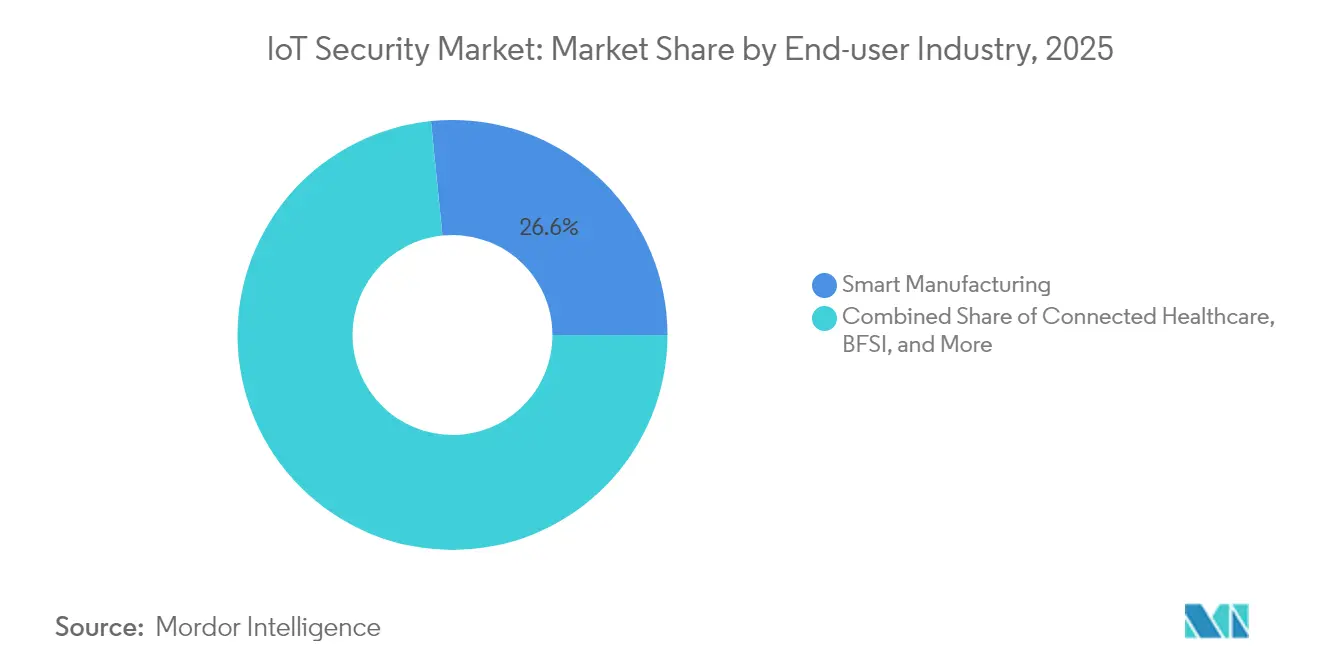
- By end-user, Smart Manufacturing commanded 26.60% of the IoT security market in 2025; Energy & Utilities is projected to grow at 32.75% CAGR.
- By deployment mode, Cloud/SECaaS captured 45.40% of the IoT security market in 2025, with Hybrid Edge deployments forecast for 33.15% CAGR.
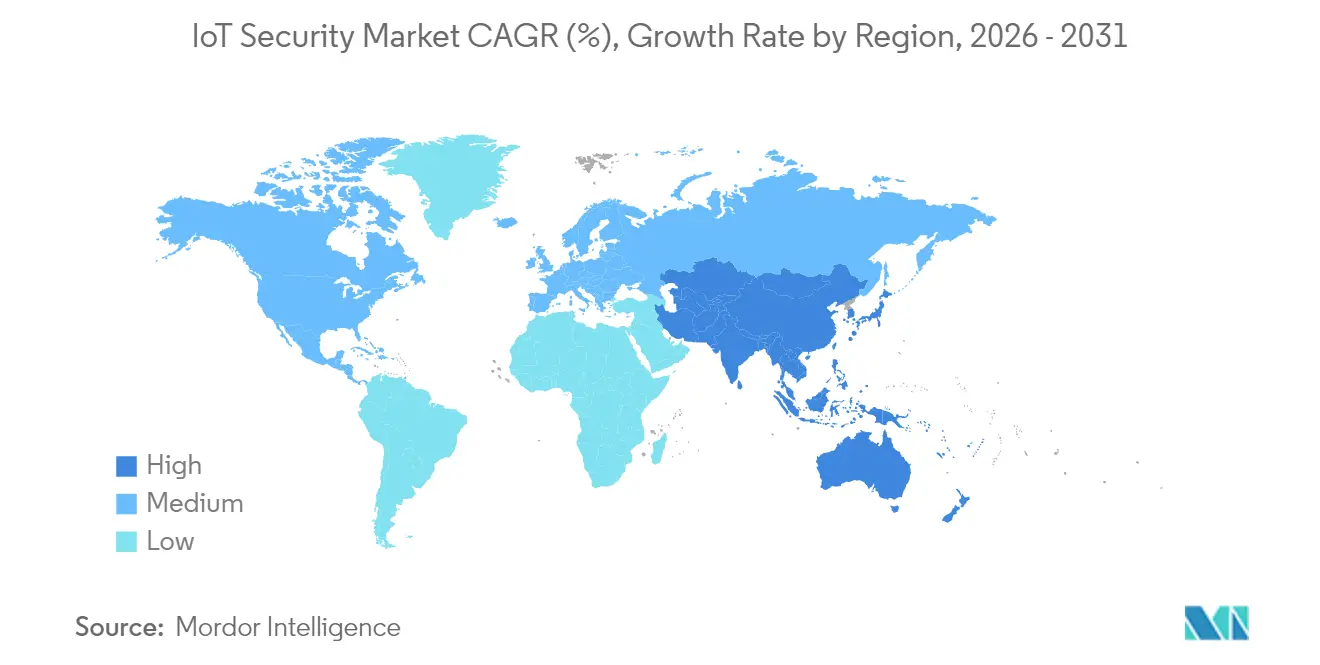
- By region, North America accounted for 34.70% of 2025 revenue, while Asia Pacific is forecast to increase at a 34.25% CAGR to 2031.
Note: Market size and forecast figures in this report are generated using Mordor Intelligence’s proprietary estimation framework, updated with the latest available data and insights as of 2026.
Market Trends and Insights
Drivers Impact Analysis of IoT Security Market*
| Driver | (~) % Impact on CAGR Forecast | Geographic Relevance | Impact Timeline |
|---|---|---|---|
| Data-breach-led regulatory scrutiny | +8.20% | Global, early adoption in the EU & North America | Medium term (2-4 years) |
| Convergence of OT + IT security stacks | +7.50% | North America & EU manufacturing hubs, expanding to APAC | Long term (≥ 4 years) |
| Shift-left product-design mandates | +6.80% | Global, led by EU compliance | Medium term (2-4 years) |
| AI-powered adaptive threat analytics | +5.90% | North America & EU early adopters, APAC following | Short term (≤ 2 years) |
| Secure IoT demand in critical industries | +4.80% | Global, focus on healthcare, energy, and manufacturing | Medium term (2-4 years) |
| Satellite NB-IoT roll-out for remote assets | +4.10% | Global, rural, and maritime use cases | Long term (≥ 4 years) |
| Source: Mordor Intelligence | |||
Data-breach-led Regulatory Scrutiny
Regulators moved from voluntary guidelines to punitive enforcement, exemplified by the EU Cyber Resilience Act that can impose EUR 15 million penalties for non-compliant devices entering the bloc. The United Kingdom’s PSTI Act, effective April 2024, bans default passwords and mandates defined update windows, forcing manufacturers to redesign firmware pipelines[1]Parliament of the United Kingdom, “Product Security and Telecommunications Infrastructure Act 2022,” legislation.gov.uk. Consumer-facing labels introduced by the US Federal Communications Commission in 2024 allow buyers to compare security maturity, shifting competitive advantage toward compliant vendors. High-profile incidents, such as the March 2025 cyberattack that exposed 5.5 million Yale New Haven Health patient records, illustrate regulatory urgency and intensify oversight. Tier-one assemblers now obligate component suppliers to hold third-party certifications, raising entry barriers for firms lacking documented secure-development processes.
Convergence of OT + IT Security Stacks
Operational technology networks that once ran in isolation now connect to corporate clouds to support predictive maintenance and analytics. Ransomware targeting the IT-OT interface surged 84% during Q1 2025 in North American plants, prompting unified visibility mandates in procurement documents. Legacy industrial protocols such as Modbus and DNP3 require security tools that understand deterministic traffic and strict latency thresholds, pushing vendors to integrate deep packet inspection tailored for factory environments. Cisco’s security revenue more than doubled in its Q2 FY2025 results as customers consolidated on converged networking and security platforms. Implementation complexity has triggered demand for professional services that can migrate brown-field plants without prolonged downtime. As converged deployments mature, chief information security officers seek solutions that correlate anomalies across process controllers, corporate laptops, and remote maintenance links from a single console.
Shift-left Product-design Mandates
Security-by-design obligations embedded in the EU Cyber Resilience Act push threat modeling and vulnerability scanning into the earliest phases of engineering. Product teams must now document how encryption keys are stored and how software-bill-of-materials data will be published before prototypes leave the lab, extending development cycles yet lowering post-launch remediation spend. Patent applications for embedded security spiked in 2024 as large vendors filed for blockchain-based data authenticity systems and secure-element chipsets meant for low-cost sensors. Smaller manufacturers often struggle to fund new secure-development life cycles, leading to consolidation or outsourcing to design-for-security consultancies. Investors reward firms that demonstrate certified processes under standards such as ETSI EN 303 645, creating a market premium for compliance credentials. Over the medium term, device ecosystems that cannot document continuous update support risk exclusion from major retail and telecom channels.
AI-powered Adaptive Threat Analytics
Machine-learning detection engines now compare behavioral baselines across millions of devices, flagging anomalous traffic within milliseconds and auto-isolating suspicious nodes. A 2024 peer-reviewed study reported 99.52% accuracy in identifying malicious packets in IoT traffic using graph neural networks. Edge deployments in autonomous vehicles and smart manufacturing lines rely on these low-latency models because routing data to cloud logging services would breach timing constraints. Vendors such as Palo Alto Networks reported 43% growth in annual recurring revenue for AI-enhanced security subscriptions in fiscal 2025. Hardware makers respond with low-power AI accelerators tuned for cryptographic workloads to overcome battery and thermal limits. Enterprises value AI engines that self-tune signatures, shrinking mean time to detect even as device populations expand into the tens of millions.
Restraints Impact Analysis of IoT Security Market*
| Restraint | (~) % Impact on CAGR Forecast | Geographic Relevance | Impact Timeline |
|---|---|---|---|
| Fragmented firmware update ecosystem | -4.70% | Global, legacy deployments | Medium term (2-4 years) |
| Legacy brownfield device refresh lag | -3.90% | North America & EU industrial facilities | Long term (≥ 4 years) |
| Shortage of IoT-specific cyber-talent | -3.20% | Global, acute in APAC | Short term (≤ 2 years) |
| Edge compute power limits for encryption | -2.80% | Global, battery-powered assets | Medium term (2-4 years) |
| Source: Mordor Intelligence | |||
Fragmented Firmware-Update Ecosystem
Analysis of 53,000 firmware images across common microcontrollers showed 99.43% stored in plaintext, offering attackers direct access to boot loaders and secrets[2]USENIX, “SoK: Firmware Security Gaps,” usenix.org. Only one-third of vendors maintain an automated over-the-air update pipeline, leaving outdated components unpatched for an average of 1.34 years. EU rules now force automatic updates, compelling redesigns of remote-flash processes. Industrial operators hesitate because downtime for updates can cost hundreds of thousands of USD per hour, so unpatched assets persist inside critical infrastructure. The result is a widening security debt that slows the adoption of advanced authentication frameworks.
Legacy Brownfield Device Refresh Lag
Millions of programmable logic controllers and remote terminal units, installed years before cybersecurity gained attention, cannot accept signed firmware or modern encryption. Replacement can exceed USD 3 million per production line, including recertification under safety standards, causing CFOs to defer upgrades. Vendors respond with network-based micro-segmentation and anomaly detection that surround rather than modify legacy devices, but these overlays add complexity and cost. The challenge is acute in energy utilities, where substation equipment has 30-year service lives yet now faces nation-state-grade intrusion attempts. Over time, asset-owner boards may consider cyber risk in comparable terms to physical safety but refresh hesitancy will remain a growth headwind during the next investment cycle.
*Our forecasts treat driver/restraint impacts as directional, not additive. The impact forecasts reflect baseline growth, mix effects, and variable interactions.
IoT Security Market Segment Analysis
By Security Type:
Network Perimeters Anchor Defense StrategiesNetwork Security generated 41.55% of IoT security market revenue in 2025, driven by enterprises that still treat the network edge as the only uniformly controllable enforcement point. Firewall, micro-segmentation, and secure SD-WAN policies restrict east-west traffic among heterogeneous endpoints that often lack chip-level safeguards. As production lines connect legacy programmable logic controllers to analytics clouds, inspection engines now parse industrial protocols alongside standard IP, demanding specialized threat-intel feeds for IIoT security. Adoption also benefits from the FCC rule requiring vendors to illustrate cloud-enabled update paths, nudging buyers toward providers that integrate firewall and proxy telemetry to verify patch status.
Cloud/Virtual Security is projected for a 34.38% CAGR through 2031 as platforms shift to security-as-a-service. Elastic capacity aligns with bursts from massive firmware-update pushes or backhaul from video sensors. Enterprises balance latency by keeping enforcement near the device while forwarding logs to centrally hosted analytics for correlated anomaly detection. Lightweight cipher suites such as LEA consume 30% less energy than AES-128, allowing real-time encryption even in coin-cell-powered tags. Vendors that fuse cloud policy engines with local enforcement agents are poised to capture additional IoT security market share once 5G RedCap widens bandwidth on factory floors.



By Component:
Services Acceleration Outpaces Solution DeploymentSolutions retained a 57.35% share of the IoT security market size in 2025, spanning encryption libraries, identity platforms, and runtime anomaly detection agents packaged into device SDKs. Pre-certified stacks shorten compliance audits under ETSI EN 303 645 or ISO 27400, so buyers still allocate budget to software licenses that tick regulatory checklists. However, Services, especially managed detection and response, will rise at a 35.02% CAGR because talent shortages push operators to outsource 24×7 monitoring.
Professional consulting demand climbed after the EU began a phased enforcement of the Cyber Resilience Act in January 2025, forcing manufacturers to document supply-chain risk assessments before product launch. Managed Security Services Providers centralize tooling and share threat intel across customers, giving midsize utilities access to capabilities once reserved for global brands. As SOC teams integrate AI co-pilots that triage alerts, service margins expand even while headcount stays flat, reinforcing the structural shift from product sales to recurring revenue models.
By End-user Industry:
Manufacturing Dominance Faces Energy Sector ChallengeSmart Manufacturing contributed 26.60% of 2025 revenue as downtime-averse plants invested heavily after a wave of ransomware forced multiple eight-figure production shutdowns. Factories deploy zero-trust overlays to isolate robotic cells and use time-sensitive networking to authenticate controller commands, protecting daily outputs valued at millions of USD.
Energy & Utilities, forecast for a 32.75% CAGR through 2031, accelerates spending on substation intrusion detection and secure SCADA gateways. European regulators flagged rooftop solar inverters as cascade-failure risks, compelling grid operators to harden edge nodes. Micro-segmentation around distributed generation assets coupled with quantum-safe key exchange trials positions the vertical to outpace manufacturing growth rates. Sector-specific certifications such as IEC 62443-3-3 require proof of defense-in-depth across generation, transmission, and distribution, steering contracts to vendors offering specialized reference architectures.
By Deployment Mode:
Cloud Migration Accelerates Edge Security AdoptionCloud/SECaaS captured 45.40% of IoT security market revenue in 2025 as organizations embraced subscription models that provide continuous update pipelines and pooled threat-intel analytics. Regulatory pressure for lifetime patch support aligns naturally with multitenant architectures that can push fixes within hours rather than staging on-premises rollouts.
Hybrid Edge is positioned for a 33.15% CAGR because latency-sensitive applications in autonomous mobile robots and tele-surgery cannot round-trip every packet to distant data centers. Edge nodes run containerized inference to block anomalies locally, while the cloud hosts model training and policy orchestration. Patent counts for edge-native hardware security modules doubled in 2024, reflecting investment in processors capable of accelerating zero-knowledge attestation without draining battery budgets. Over time, air-gapped installations will adopt private 5G and dedicated MEC servers to merge the benefits of both deployment extremes.
Geography Analysis
North America IoT Security Market
North America retained 34.70% of global revenue in 2025, anchored by federal initiatives such as the FCC labeling scheme that favor vendors prepared to document secure-update mechanisms. Enterprises adopted AI-enabled analytics early, leveraging extensive cloud infrastructure and mature SOC staffing. The Department of Homeland Security specifically names foreign intrusions into critical infrastructure as a top risk, driving federal grants toward water-utility and pipeline monitoring pilots. Canada mirrors the US approach, while Mexico’s near-shoring boom requires integrated security across cross-border logistics hubs. Startups cluster around Silicon Valley and Austin, funneling patented firmware-integrity and post-quantum crypto solutions into Fortune 500 supply chains.
APAC IoT Security Market
Asia Pacific is the fastest-growing territory, forecast for 34.25% CAGR, propelled by aggressive smart-city rollouts and massive consumer IoT adoption. China reported 2.57 billion connected terminals by August 2024, stretching local operators’ capacity to authenticate traffic and block botnet activity. Japan’s Ministry of Internal Affairs and Communications issued secure smart-city guidelines in 2024, catalysing municipal procurements that embed zero-trust from the outset. South Korea’s 6G research includes quantum-resistant key exchange for IoT endpoints, positioning domestic vendors to capture export contracts once standards stabilize. Governments in Indonesia and Vietnam now bundle cyber-hygiene audits into manufacturing incentives, compelling foreign investors to purchase certified security platforms.
Europe IoT Security Market
Europe leverages regulatory pull rather than raw volume. The Cyber Resilience Act obliges every connected product sold in the bloc to document threat modeling, vulnerability disclosure, and lifelong update policies. Manufacturers outside Europe comply to avoid market exclusion, exporting the regulation’s influence worldwide. The United Kingdom’s PSTI Act removes default passwords from consumer electronics shelves, enhancing baseline resilience. Germany’s Industrie 4.0 projects emphasize deterministic networking secured by IEC 62443 controls, while France’s metropolitan data platforms require end-to-end encryption between edge gateways and centralized analytics. Funding from the EU’s Digital Europe Programme subsidizes SME adoption of certified security stacks, broadening the addressable market for managed service providers.

Regulatory Landscape
IoT security regulation is shifting from voluntary guidance to enforceable, cross-jurisdiction requirements that influence product design, procurement, and vendor qualification. In the European Union, Regulation (EU) 2024/2847 (Cyber Resilience Act), signed into law on 23 October 2024, sets horizontal cybersecurity requirements for products with digital elements and increases the compliance bar for manufacturers selling connected devices into the bloc.
Outside the EU, governments are tightening device-baseline rules and procurement guidance. The United Kingdoms Product Security and Telecommunications Infrastructure (PSTI) regime (effective April 2024) and the US Federal Communications Commission consumer labeling activity in 2024 reinforce security-by-design expectations, while NIST maintains IoT baselines for US federal use via the 8259 series and related guidance (including ongoing work such as SP 800-213 revision activity and NIST IR 8259r1 in 2026). Australia added another mandatory anchor, with the Cyber Security (Security Standards for Smart Device) Rules 2025 commencing on 4 March 2026 after a transition period, increasing the need for globally consistent controls mapped to widely used standards such as ETSI EN 303 645 and ETSI TS 103 701 conformance assessment.
Value Chain Analysis
The IoT security value chain starts with device conception and silicon selection (secure elements, secure boot, key storage), then moves through firmware and software development (secure SDLC, threat modeling, SBOM, vulnerability disclosure). It also spans manufacturing and provisioning (identity injection and certificate lifecycle) and deployment into enterprise and OT environments (network segmentation, gateway security, cloud policy enforcement).
Downstream, operators and service partners provide monitoring and response via SOCs, managed detection and response, and incident readiness, while cloud platforms supply continuous analytics and update orchestration for large device fleets. Compliance milestones and guidance updates increasingly affect how participants coordinate across the chain. NIST opened public review of the initial public draft of SP 800-213 Revision 1 in June 2026, pushing manufacturers and integrators to align product lifecycle practices with federal guidance, while phased European requirements under the Cyber Resilience Act raise supplier documentation and audit readiness expectations. Bottlenecks remain around firmware-update execution and patch latency in heterogeneous fleets, which is driving demand for tooling that automates onboarding, attestation, and over-the-air updates without disrupting legacy OT environments, alongside partnerships between security vendors, device OEMs, and connectivity providers to embed controls earlier in the product lifecycle.
Competitive Landscape
The IoT security market shows moderate fragmentation. Incumbents such as Cisco leverage networking footprints to bundle threat intelligence, recording 117% YoY security revenue growth in Q2 FY2025. Platform players like Palo Alto Networks posted 43% expansion in next-generation security ARR by embedding machine-learning engines that adapt in real time. Check Point, Fortinet, and Microsoft enrich XDR suites with OT protocol decoders, pursuing accounts that demand single-pane visibility across cloud, campus, and factory.
Start-ups concentrate on narrowly defined gaps: packet-in-silicon inspection for low-power sensors, quantum-safe firmware updates, and blockchain-backed device-identity ledgers. Venture funding favors founders who can show IEC 62443 certifications or pilot wins in brownfield refineries. Acquisitions illustrate consolidation pressure; large vendors pay premiums for AI model libraries or edge-secure OS stacks rather than build organically. Patent analysis highlights a pivot toward lightweight homomorphic encryption and federated-learning threat detection, suggesting IP portfolios will underpin competitiveness as post-quantum standards crystallize.
Channel strategies revolve around managed services: MSSPs white-label cloud portals from OEMs, while telcos package security with private 5G slices. Regulatory audits become sales enablers; suppliers offering ready-made documentation kits shorten customers’ time to compliance certification, tipping evaluation scores in competitive tenders. Over the forecast horizon, vendors that can automate evidence gathering and continuous control monitoring will outpace rivals still oriented around annual license contracts.
IoT Security Industry Leaders
Palo Alto Networks
Fortinet, Inc.
Cisco Systems, Inc.
IBM Corporation
Broadcom Inc.
- *Disclaimer: Major Players sorted in no particular order
IoT Security Market Companies Covered in this Report
- Cisco Systems
- IBM
- Broadcom (Symantec)
- Palo Alto Networks
- Check Point
- Fortinet
- Microsoft
- Trend Micro
- Armis
- Infineon Technologies
- ATandT Cybersecurity
- Darktrace
- SecureWorks
- Rapid7
- Trustwave
- Thales
- RSA Security
- Qualys
- Kaspersky
- Zscaler

Market Opportunities and Future Outlook
Mandatory product-security regimes and lifecycle guidance create whitespace for vendors that can operationalize security-by-design at scale, particularly for manufacturers that need repeatable evidence packs such as SBOM generation, vulnerability intake and remediation workflows, and update-policy enforcement. NISTs November 2025 publication of SP 1800-36 on trusted network-layer onboarding and lifecycle management points to demand for practical reference architectures that reduce device onboarding friction while improving fleet visibility, supporting solution adoption across consumer, enterprise, and industrial IoT.
IT/OT convergence also supports zero-trust-aligned controls tailored to deterministic OT networks and brownfield constraints. In April 2026, US agencies (CISA with DoD, FBI, DoE, and the State Department) published comprehensive guidance for applying Zero Trust to OT environments, reinforcing demand for segmentation, identity-aware access, and monitoring at IT/OT boundaries. European industrial ecosystems are investing in secure data exchange and automation resilience as well, including the June 2026 move when Fraunhofer AISEC and IOSB joined the Semiconductor-X consortium to advance secure industrial data rooms and sensitive production-data exchange. These initiatives favor vendors that combine device discovery and risk scoring with secure connectivity, policy orchestration, and service-led deployment models that can handle legacy assets and long equipment lifecycles.
Recent Industry Developments in IoT Security Market
- March 2026: Palo Alto Networks announced partnerships with Nokia, U Mobile, Aeris, and Celerway to deliver secure-by-design connectivity and visibility for AI factories and global IoT fleets. The update links IoT/OT device security more directly with the connectivity layer, where managed and unmanaged endpoints can be discovered and governed at scale across multiple networks.
- August 2025: Palo Alto Networks introduced Device Security as a platform-integrated evolution of its IoT/OT security capabilities for discovery, risk assessment, and proactive mitigation. By packaging IoT/OT protections into a broader security platform motion, the release supports consolidation trends among buyers seeking unified policy and analytics across enterprise, cloud, and industrial environments.
- May 2024: Fortinet launched a generative AI IoT security assistant integrated into FortiManager, aimed at automating detection and troubleshooting of IoT vulnerabilities. The update strengthens operations-centric differentiation for IoT security programs by reducing investigation time and enabling faster policy actions for large, heterogeneous device populations.


IoT Security Market Report Scope and Research Methodology
Market Definition and Coverage
For this study, the IoT security market covers revenue earned from software, platforms, and related services that protect connected devices, networks, and data flows across IoT deployments, from onboarding through ongoing monitoring and response.
Scope exclusions: We exclude general IT security that is not tied to IoT device identities, device-to-cloud communications, or IoT operations.
Segments Covered in This Report
- By Security Type
- Network Security
- Endpoint/Device Security
- Application Security
- Cloud/Virtual Security
- By Component
- Solutions
- IAM and PKI
- DDoS Protection
- IDS/IPS
- Encryption and Tokenisation
- Services
- Professional Services
- Managed Security Services
- Solutions
- By End-user Industry
- Smart Manufacturing
- Connected Healthcare
- Automotive and Mobility
- Energy and Utilities
- BFSI
- Government and Smart Cities
- Retail and Logistics
- By Deployment Mode
- On-premise
- Cloud/SECaaS
- Hybrid Edge
- By Geography
- North America
- United States
- Canada
- Mexico
- South America
- Brazil
- Argentina
- Rest of South America
- Europe
- Germany
- United Kingdom
- France
- Italy
- Rest of Europe
- Asia-Pacific
- China
- Japan
- India
- South Korea
- Rest of Asia Pacific
- Middle East and Africa
- United Arab Emirates
- Saudi Arabia
- South Africa
- Rest of Middle East and Africa
- North America
Data Sources, Market Sizing, and Validation
Desk Research
Desk work starts with mapping the demand pool for connected devices and the risk controls that typically sit around them. We leaned on public sources such as NIST guidance, ENISA publications, FCC cybersecurity labeling material where applicable, and NVD vulnerability statistics to understand control categories and recurring attack patterns.
To keep the market model anchored to adoption reality, device shipment and connectivity signals were also reviewed using sources such as ITU indicators, OECD digital economy statistics, and relevant industry association releases on industrial automation and smart home ecosystems. Alongside this, we reviewed company annual reports, investor decks, product documentation, and credible press coverage to cross-check pricing direction and buying motions, and then filled gaps with selective paid subscriptions for company financials, patent lookups, and news and financials. These sources are illustrative, and many other public references were reviewed for data collection, validation, and clarification.
Primary Interviews and Surveys
Primary work focused on validating how IoT security budgets are actually split across device, network, cloud, and application layers, and how much is bought as software versus services. We spoke with solution providers, system integrators, and end users across major regions, which helped correct desk-based assumptions on attach rates, renewal behavior, and security spend per device where shipment and connectivity signals were less direct.
Distribution of primary research fieldwork respondents
| Company type | Respondent position | Region |
|---|---|---|
| Top tier: 25% | CXOs: 16% | APAC: 53% |
| Mid tier: 59% | Functional/Unit leaders: 28% | EMEA: 29% |
| Smaller Players: 16% | Managers: 56% | Americas: 18% |
Market-Sizing & Forecasting
Sizing was built using a top-down, penetration-rate based demand-pool assessment, where connected device growth and connectivity uptake were translated into a security addressable spend, and then split by the security layers typically implemented in IoT stacks. The totals were checked using selective bottom-up approximations, including sampled average selling prices multiplied by estimated volumes for common deployments, and channel checks on services mix so the final number does not rely on one view.
Inputs that influenced the model included IoT device shipment and installed base signals, the mix of consumer versus industrial deployments, typical security attach rates by use case, average contract values and renewal patterns for IoT-focused controls, and the pace of regulatory and compliance adoption that can pull spending forward. Where a bottom-up view could not be built for smaller geographies or niche use cases, we applied proxy ratios from comparable markets and then re-tested them with interview feedback.
Forecasts were derived using scenario analysis, where variables like device growth, breach-driven urgency, and cloud adoption were adjusted under base, conservative, and aggressive cases. The final forecast path was selected only after the scenario outputs matched the direction of what primary respondents expected for budgets and rollout timing.
Data Validation & Update Cycle
Outputs were validated through multiple checks so the final sizing stays consistent with real-world signals. Analysts compared regional totals against independent indicators such as device growth, enterprise security spend direction, and reported cyber incident pressure, and then investigated any sharp deviations before sign-off.
A second review pass is run to confirm definitions, currency handling, and year alignment, followed by re-contact triggers when a datapoint conflicts with what most respondents are seeing. Reports are refreshed annually, and interim updates are made when material events shift demand assumptions. Before delivery, we run a final sweep so the latest public information and model revisions are reflected.
Mordor Intelligence's IOT Security Market Size Compared Against Other Published Estimates
Published IoT security market values can look far apart because the boundaries are not uniform, and the math behind adoption and pricing is not always visible. Differences usually come from what is counted as IoT specific security, how services are treated, which year is used as the current size, and how currency timing is handled.
By tracking device-led demand indicators and refreshing adoption and pricing assumptions through interviews, the Mordor Intelligence approach keeps the 2026 market value tied to IoT security controls rather than broad cybersecurity bundles, which reduces inflation from non-IoT spend. The spread in external numbers also tends to widen when a study starts from a different base year, applies a faster ASP ramp, or assumes higher near-term compliance driven buying without checking it across end-user cohorts.
Benchmark comparison
| Source | Market Size | Gaps in Research Methodology |
|---|---|---|
| Mordor Intelligence | USD 11.66 B (2026) | |
| Global Consultancy A | USD 35.50 B (2024) | Uses an earlier base year and appears to include a wider cybersecurity spending basket around IoT environments, which can pull in adjacent cloud and network security not strictly IoT scoped. |
| Industry Research Group B | USD 28.30 B (2024) | Starts from a 2024 base and applies broader solution coverage across regions, and the services share assumptions are less transparent, which can lift the total when implementation and consulting are counted more fully. |
The table shows that most gaps are explained by year alignment and how tightly IoT specific security is separated from general security spend. When scope is kept consistent, and assumptions like attach rates and services mix are checked with real buyers and implementers, the resulting market size becomes easier to trace and repeat across updates.


Key Questions Answered in the Report
What is the current size of the IoT security market?
The IoT security market stands at USD 11.66 billion in 2026 and is projected to reach USD 47.33 billion by 2031.
Which segment holds the largest IoT security market share?
Network Security leads with 41.55% market share, reflecting enterprises’ preference for perimeter-centric defense.
Which deployment model is growing fastest?
Hybrid Edge deployments are expected to rise at a 33.15% CAGR because they balance low-latency processing with cloud-based orchestration.
Why is Asia Pacific the fastest-growing region?
Explosive smart-city investment and the rapid addition of billions of consumer IoT endpoints drive Asia Pacific’s 34.25% forecast CAGR.
How are regulations shaping vendor selection?
Acts like the EU Cyber Resilience Act and the UK PSTI Act require documented security-by-design and lifetime update support, so buyers favor vendors that can prove compliance.
What factors restrain IoT security adoption?
Fragmented firmware-update mechanisms, the cost of refreshing legacy devices, and shortages of specialized cyber-talent slow wider implementation despite rising threat levels.
Page last updated on:





