
IoT Sensor Market Size and Share
Market Overview
| Study Period | 2020 - 2031 |
|---|---|
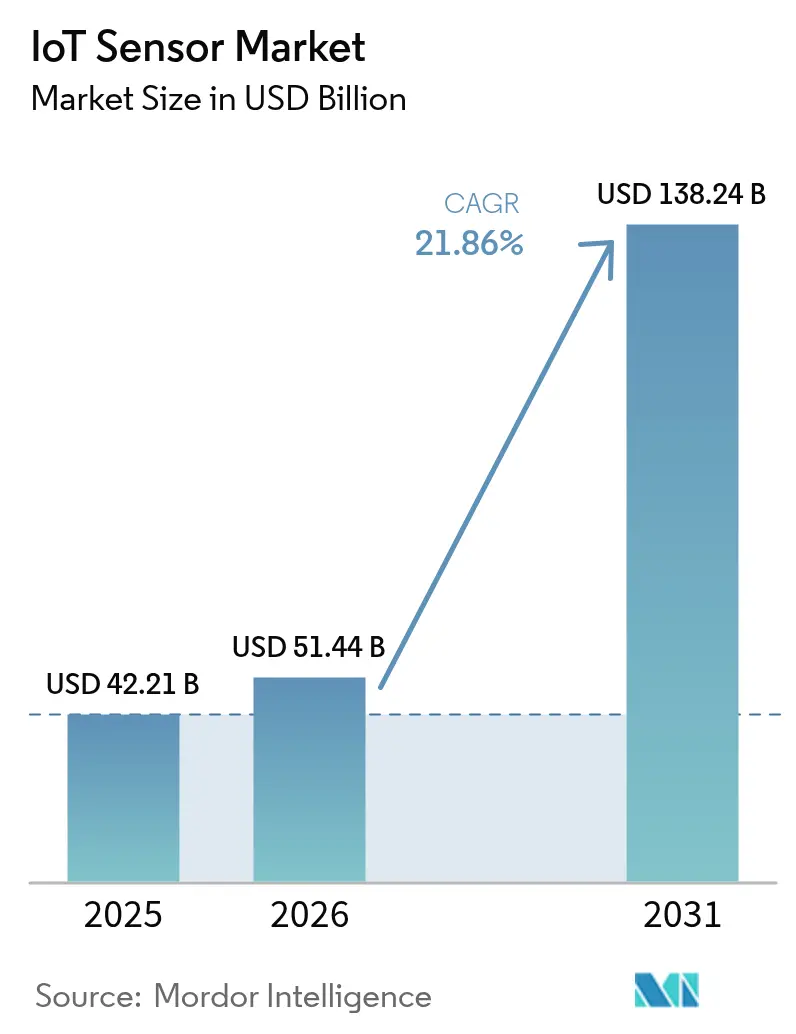
| Market Size (2026) | USD 51.44 Billion |
| Market Size (2031) | USD 138.24 Billion |
| Growth Rate (2026 - 2031) | 21.86 % |
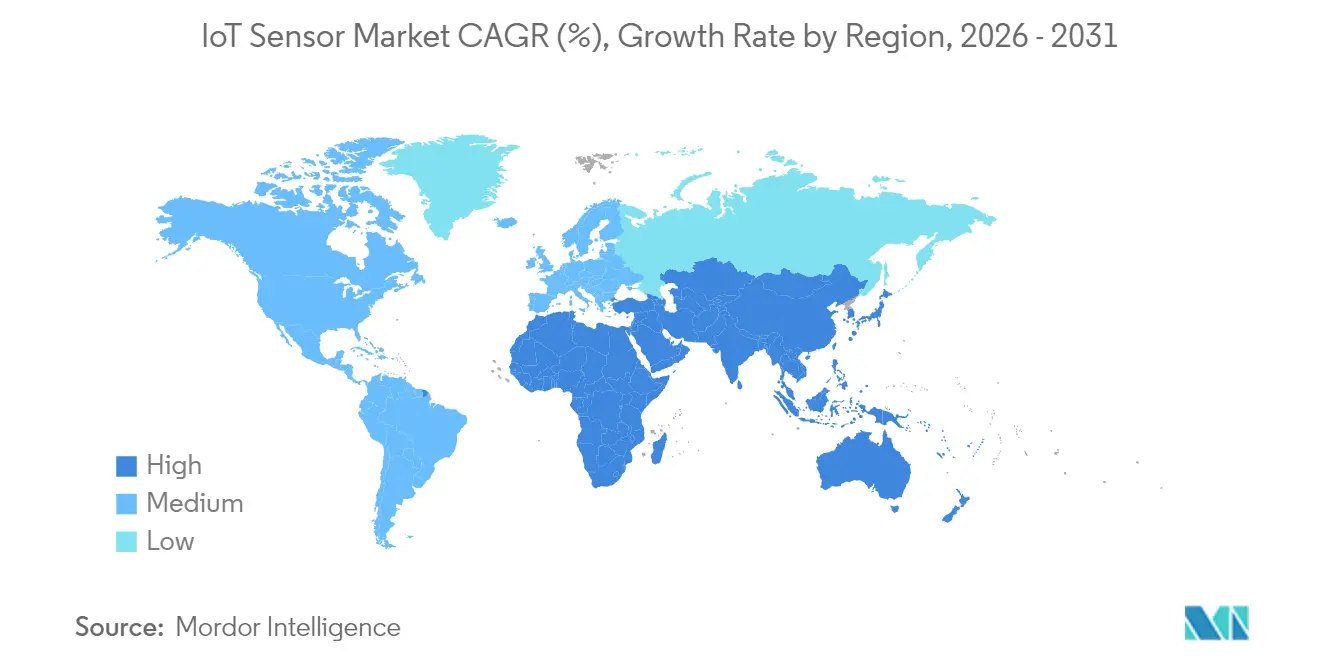
| Fastest Growing Market | Middle East and Africa |
| Largest Market | Asia Pacific |
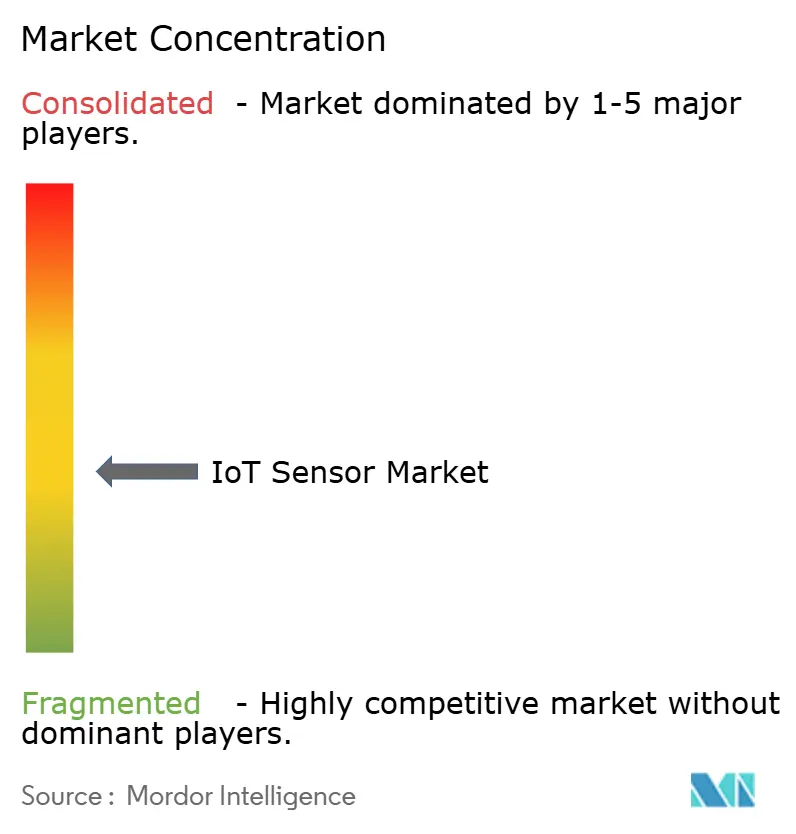
| Market Concentration | Medium |
Major Players *Disclaimer: Major Players sorted in no particular order Image © Mordor Intelligence. Reuse requires attribution under CC BY 4.0. | |
IoT Sensor Market Analysis by Mordor Intelligence
IoT sensors market size in 2026 is estimated at USD 51.44 billion, growing from 2025 value of USD 42.21 billion with 2031 projections showing USD 138.24 billion, growing at 21.86% CAGR over 2026-2031. Steep demand accelerates as artificial intelligence and edge computing migrate into miniature sensing platforms across industrial automation, automotive safety, and urban infrastructure. Mandatory fleet-telematics rules in North America and India, private 5G deployments in Japanese factories, and battery-less energy-harvesting networks in Nordic offshore wind farms are widening adoption footprints. Competitive intensity is rising as semiconductor majors embed AI engines inside sensors to reduce latency and bandwidth. At the same time, low-power wide-area connectivity and energy harvesting are shifting total cost of ownership equations in remote monitoring scenarios.
Key Report Takeaways
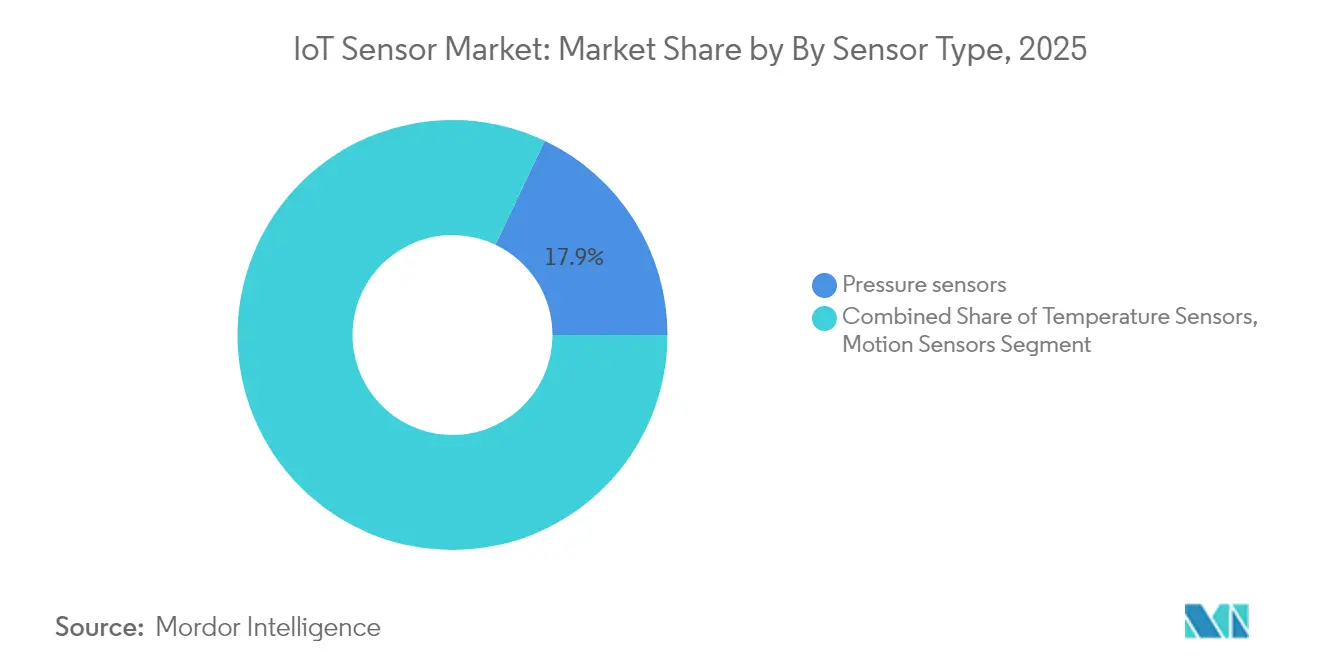
- By sensor type, image sensors are advancing at a 27.78% CAGR and are set to overtake pressure sensors, which led with 17.94% of the IoT sensors market share in 2025.
- By technology, MEMS retained 42.15% of the IoT sensors market size in 2025; optical sensing is forecast to grow 25.48% annually to 2031.
- By connectivity, LoRaWAN and Sigfox protocols are expanding at a 31.75% CAGR, outpacing Wi-Fi’s 24.12% revenue share in 2025.
- By power source, battery solutions dominated 62.38% of the IoT sensors market size in 2025, while energy harvesting is climbing at 34.65% CAGR.
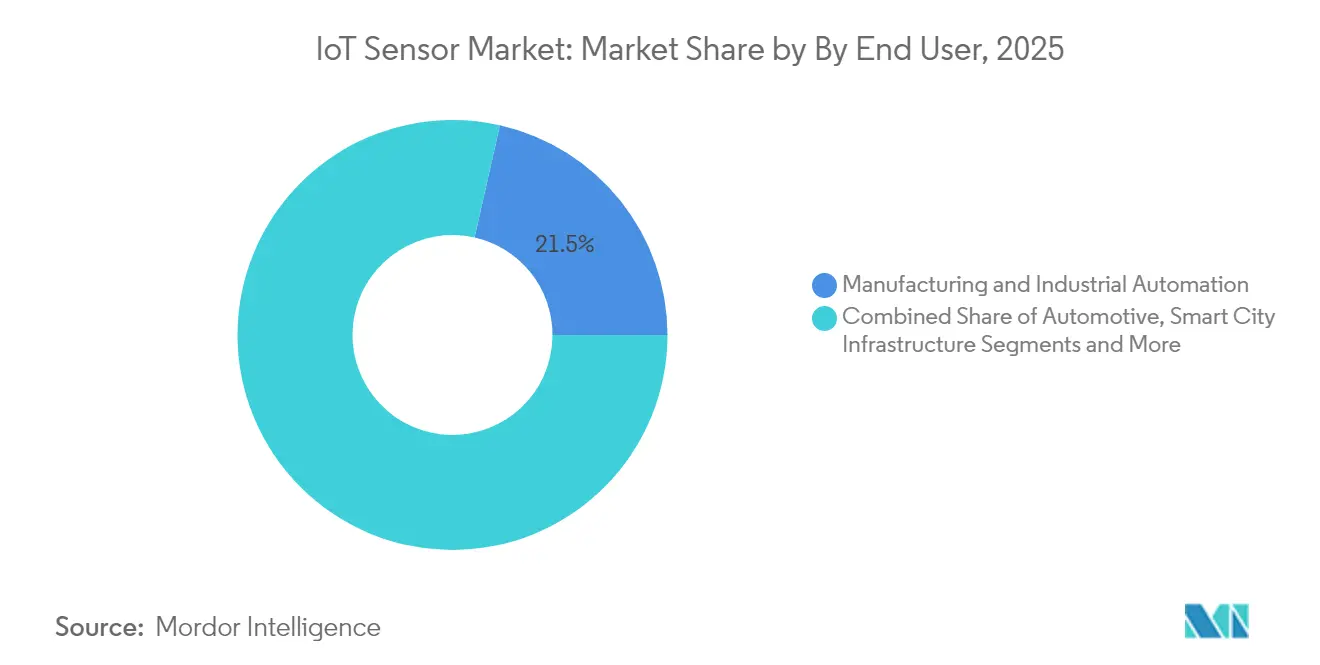
- By end-use industry, manufacturing held 21.46% revenue in 2025; smart city infrastructure is the fastest riser with a 29.28% CAGR through 2031.
- By region, Asia-Pacific captured 32.55% of 2025 revenue, underpinned by China’s smart-manufacturing policy support and Japan’s private 5G spectrum allocations.
Note: Market size and forecast figures in this report are generated using Mordor Intelligence’s proprietary estimation framework, updated with the latest available data and insights as of 2026.
Global IoT Sensor Market Trends and Insights
Drivers Impact Analysis*
| DRIVER | (~) % IMPACT ON CAGR FORECAST | GEOGRAPHIC RELEVANCE | IMPACT TIMELINE |
|---|---|---|---|
| Rapid adoption of low-power MEMS-based multimodal sensors enabling edge analytics in European discrete manufacturing | +4.2% | Europe, with spillover to North America | Medium term (2-4 years) |
| Mandated fleet-telematics regulations in North America and India boosting automotive inertial/pressure sensor demand | +3.8% | North America & India, expanding to APAC | Short term (≤ 2 years) |
| Battery-less energy-harvesting sensor nodes for predictive maintenance in offshore wind farms (Nordics & UK) | +2.1% | Nordic countries & UK, extending to global offshore markets | Long term (≥ 4 years) |
| Private 5G networks in Japanese smart factories requiring time-synchronized image sensors | +3.5% | Japan, with adoption spreading to South Korea & China | Medium term (2-4 years) |
| Smart-water-meter rollouts by Middle-East desert utilities catalyzing ultrasonic‐flow sensor uptake | +1.9% | Middle East, expanding to arid regions globally | Medium term (2-4 years) |
| Rapid adoption of LoRaWAN/Sigfox LPWANs enabling scalable industrial IoT | +2.7% | Global industrial hubs | Short term (≤2 years) |
| Source: Mordor Intelligence | |||
Rapid adoption of low-power MEMS-based multimodal sensors enabling edge analytics in European discrete manufacturing
European manufacturers embed multimodal MEMS sensors directly in equipment to analyze vibration, temperature, sound, and pressure on-site. TDK’s i3 Micro Module integrates an AI core that predicts anomalies before breakdowns. Bosch Sensortec’s BHI360 family executes gesture and 3D-audio functions in under 600 µA, cutting network traffic 80% while retrofitting legacy lines. Predictive maintenance programs using these edge devices report 25% cost savings and extend asset life 20-30% across German and Italian plants.[1]James Blackman, “Toyota Material Handling Puts Entire US Factory on Ericsson Private 5G Network,” rcrwireless.com
Mandated fleet-telematics regulations in North America and India boosting automotive inertial/pressure sensor demand
The U.S. SmartWay modernization and India’s commercial-vehicle tracking rules oblige fleets to capture real-time vehicle data. Texas Instruments’ AWR1843AOP radar integrates DSP and MCU blocks to meet reporting and safety needs while supporting advanced driver assistance. Adoption is scaling as logistics firms shift to predictive maintenance scheduling, raising unit demand for multi-sensor arrays.[3] International Council on Clean Transportation, “Modernizing Data Collection for the SmartWay Program,” theicct.org
Battery-less energy-harvesting sensor nodes for predictive maintenance in offshore wind farms
Hybrid thermoelectric-piezoelectric harvesters from KIST increase on-board power 50%, allowing sensor grids on turbines where battery swaps are costly. MIT researchers harvest magnetic fields for perpetual operation of remote nodes. Operators avoid USD 50,000 per-turbine daily downtime and cut maintenance spending 15-20%.
Private 5G networks in Japanese smart factories requiring time-synchronized image sensors
Toyota Material Handling’s Ericsson 5G network illustrates the pivot from Wi-Fi to deterministic wireless for automation. Japan’s spectrum scheme supports sub-millisecond image-sensor sync for high-speed inspection. NICT trials show continuous “non-stop line” production via coordinated wireless control.
Restraints Impact Analysis*
| RESTRAINTS | (~) % IMPACT ON CAGR FORECAST | GEOGRAPHIC RELEVANCE | IMPACT TIMELINE |
|---|---|---|---|
| 200mm MEMS-foundry capacity shortage limiting automotive-grade inertial sensor supply | -2.8% | Global, with acute impact in Asia-Pacific automotive hubs | Short term (≤ 2 years) |
| Calibration drift in long-lifecycle chemical sensors restricting pharma cold-chain adoption | -1.5% | Global pharmaceutical supply chains, concentrated in North America and Europe | Medium term (2-4 years) |
| Cyber-physical attack surface in wireless sensor networks delaying LatAm smart-grid projects | -1.2% | Latin America, with concerns spreading to emerging markets | Medium term (2-4 years) |
| Restricted access to critical materials (gallium, antimony) for sensor fabs | -1.0% | U.S., China, EU supply chains | Short term (≤2 years) |
| Source: Mordor Intelligence | |||
200mm MEMS-Foundry Capacity Shortage Limiting Automotive-Grade Inertial Sensor Supply
Global semiconductor manufacturing faces acute capacity constraints in 200mm MEMS foundries, creating supply bottlenecks for automotive-grade inertial sensors required for advanced driver assistance systems and autonomous vehicle development. SEMI reports indicate global semiconductor fab capacity expansion of 6% in 2024 and 7% in 2025, yet automotive sensor demand is growing at rates exceeding 25% annually, creating persistent supply-demand imbalances. The shortage particularly affects automotive inertial sensors requiring specialized packaging and extended temperature ranges, where qualification cycles can extend 18-24 months beyond standard consumer applications. X-FAB Silicon Foundries' USD 1 billion expansion targeting automotive and industrial applications represents industry efforts to address capacity constraints, though new fab capacity typically requires 2-3 years to reach full production.
Calibration drift in long-lifecycle chemical sensors restricting pharma cold-chain adoption
Chemical sensors deployed in pharmaceutical cold-chain applications experience calibration drift over extended operational periods, limiting their adoption in critical drug storage and transportation systems where measurement accuracy directly impacts product efficacy and patient safety. Research published in Frontiers in Chemistry identifies calibration drift as a primary challenge for electronic noses and tongues, with temporal validity limitations requiring frequent recalibration that increases operational costs and system complexity. The pharmaceutical industry's stringent regulatory requirements demand continuous measurement accuracy over sensor lifecycles that can extend 5-10 years, yet current chemical sensing technologies typically require recalibration every 6-12 months to maintain acceptable performance. Nuclear power plant research demonstrates that over 90% of sensors remain within calibration specifications during routine checks, suggesting that automated recalibration methods could address pharmaceutical applications while reducing operational costs.
*Our forecasts treat driver/restraint impacts as directional, not additive. The impact forecasts reflect baseline growth, mix effects, and variable interactions.
Segment Analysis
By Sensor Type: Image sensors propel innovation
Image sensors drove a 27.78% CAGR and are forecast to eclipse pressure sensors’ 17.94 % contribution by 2031. The IoT sensors market size for image-based devices is widening as autonomous vehicles and AI-powered inspection systems migrate from prototypes to volume lines. Automotive OEMs integrate high-dynamic-range CMOS imagers with inertial units for sensor fusion, ensuring safe navigation in complex urban traffic. Industrial users deploy smart cameras that execute neural-network inference locally, eliminating bandwidth costs and protecting IP. Meanwhile, pressure sensors remain staples in pneumatics, HVAC, and process automation, sustaining steady demand. Across both categories, vendors embed micro-controllers and security enclaves to meet cybersecurity mandates in connected machinery.
A second wave of temperature, motion, and proximity sensors targets wearables and collaborative robots. Embedded AI routines recognise gestures and micro-movements, enriching user interfaces. Chemical and gas sensors confront calibration-drift hurdles, yet tightening air-quality rules and hydrogen-leak detection in fuel-cell vehicles preserve growth. Inertial and magnetic sensors underpin electric-vehicle motor control and precise positional feedback in industrial actuators, cementing their role within the IoT sensors market.



By Technology: MEMS dominance challenged by optical advances
MEMS retained 42.15% revenue in 2025, anchoring the IoT sensors market share through cost-effective wafer-level packaging. Yet optical techniques, led by LiDAR and structured-light systems, are growing 25.48% annually. MEMS foundries now co-package optical modulators and inertial elements, enabling hybrid modules that deliver ranging and orientation data from one socket. CMOS imagers saturate mature consumer segments but remain core to smartphone and dash-cam refresh cycles. Electrochemical sensors maintain footholds in point-of-care diagnostics. Piezoelectric harvesters re-emerge as designers tap vibration energy to power sub-milliwatt sensor clusters.
Materials innovation is brisk: Infineon’s graphene-based Hall device achieves 100-times sensitivity over silicon peers, unlocking ultra-low field detection for robotics. Packaging advances combine glass-through-silicon vias with flip-chip to compress footprint while improving heat transfer, sustaining high reliability in automotive temperature extremes.
By Connectivity: LoRaWAN disrupts traditional paradigms
Wi-Fi held 24.12% revenue in 2025, yet LoRaWAN and Sigfox networks expand 31.75% each year as utilities and factories seek kilometer-scale coverage on coin-cell budgets. The IoT sensors market size for low-power wide-area devices is scaling as chipset costs drop below USD 2. Cellular NB-IoT and 5G RedCap address applications requiring guaranteed throughput and roaming, whereas Bluetooth LE caters to wearables. Hybrid architectures now embed dual radios, dynamically switching between LoRaWAN for telemetry and BLE for provisioning. LoRa Alliance membership surpassed 500 companies in 2024, reflecting ecosystem maturity .
By Power Source: Energy harvesting reshapes autonomy
Battery units still account for 62.38% of shipments, yet the IoT sensors market size for energy-harvesting designs is rising fast. Hybrid thermoelectric-vibration harvesters power condition-monitoring nodes that run for decades without maintenance. IEEE Spectrum documents magnetic-field harvesters that capture stray currents along cables, opening raw material processing plants to self-powered monitoring. Power-over-Ethernet and super-capacitor backups remain staples in data centers and building management where uninterrupted sensing is critical.
By End-Use Industry: Smart cities accelerate infrastructure overhaul
Manufacturing kept 21.46% of 2025 revenue as Industry 4.0 retrofits press ahead. In contrast, smart city infrastructure grows 29.28% annually, driven by intelligent street lighting, waste-collection optimization, and adaptive traffic controls. Fleet-telemetry rules boost automotive uptake, while healthcare invests in remote patient monitoring requiring FDA-grade reliability. Utilities deploy smart meters and grid-edge sensors to balance renewable inputs. Agriculture leverages soil-moisture probes and imagery to cut water usage. Logistics outfits embed environmental monitors in cold-chain parcels, guarding vaccine integrity.
By Application: Predictive maintenance reshapes operations
Predictive-maintenance deployments demonstrate 25% maintenance savings and 70% downtime avoidance, energizing growth in heavy industries. Sensors feed machine-learning models that forecast bearing wear in rolling mills and detect cavitation in pumps. Structural health monitoring extends to bridges, tunnels, and wind turbines, with fiber-optic strain gauges and MEMS accelerometers delivering real-time integrity data. Human-machine interface advances move beyond buttons to gesture and voice control, elevating safety in hazardous environments. Ambient sensing optimizes HVAC energy use in commercial buildings.
Geography Analysis
Asia-Pacific led with 32.55% revenue in 2025. China’s “Industrial Internet Innovation and Development Action Plan” installs sensor grids for high-speed equipment coordination, while Japan’s private 5G allocations underwrite deterministic communication in smart factories. South Korea capitalizes on advanced semiconductor processes, anchoring supply security for regional OEMs. India mandates fleet telematics across commercial vehicles, rapidly scaling demand for inertial and environmental sensors. Australia’s mining sector requires rugged devices certified for explosive atmospheres, creating specialized niches within the IoT sensors market.
North America benefits from the CHIPS and Science Act. Texas Instruments secured USD 1.6 billion to build three 300 mm fabs, bolstering domestic sensor capacity. The region emphasizes cybersecurity, pushing suppliers to integrate secure-boot, encryption, and over-the-air update capabilities. Canada invests in environmental sensing to monitor forest-fire risk, while Mexico’s automotive clusters demand cost-competitive safety sensors.
Europe enforces strict emissions and safety standards. Germany’s discrete-manufacturing champions deploy AI-enabled MEMS modules to cut scrap rates. France invests in smart lighting and traffic management for carbon reduction. Nordic offshore wind farms cultivate energy-harvesting sensor deployments to manage turbine stress in sub-zero seas. The EU Cyber Resilience Act compels suppliers to certify software-driven sensors, increasing design complexity yet raising buyer confidence.

Regulatory Landscape
Cybersecurity regulation is becoming a primary compliance gate for connected sensors and embedded software. In the EU, Regulation (EU) 2024/2847 (Cyber Resilience Act) entered into force on December 10, 2024, and it introduces phased obligations that affect IoT sensor suppliers that ship connected products into Europe. This includes start of Chapter IV provisions on conformity assessment bodies from June 11, 2026, manufacturer vulnerability reporting obligations (Article 14) applying from September 11, 2026, and broader manufacturer applicability from December 11, 2027.
Standards bodies and US federal guidance are aligning to operationalize these requirements in product design, documentation, and lifecycle management. ETSI has been advancing conformance and threat-modeling references relevant to consumer and hub-style sensor deployments, for example ETSI TS 103 701 on conformance assessment and ETSI TS 103 864 on security threats for consumer sensor hubs. Its CRA-related interim drafts have also defined an April 2026 cut-off for direct comments, channeling late inputs through National Standardization Organizations. In the United States, NIST issued an initial public draft of NIST SP 800-213 Revision 1 in June 2026 (open for comment until August 24, 2026), reinforcing procurement and buyer expectations for secure-by-design IoT products consistent with the Internet of Things Cybersecurity Improvement Act of 2020.
Value Chain Analysis
The IoT sensor value chain starts with materials and device IP (MEMS structures, CMOS/optical stacks, specialty materials such as gallium and antimony), then moves into wafer fabrication (often on mature nodes), packaging and test (including calibration and environmental qualification), module integration (MCU, power management, radio), and distribution via OEM/ODM channels into end markets such as manufacturing automation, automotive, smart buildings, utilities, and smart city infrastructure. A bottleneck highlighted in the market context is capacity and qualification constraints for automotive-grade MEMS supply, with the 200 mm MEMS-foundry shortage and long qualification cycles shaping lead times and allocation.
Downstream, interoperability and data standardization increasingly influence integration costs and time-to-deploy. The publication of IEEE 1451.0-2024 in June 2024 provides a standard framework for smart transducer interfaces, including metadata constructs and security considerations, which helps sensors integrate into heterogeneous OT/IT stacks. Industrial data ecosystems are also tightening around regulatory-driven traceability and interoperability needs, illustrated by the August 2025 collaboration between Catena-X and the OPC Foundation to standardize data exchange aligned to the EU Digital Product Passport timeline (effective 2027). Connectivity and service partners are becoming more prominent in scaling deployments, as seen in the 2026 AT&T and Wiliot collaboration around supply-chain and asset-tracking solutions that pair sensor tags with network infrastructure and field maintenance capabilities.
Competitive Landscape
The IoT sensors market remains moderately fragmented. Bosch Sensortec, Honeywell, and STMicroelectronics leverage sizable R&D budgets and global sales channels. Bosch plans to invest EUR 2.5 billion in AI development and targets 10 billion intelligent sensor shipments by 2030. Honeywell teams with Qualcomm on AI-powered industrial solutions and with NXP on aviation microcontrollers, sliding AI inference next to sensor front-ends. STMicroelectronics and Qualcomm co-develop turnkey Bluetooth/Wi-Fi modules for automotive infotainment.
White-space entrants focus on energy harvesting, cybersecurity, and novel materials. Infineon’s SURF unit merges sensor and RF teams to chase ambient IoT and green-energy markets. AMS-OSRAM ships the first AEC-Q102-qualified 8-channel LiDAR laser, expanding automotive perception options. Graphene‐based magnetic sensors from Bosch and Infineon promise dramatic performance gains over silicon. Strategic acquisitions, such as Honeywell’s purchase of Civitanavi Systems for autonomous navigation, underscore a tilt toward integrated motion-sensing stacks.
IoT Sensor Industry Leaders
Honeywell International Inc.
Bosch Sensortec GmbH
STMicroelectronics N.V.
Texas Instruments Inc.
NXP Semiconductors N.V.
- *Disclaimer: Major Players sorted in no particular order

Market Opportunities and Future Outlook
A large opportunity area is compliance-ready, secure-by-design sensors and sensor modules for regulated markets, where buyers need evidence of lifecycle cybersecurity, vulnerability handling, and software update capabilities rather than standalone sensing performance. The EU Cyber Resilience Act entered into force in December 2024 and brings forward phased obligations in 2026, including conformity-assessment-body and reporting-related milestones. NIST advanced US guidance with the June 2026 initial public draft of SP 800-213 Revision 1. Together, these items create whitespace for suppliers that can productize security features (secure boot, device identity, signed OTA updates, vulnerability disclosure processes) into repeatable platforms across industrial, automotive, and smart-building deployments.
A second opportunity area sits in interoperability and data-access-driven architectures that increase the value of sensors within broader industrial data platforms. The EU Data Act became effective in September 2025 and introduces design obligations taking effect in September 2026 for new connected products sold in the EU, requiring operational data to be accessible in structured and secure formats. This strengthens demand for gateways, standardized metadata, and multi-protocol integration around sensor fleets. Ongoing ecosystem activity supports this shift: the LoRa Alliance announced a three-year LoRaWAN technical roadmap in June 2026 that includes application integrations such as OPC UA mapping, aligning LPWAN sensor deployments with industrial data models. Schneider Electric announced Industrial Automation Modernization as a Service in June 2026 (built on HPE SimpliVity infrastructure), pointing to demand for packaged modernization offerings where sensors, connectivity, and software are deployed as a managed stack rather than piecemeal hardware.
Recent Industry Developments
- June 2026: STMicroelectronics announced new industrial and edge-AI oriented sensing products, including the IIS3DWB10IS vibration sensor with integrated ISPU 2.0 for condition monitoring and predictive maintenance. The announcement supports STM’s position in industrial IoT deployments where on-sensor processing reduces system power and lowers the need for external host compute, aligning with scalable retrofit programs.
- February 2026: STMicroelectronics completed the acquisition of the MEMS business formerly held by NXP Semiconductors. The transaction expands STM’s MEMS portfolio and manufacturing know-how, improving vertical integration options for motion and inertial sensing used across automotive, industrial automation, and always-on consumer devices.
- September 2024: NXP Semiconductors introduced combined ultra-wideband secure ranging and short-range radar capabilities aimed at autonomous industrial and IoT applications. By blending secure localization with radar-based presence and motion detection, the announcement highlighted a shift toward multi-modal sensing stacks that simplify design-in for industrial safety and automation use cases.


Research Methodology Framework and Report Scope
Market Definition and Coverage
This market covers the revenues generated from sensors that are deployed in IoT systems to sense physical conditions and send usable signals into connected devices, gateways, or networks. The sizing reflects sensor hardware value across major end uses where connectivity and remote monitoring are part of the design.
Scope exclusions: We exclude standalone connectivity modules, gateways, and recurring software or platform fees, and we also exclude installation and managed services unless bundled into the sensor selling price.
Segmentation Overview
- By Sensor Type
- Pressure Sensors
- Temperature Sensors
- Motion and Proximity Sensors
- Chemical and Gas Sensors
- Humidity Sensors
- Image Sensors
- Inertial Sensors (Accelerometer, Gyroscope)
- Magnetic Sensors
- Optical and Light Sensors
- Level and Flow Sensors
- By Technology
- MEMS
- CMOS
- Optical
- Electrochemical
- Magnetic
- Piezoelectric and Others
- By Connectivity
- Wired (Ethernet, Modbus, CAN)
- Wireless WiFi
- Wireless Bluetooth/BLE
- Wireless Zigbee/Z-Wave
- Wireless LoRaWAN/Sigfox
- Wireless Cellular (2G, 5G, NB-IoT)
- RFID/NFC
- By Power Source
- Battery-Powered
- Energy-Harvesting (Thermal, Vibration, RF)
- Powered-over-Ethernet and Wired Power
- By End-Use Industry
- Manufacturing and Industrial Automation
- Automotive and Transportation
- Healthcare and Medical Devices
- Consumer Electronics and Wearables
- Smart Home and Building Automation
- Energy and Utilities (Oil and Gas, Smart Grid)
- Agriculture and Environmental Monitoring
- Logistics and Supply Chain (Cold-chain, Asset Tracking)
- Smart City Infrastructure
- Defense and Security
- By Application (Deep-Dive)
- Predictive Maintenance
- Condition Monitoring
- Structural Health Monitoring
- Human-Machine Interface
- Ambient Sensing
- By Geography
- North America
- United States
- Canada
- Mexico
- South America
- Brazil
- Argentina
- Rest of South America
- Europe
- Germany
- United Kingdom
- France
- Italy
- Spain
- Nordics (Sweden, Norway, Denmark, Finland)
- Benelux (Belgium, Netherlands, Luxembourg)
- Middle East
- Saudi Arabia
- United Arab Emirates
- Israel
- Turkey
- Africa
- South Africa
- Nigeria
- Kenya
- Rest of Africa
- Asia
- China
- Japan
- India
- South Korea
- ASEAN (Singapore, Malaysia, Thailand, Indonesia, Philippines, Vietnam)
- North America
Data Sources, Market Sizing, and Validation
Desk Research
Desk work starts by building a clean fact base on how many connected devices are shipped and where sensors are being designed into those deployments, then translating that into a demand pool for sensor value. Public sources such as the International Telecommunication Union for connectivity indicators, the World Bank for macro and industry activity, and the United Nations Comtrade database for trade flows help set reasonable outer limits on demand and supply movement.
We also review sources such as US Federal Communications Commission equipment authorization references, EU regulatory and standards bodies publications, and peer-reviewed engineering journals to understand technology shifts like MEMS adoption, energy harvesting, and wireless protocol progress. Company filings, investor presentations, and credible press are used to interpret product mix and pricing direction, and paid subscription access for company financials and patent databases is used selectively to confirm exposure and innovation intensity. The sources mentioned here are illustrative, and many other public and subscription sources were used for data collection, validation, and clarification.
Primary Interviews and Surveys
Primary work is used to pressure test assumptions that desk sources do not fully explain, such as sensor attach rates by device category and how average selling prices move as volumes scale. We speak with participants across sensor design, sourcing, integration, distribution, and end user deployment, and coverage is balanced across APAC, EMEA, and the Americas so regional adoption patterns do not get overgeneralized.
Distribution of primary research fieldwork respondents
| Company type | Respondent position | Region |
|---|---|---|
| Top tier: 36% | CXOs: 15% | APAC: 44% |
| Mid tier: 48% | Functional/Unit leaders: 42% | EMEA: 36% |
| Smaller Players: 16% | Managers: 43% | Americas: 20% |
Market-Sizing & Forecasting
The core model uses a top-down build where connected device adoption and industrial IoT deployment indicators are used to reconstruct the sensor demand pool, which is then converted into value using observed pricing bands. Results are cross checked through selective bottom-up approximations using sampled supplier revenues, channel checks, and a simple ASP times volume sanity test for a few high traction use cases.
Inputs are chosen to match how IoT sensors are bought and consumed, so we track indicators such as connected device shipments and installed base, expected sensors per device or per asset, the split between wired and wireless deployments, MEMS share progression for high volume categories, and typical replacement cycles for wear and environment exposed sensors. Forecasts are built using multivariate regression, where device growth and deployment intensity are the main drivers, and price erosion assumptions are adjusted based on expert feedback. Where direct volume evidence is thin, we fill gaps by using proxy series like automation investment trends and trade movement for relevant sensor classes, and then confirm that the implied totals remain realistic by geography and end use.
Data Validation & Update Cycle
Validation is done through multiple checks so the final number is not driven by a single assumption. We compare outputs against independent signals such as device adoption trends, import and export movement, and public guidance on demand conditions, then review and correct outliers when the logic does not hold.
A second analyst review is completed before sign off, and any large variance triggers a re-check of pricing, attach rates, or regional splits through follow-up outreach. Reports are refreshed annually, and interim updates are made when material events occur such as regulation changes, major technology shifts, or sharp pricing moves. Before delivery, a final pass is completed so clients receive the most current view available at that time.
Mordor Intelligence's IOT Sensor Market Size Measured Against Other Published Estimates
Published IoT sensor market values often differ because firms do not count the same things, even if the titles look similar, and timing also matters. The biggest gaps usually come from what is treated as a sensor versus adjacent hardware, how wireless and wired deployments are priced, and how fast price erosion is assumed to happen in high volume categories.
Some publishers fold in broader device side value like connectivity modules or even parts of gateways, which inflates the reported sensor number as the device mix shifts toward complex systems. Mordor Intelligence counts only sensor hardware revenue, and excludes connectivity components and recurring software so the total stays tied to sensor attach rates and sensor ASPs that can be checked using interviews and public signals.
Benchmark comparison
| Source | Market Size | Gaps in Research Methodology |
|---|---|---|
| Mordor Intelligence | USD 51.44 B (2026) | |
| Global Consultancy A | USD 16.20 B (2024) | Uses an earlier base year and applies a steep growth curve that can amplify short-term adoption spikes, and the public summary does not clearly separate pure sensor revenue from device-led use case bundling. |
| Industry Publisher B | USD 34.34 B (2026) | Includes a wider technology and interface framing that can blend sensor value with module-style form factors, and the sizing approach appears to lean more on broad vertical narratives than on attach rate and pricing checks by deployment type. |
The spread in the table mainly comes down to what gets included around the sensor and how base year pricing is handled. By keeping the scope anchored to sensor hardware and checking the math against adoption and pricing inputs, our estimate stays easier to trace and repeat when new device and deployment data comes in.


Key Questions Answered in the Report
What is the current value of the smart sensors market?
The smart sensors market is valued at USD 51.44 billion in 2026 and is forecast to reach USD 138.24 billion by 2031.
Which region leads global demand for IoT sensors?
Asia-Pacific leads with 32.55% revenue, driven by China’s smart-manufacturing push and Japan’s private 5G factory networks.
Why are image sensors growing faster than other sensor types?
Autonomous vehicles and AI-based quality inspection systems require high-resolution, time-synchronized imaging, pushing image sensors at a 27.78% CAGR.
How does energy harvesting influence IoT sensor deployments?
Energy-harvesting designs eliminate battery maintenance, enabling remote monitoring in offshore wind farms and industrial equipment while growing 34.65% annually.
What are the major restraints to market growth?
Tight 200 mm MEMS-foundry capacity, calibration drift in chemical sensors, and cybersecurity risks in wireless networks temper overall CAGR by several percentage points.
Which companies are shaping competitive dynamics?
Bosch Sensortec, Honeywell, STMicroelectronics, Infineon, and Texas Instruments lead through AI-enabled sensors, strategic partnerships, and dedicated semiconductor fab projects.
Page last updated on:





