
Disaster Recovery As A Service (DRaaS) Market Size and Share
Market Overview
| Study Period | 2020 - 2031 |
|---|---|
| Market Size (2026) | USD 3.98 Billion |
| Market Size (2031) | USD 14.17 Billion |
| Growth Rate (2026 - 2031) | 28.90 % |
| Fastest Growing Market | North America |
| Largest Market | Asia-Pacific |
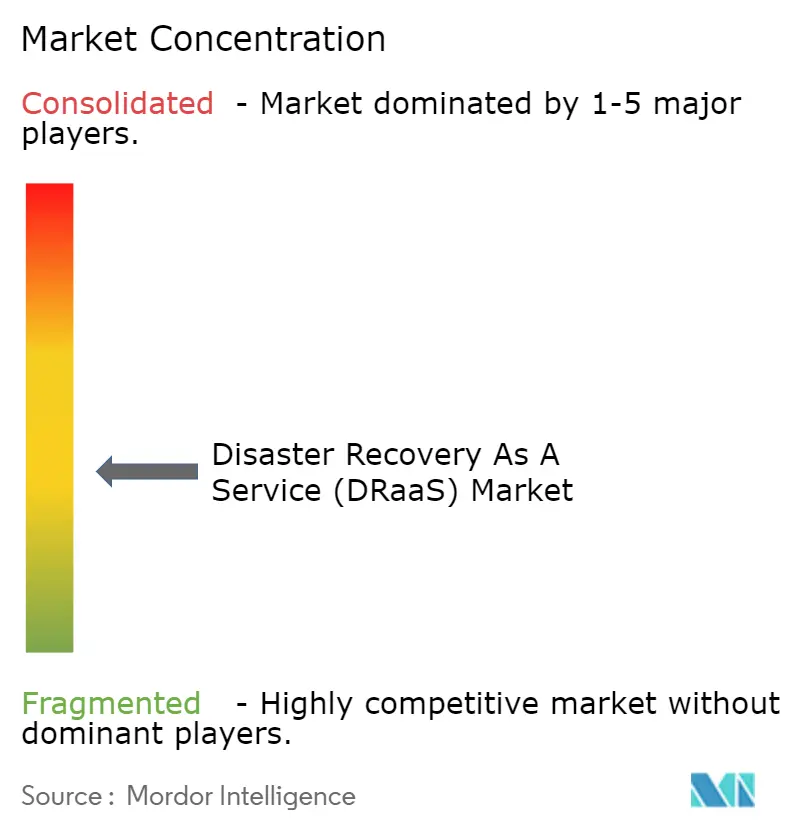
| Market Concentration | Medium |
Major Players *Disclaimer: Major Players sorted in no particular order Image © Mordor Intelligence. Reuse requires attribution under CC BY 4.0. | |
Disaster Recovery As A Service (DRaaS) Market Analysis by Mordor Intelligence
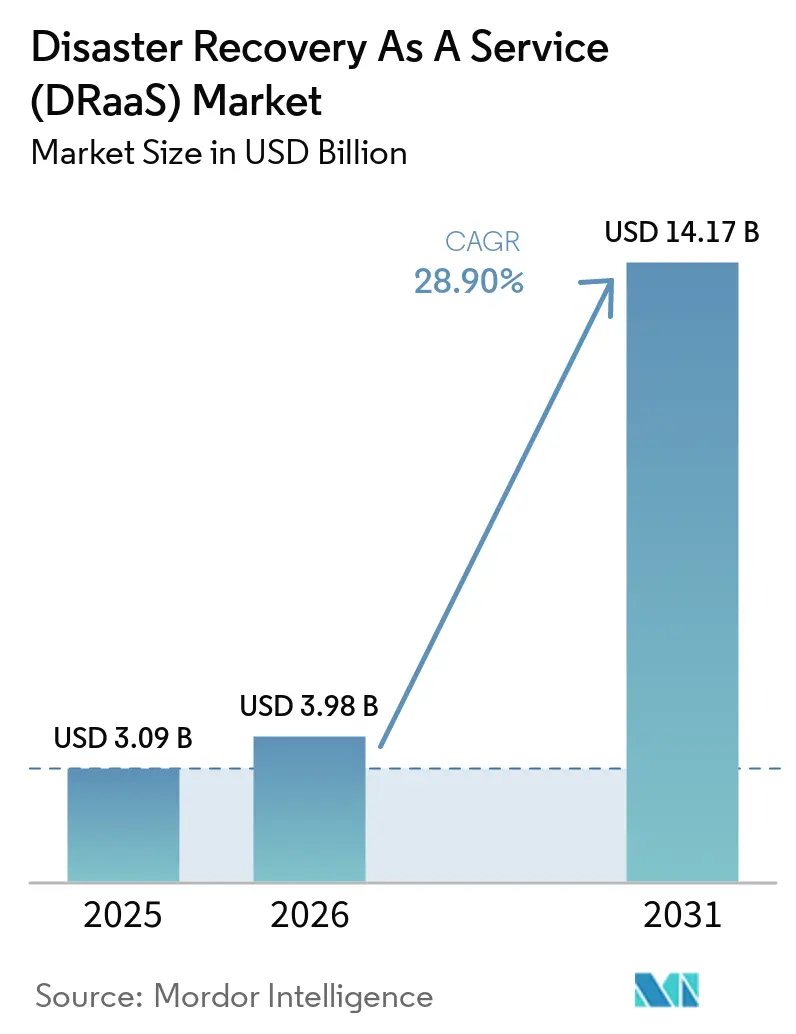
The Disaster Recovery As A Service Market size is expected to increase from USD 3.09 billion in 2025 to USD 3.98 billion in 2026 and reach USD 14.17 billion by 2031, growing at a CAGR of 28.90% over 2026-2031. A steep rise in ransomware, expanding regulatory mandates, and a strategic tilt toward cloud-first infrastructure are reshaping corporate continuity programs and fueling demand for cloud-native recovery offerings. Enterprises now require rapid, automated failover to keep operations running during an attack; traditional tape or disk backups no longer satisfy risk committees or boards. Growing cyber-insurance clauses that insist on tested recovery plans further tighten the link between premiums and mature DRaaS adoption. At the same time, the subscription model lowers capital outlays, enabling both large enterprises and SMEs to access enterprise-grade resilience. Vendors now compete on orchestration intelligence, multi-cloud reach, and sustainability credentials, because organizations evaluate providers on both operational and environmental performance.
Key Report Takeaways
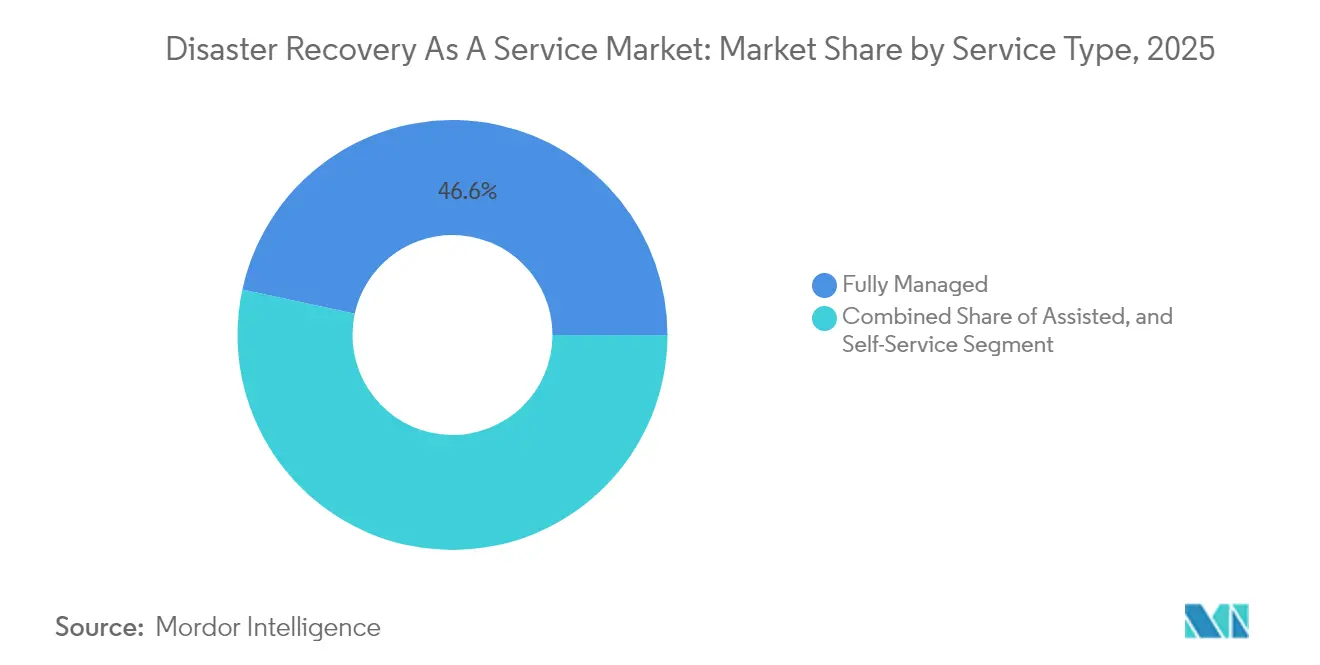
- By service type, Fully Managed solutions held 46.60% of the Disaster Recovery as a Service market share in 2025, while Self-Service options are projected to climb at a 29.11% CAGR through 2031.
- By deployment model, Public Cloud deployments led with 57.50% revenue share in 2025; Hybrid/Multi-Cloud is the fastest-growing configuration at a 29.23% CAGR to 2031.
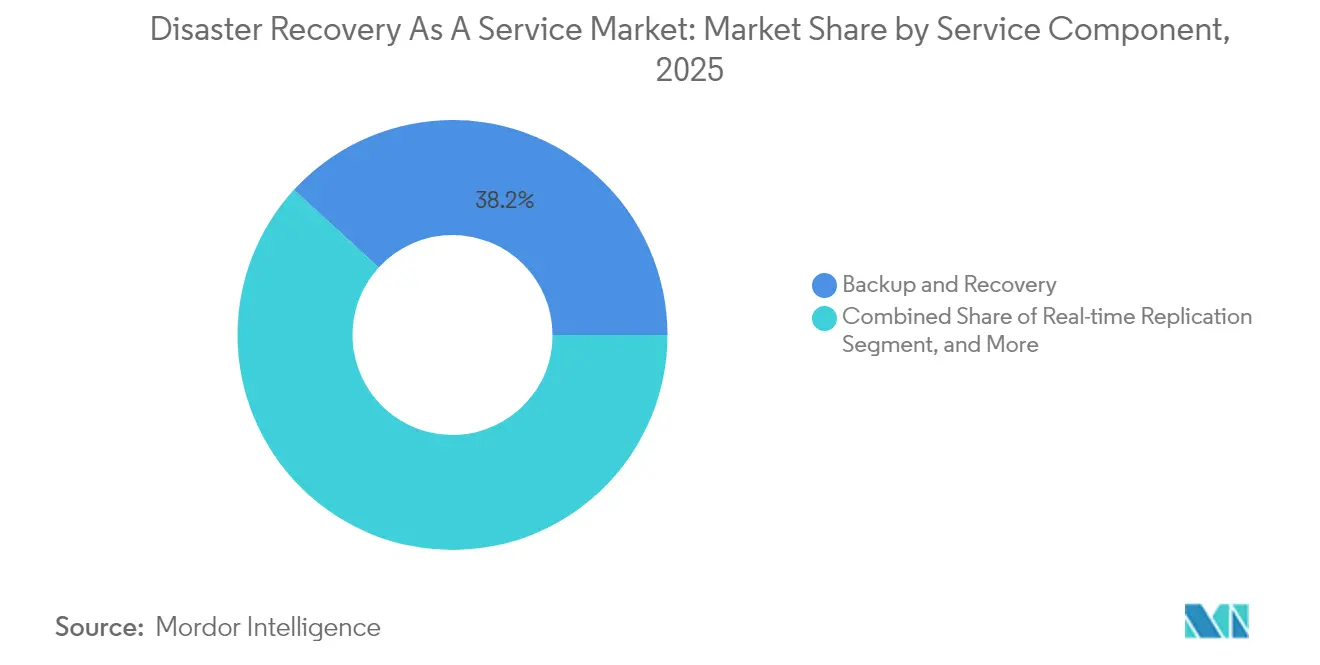
- By service component, Backup and Recovery accounted for 38.20% of the Disaster Recovery as a Service market size in 2025, whereas Orchestration and Automation is advancing at 30.22% CAGR.
- By organization size, Large Enterprises controlled 63.10% of the Disaster Recovery as a Service market size in 2025; SMEs are expanding at a 29.14% CAGR through 2031.
- By end-user vertical, BFSI retained the largest share at 24.10% in 2025, and Healthcare & Life Sciences is accelerating at a 30.36% CAGR to 2031.
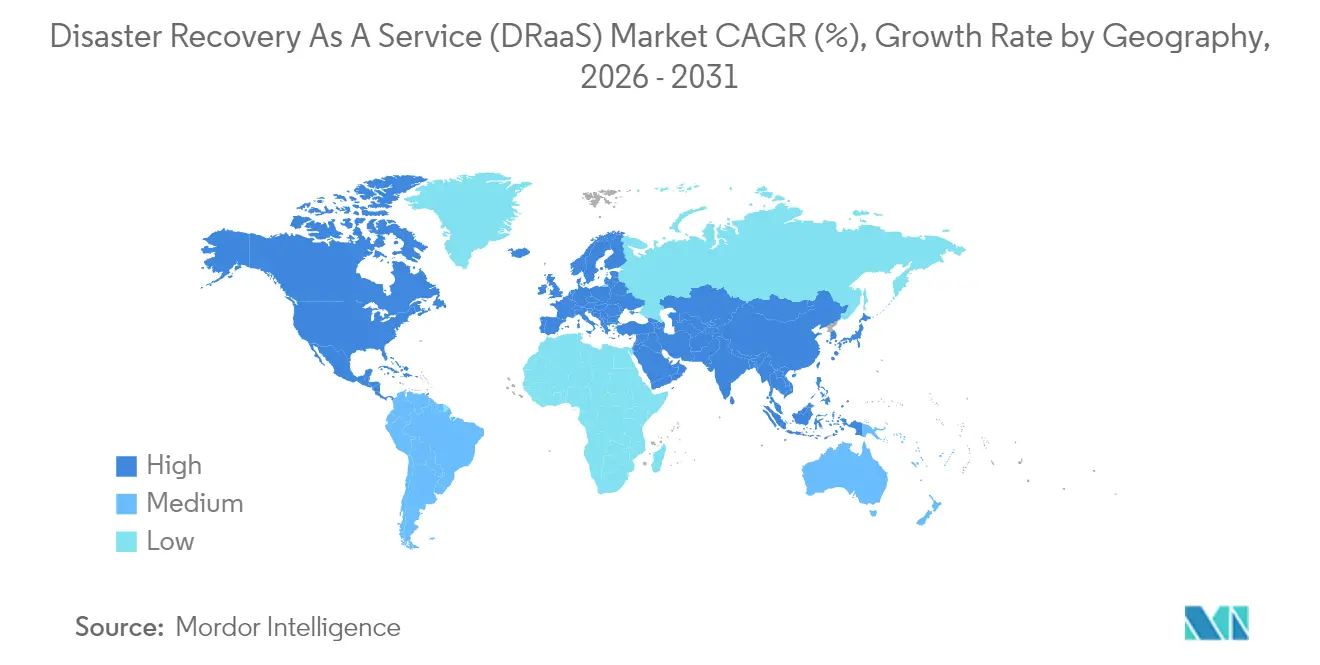
- By geography, North America commanded 39.30% market share in 2025, while Asia-Pacific is the fastest-growing region at 30.44% CAGR through 2031.
Note: Market size and forecast figures in this report are generated using Mordor Intelligence’s proprietary estimation framework, updated with the latest available data and insights as of 2026.
Market Trends and Insights
Drivers Impact Analysis of Disaster Recovery As A Service (DRaaS) Market*
| Driver | ( ~ ) % Impact on CAGR Forecast | Geographic Relevance | Impact Timeline |
|---|---|---|---|
| Escalating ransomware and data-breach incidents | +2.8% | Global, high in North America and Europe | Short term (≤ 2 years) |
| Lower TCO versus traditional DR infrastructure | +2.1% | Global, strongest in APAC and emerging markets | Medium term (2-4 years) |
| Cloud-first and SaaS adoption accelerating DRaaS uptake | +1.9% | Global, led by North America and Western Europe | Medium term (2-4 years) |
| Cyber-insurance compliance mandating automated fail-over testing | +1.4% | North America and Europe, expanding to APAC | Short term (≤ 2 years) |
| Edge-computing roll-outs needing geo-distributed micro-recovery nodes | +1.2% | APAC core, spill-over to North America | Long term (≥ 4 years) |
| “Green-DRaaS” pressures favouring renewably powered recovery sites | +0.8% | Europe and North America, early in Australia | Long term (≥ 4 years) |
| Source: Mordor Intelligence | |||
Escalating ransomware and data-breach incidents
Attackers now exfiltrate data within hours after compromise, forcing organizations to adopt immutable snapshots and isolated recovery zones that only modern DRaaS platforms supply at scale.[1]Palo Alto Networks, “2025 Unit 42 Global Incident Response Report,” paloaltonetworks.comIn 2024, 87% of IT teams experienced SaaS data loss, yet only 14% felt confident about rapid recovery. Healthcare providers embrace cloud-native recovery to stay HIPAA-compliant and safeguard patient care continuity.[2]US Signal, “DRaaS: Protecting Healthcare Data and Enabling Compliance,” ussignal.com Cyber-insurance carriers reward verified failover capabilities with premium discounts, giving CFOs a clear financial argument for DRaaS adoption.
Lower TCO versus traditional DR infrastructure
DRaaS removes capital spending on secondary sites and specialist staff, replacing them with pay-as-you-go subscriptions that align cost to use. Veeam reports that 88% of organizations plan to shift toward DRaaS within two years, ranking cost optimization as their top motivation. Subscription pricing prevents hardware obsolescence and frees IT teams to focus on transformation projects rather than hardware upkeep. SMEs find the economics especially compelling because enterprise-grade recovery becomes attainable without scale-driven investments, broadening the total addressable Disaster Recovery as a Service market.
Cloud-first and SaaS adoption accelerating DRaaS uptake
As businesses migrate complex workloads to several cloud providers, conventional DR scripts break. Eighty-seven percent of APAC IT leaders increased their cloud-storage budgets in 2023, and 93% migrated workloads from on-premises to cloud during 2022, setting the stage for multi-cloud recovery strategies.[3]Wasabi Technologies, “Asia-Pacific Leads Global Public Cloud Storage Growth in 2023,” wasabi.com Government policy reforms could lift regional GDP by up to 0.7% from 2024 to 2028, magnifying the incentive to protect cloud assets.[4]Asian Development Bank, “Cloud Computing Policies and Their Economic Impacts in Asia and the Pacific,” adb.org DRaaS platforms orchestrate workload-aware recoveries across AWS, Azure, Google, and regional sovereign clouds, meeting both performance and compliance needs.
Cyber-insurance compliance mandating automated fail-over testing
Insurers are tightening underwriting guidelines and now demand proof of automated recovery tests and documentation. Security advisory firm eSentire notes that carriers increasingly require EDR, vulnerability management, and tested business continuity plans as prerequisites for coverage. Financial institutions, already subject to operational-resilience rules, rely on DRaaS providers for audit-ready evidence that reduces premiums and accelerates claims processing.
Restraints Impact Analysis of Disaster Recovery As A Service (DRaaS) Market*
| Restraint | ( ~ ) % Impact on CAGR Forecast | Geographic Relevance | Impact Timeline |
|---|---|---|---|
| Deployment and orchestration complexity in hybrid/multi-cloud | −1.8% | Global, acute in regulated sectors | Medium term (2-4 years) |
| Data-sovereignty and regulatory barriers to cross-border replication | −1.3% | Europe, APAC with localization laws | Long term (≥ 4 years) |
| Provider lock-in and egress-cost uncertainty | −1.1% | Global, affects multi-cloud strategies | Medium term (2-4 years) |
| Shortage of multi-cloud DR engineers and skills | −0.9% | Global, pronounced in APAC | Long term (≥ 4 years) |
| Source: Mordor Intelligence | |||
Deployment and orchestration complexity in hybrid/multi-cloud
Integrating legacy on-premises assets with several public clouds stretches internal teams and forces organizations to learn disparate APIs and security models. The US National Security Agency advises constant testing and infrastructure-as-code practices to keep hybrid recovery scripts reliable. Skills shortages drive reliance on managed DRaaS partners but also prolong sales cycles, as buyers evaluate providers for deep automation and regulatory comprehension.
Data-sovereignty and regulatory barriers
Stringent data-residency statutes restrict where backups may reside, reducing geographic dispersion and inflating provider infrastructure costs. Broadcom cautions that GDPR and HIPAA rules mandate strong encryption and local replication, complicating global failover designs. In Asia-Pacific, localization edicts add compliance layers that can delay implementation and reduce the economic edge of global hyperscale regions.
*Our forecasts treat driver/restraint impacts as directional, not additive. The impact forecasts reflect baseline growth, mix effects, and variable interactions.
Disaster Recovery As A Service (DRaaS) Market Segment Analysis
By Service Type:
Managed services drive market maturityFully Managed offerings controlled 46.60% of the Disaster Recovery as a Service market share in 2025 on the back of enterprise demand for turnkey orchestration, monitoring, and compliance reporting. Customers lean on providers for multi-cloud engineering and 24×7 recovery execution, activities that would otherwise balloon internal headcount. Self-Service options, though lean on assistance, post a 29.11% CAGR because SMEs prefer configurable portals that balance autonomy with cost. Assisted models sit between both ends, suiting mid-market firms that own some cloud skills yet still need run-book support.
Managed service momentum underscores a broader reality: resilience now spans infrastructure, applications, and regulatory proof. Vendors like HYCU, which scored a 91 NPS in 2025, showcase how service depth and customer experience trump feature parity. As a result, the Disaster Recovery as a Service market will likely witness sharper service-quality segmentation, where premium support tiers justify higher annual recurring revenue multiples, while commodity self-service tiers chase price-sensitive niches.



By Deployment Model:
Hybrid architectures reshape recovery strategiesPublic Cloud retains 57.50% revenue thanks to hyperscale economies and on-demand scalability, yet Hybrid/Multi-Cloud configurations command a 29.23% CAGR as firms hedge concentration risk and satisfy residency rules. Disaster Recovery as a Service market size for Hybrid deployments is forecast to expand swiftly because enterprises can replicate critical databases to a sovereign cloud while failing over less-sensitive apps to global regions. Private Cloud persists for workloads steeped in strict data classifications or requiring air-gapping.
Verizon calls hybrid flexibility the linchpin of modern continuity planning. N2WS research agrees, noting that multi-cloud replication cuts vendor lock-in and improves failover granularity. However, orchestrating identical recovery time objectives across divergent clouds remains complex, opening room for tooling that abstracts cloud-native idiosyncrasies.
By Service Component:
Orchestration emerges as competitive differentiatorBackup and Recovery held 38.20% of the Disaster Recovery as a Service market size in 2025, reflecting its baseline necessity. Yet Orchestration and automation are growing 30.22% annually as businesses realize that scripting failover for dozens of apps by hand is impractical. Real-time replication supplements both, meeting banking and healthcare RTO mandates that hover near zero.
VMware Cloud on AWS now protects up to 6,000 VMs per group and embeds automated health checks, illustrating how orchestration drives tangible operational gains. AI-driven run-books, highlighted by Silent Infotech, further cut manual intervention and lower incident fatigue. Competitive advantage is shifting toward providers that fuse event-driven automation with compliance dashboards in a single console.
By Organization Size:
SME adoption accelerates through cloud economicsLarge Enterprises still account for 63.10% of Disaster Recovery as a Service market size thanks to sprawling infrastructure estates and board-level scrutiny of risk. Still, SMEs register a 29.14% CAGR to 2031 because subscription pricing dissolves historical CapEx hurdles. They no longer need co-located secondary sites; a credit card and a policy template suffice.
Veeam observes that these firms jump-start ransomware recovery by delegating complexity to their DRaaS partner.As uptake widens, providers refine tiered bundles that package essential SLA levels for SMEs while upselling advanced analytics once operational maturity rises.
By End-User Vertical:
Healthcare leads regulatory-driven transformationBFSI captured 24.10% of the Disaster Recovery as a Service market share in 2025, capitalizing on long-standing risk cultures and regulatory oversight. Nevertheless, Healthcare and Life Sciences log the fastest 30.36% CAGR as HIPAA, GDPR, and emerging patient-data acts force always-on continuity. Diagnostic imaging, telehealth, and electronic health record systems cannot afford downtime without endangering patient outcomes.
US Signal’s 2025 guide confirms healthcare buyers prize audit-ready artifacts and immutable storage. Similar momentum unfolds in public-sector agencies, which are under pressure from digital-service mandates. Manufacturers mesh DRaaS with operational-technology safety, ensuring production lines resume safely following cyber or physical disruption.
Geography Analysis
North America Disaster Recovery As a Service (DRaaS) Market
North America maintained a 39.30% share in 2025 by blending hyperscale cloud availability, mature cyber-insurance ecosystems, and prescriptive regulatory frameworks. High ransomware prevalence amplifies board-level urgency, while the Federal Cloud Operations Best Practices Guide supplies public agencies with blueprint standards. Financial institutions, in particular, tie premium discounts to demonstrable DR testing, further cementing uptake. Although the region’s Disaster Recovery as a Service market now sees price competition, rising edge deployments and ESG reporting keep demand resilient.
APAC Disaster Recovery As a Service (DRaaS) Market
Asia-Pacific registers the highest 30.44% CAGR as governments champion cloud growth to spur GDP. The Asian Development Bank projects that improved cloud policies can lift regional GDP by up to 0.7% between 2024 and 2028. Singapore’s aggressive “cloud-first” posture sets policy benchmarks, while Japan and Australia impose rigorous data-sovereignty checks that shape architectural blueprints. National disaster exposure drives mandates for resilient ICT backbones, with agencies referencing ADB’s 2025 disaster-preparedness guide to integrate AI sensors and cloud-based recovery. Banks adopt DRaaS to match fintech agility, and manufacturers rely on geo-distributed failover for supply-chain assurance.
Europe Disaster Recovery As a Service (DRaaS) Market
Europe balances adoption incentives and compliance roadblocks. GDPR and incoming EU Cloud Certification laws oblige in-region replication, constraining design but also triggering demand for sovereignty-aligned “intra-EU only” recovery nodes. Sustainability legislation boosts interest in “Green-DRaaS,” leveraging renewable-powered data centers to hit corporate emissions targets.Public-sector digital-service goals accelerate provider outreach, while financial entities continue to invest to satisfy the Digital Operational Resilience Act (DORA). Despite cost pressure, the imperative to preserve citizen-facing services keeps the market expanding.

Regulatory Landscape
DRaaS adoption is increasingly influenced by cloud-security and operational-resilience obligations that turn tested recovery capabilities into a compliance deliverable. In the European Union, the NIS2-related Implementing Regulation (EU) 2024/2690 sets risk-management requirements that apply to cloud and managed service providers, while the Delegated Regulation (EU) 2024/1773 under the Digital Operational Resilience Act (DORA) tightens third-party ICT contracting expectations for critical or important functions. This combination raises the bar for audit-ready DR evidence, performance monitoring, and service continuity clauses.
Standards and government assurance schemes also anchor DR controls into procurement. ISO/IEC 27031:2025 updates ICT readiness for business continuity and disaster recovery guidance that vendors map into controls, testing cadence, and documentation. In Germany, BSI C5:2026 adds a concrete compliance reference for cloud customers and providers, aligning cloud assurance expectations with ISO/IEC 27001 (2022) and EU cloud-security direction. In the United States, a June 2026 National Security Presidential Memorandum (NSPM)-12 directed the Committee on National Security Systems (CNSS) to identify revisions to CNSSP-32 for secure cloud hosting of national security systems, reinforcing requirements for secure cloud operations and recovery discipline in high-assurance environments.
Value Chain Analysis
The DRaaS value chain starts with infrastructure and connectivity foundations, including hyperscale public clouds, regional and sovereign cloud operators, data center providers, and telecom carriers. It then moves into platform software layers such as backup and recovery, replication, orchestration and automation, and security controls including immutable storage and isolated recovery environments.
Delivery and customer success are commonly handled by managed service providers and DR specialists that design runbooks, implement hybrid and multi-cloud integrations, monitor recovery posture, and produce compliance artifacts for audits and cyber-insurance requirements. Commercialization often runs through cloud marketplaces, such as AWS and Azure, which streamline procurement, billing, and deployment into existing cloud estates. Integration and execution remain the main friction points, particularly when organizations need consistent recovery objectives across legacy environments and multiple public clouds, or when data-sovereignty rules constrain cross-border replication and force region-specific infrastructure footprints.
Competitive Landscape
Roughly 250 providers vie for share in the Disaster Recovery as a Service market, creating a moderately fragmented arena that rewards supplier agility. AWS, Microsoft, and Google dominate infrastructure layers, but software players like Veeam, Zerto, and Acronis carve space with hypervisor-agnostic replication and air-gapped protection. Managed specialists, including US Signal and HYCU, differentiate through compliance tooling and white-glove run-book design.
Edge-centric continuity is now an innovation hotspot. European Commission research underscores the migration of compute to the edge for low-latency processing, a trend that pushes vendors to spin up micro-recovery nodes in proximity to sensors and branch sites. Providers that automate policy placement based on latency and carbon scores can capture emerging spend. Sustainability also moves up the buying checklist; EY notes that data-center operators must integrate renewable energy and dynamic load scheduling to achieve emissions targets.
Consolidation looms. Cohesity’s planned USD 3 billion purchase of Veritas’ data-protection unit signals scale imperatives for feature breadth and geographic coverage. Smaller regional players may seek niche depth in regulated verticals or partner into hyperscaler marketplaces. Over the forecast period, competitive advantage will likely pivot on cross-platform orchestration breadth, sustainability certifications, and demonstrable customer-satisfaction scores rather than on raw backup throughput alone.
Disaster Recovery As A Service (DRaaS) Industry Leaders
iLand Internet Solutions Corporation
Microsoft Corporation
Recovery Point Systems Inc.
Evolve IP LLC
TierPoint, LLC
- *Disclaimer: Major Players sorted in no particular order
Disaster Recovery As A Service (DRaaS) Market Companies Covered in this Report
- IBM Corporation
- Microsoft Corporation
- Amazon Web Services Inc.
- VMware Inc.
- Zerto Ltd. (HPE)
- Google Cloud Platform
- iLand Internet Solutions Inc.
- Recovery Point Systems LLC
- Evolve IP LLC
- TierPoint LLC
- Sungard Availability Services LP
- C&W Comminications Limited
- Expedient LLC
- CloudHPT Inc.
- InterVision Systems Technologies LLC
- PhoenixNAP Global IT Services LLC
- Flexential LLC
- Acronis International GmbH
- Veeam Software Inc.
- Druva Inc.
- Rackspace Technology inc.
- Databarracks Ltd.
- NTT Ltd.
Read Analysis of Disaster Recovery As A Service (DRaaS) Companies

Market Opportunities and Future Outlook
A key whitespace is resilience that can be measured and continuously tested, not only provisioned. Benchmarking initiatives such as the RISE 2026 Cloud Resilience Benchmark put emphasis on identity-first security, immutable recovery patterns, and continuous resilience testing, which creates room for DRaaS offerings that package evidence collection, automated test orchestration, and policy-based controls into a single operational layer. ISO activity also gives vendors a forward-looking reference point: ISO registered the ISO/IEC DIS 20996 draft standard for cloud service customer business continuity and resilience for the enquiry phase on April 29, 2026, supporting product differentiation around standardized customer-facing continuity obligations and reporting.
Service expansion is also visible in ransomware-focused recovery and managed clean-room approaches. Cohesity and 11:11 Systems announced in October 2024 an expanded partnership to introduce a managed Clean Room Recovery service, highlighting demand for isolated restoration environments and managed execution that reduces the risk of reinfection during recovery. Opportunity also remains in hybrid and multi-cloud orchestration where customers try to limit single-provider dependency, manage egress-cost uncertainty, and meet data-residency rules. Providers that abstract cloud-specific tooling and incorporate infrastructure-as-code practices for DR configuration can shorten deployments and reduce silent recovery failures.
Recent Industry Developments in Disaster Recovery As A Service (DRaaS) Market
- June 2026: Microsoft made Self-Service Disaster Recovery (SSDR) available for Finance and Operations applications on June 22, 2026. This adds a platform-native recovery option for enterprise application workloads, shaping how some buyers compare built-in SaaS resiliency versus third-party DRaaS layers and managed services.
- July 2025: Recovery Point Systems was included in the 2025 Gartner Market Guide for Disaster Recovery as a Service (DRaaS) for the 10th consecutive year. The repeated inclusion supports its positioning in competitive bids, particularly where vendor shortlists favor providers with long-running DRaaS track records and mature governance processes.
- October 2024: Cohesity and 11:11 Systems expanded their partnership to introduce a managed Clean Room Recovery service. The expansion reinforced a market shift toward isolated, ransomware-aware recovery environments delivered as managed capabilities, raising expectations for DRaaS offerings that combine recovery infrastructure with operational controls and validation.


Disaster Recovery As A Service (DRaaS) Market Report Scope and Research Methodology
Market Definition and Coverage
For this study, the market covers disaster recovery as a service (DRaaS) delivered on a subscription basis, where workloads are replicated to a cloud recovery environment and failover and failback are orchestrated to restore production after an outage.
Scope exclusions: stand-alone on-premises backup appliances and tape vaulting services are excluded when they do not provide a cloud-hosted recovery environment.
Segments Covered in This Report
- By Service Type
- Fully Managed
- Assisted
- Self-Service
- By Deployment Model
- Public Cloud
- Private Cloud
- Hybrid/Multi-Cloud
- By Service Component
- Backup and Recovery
- Real-time Replication
- Orchestration and Automation
- Data Security and Compliance
- By Organization Size
- Large Enterprises
- Small and Medium Enterprises
- By End-user Vertical
- BFSI
- IT and Telecom
- Government and Public Sector
- Healthcare and Life Sciences
- Manufacturing
- Retail and E-commerce
- Media and Entertainment
- Others
- By Geography
- North America
- United States
- Canada
- Mexico
- South America
- Brazil
- Rest of South America
- Europe
- Germany
- United Kingdom
- France
- Russia
- Rest of Europe
- Asia-Pacific
- China
- Japan
- South Korea
- India
- South East Asia
- Rest of Asia-Pacific
- Middle East and Africa
- Middle East
- Africa
- North America
Data Sources, Market Sizing, and Validation
Desk Research
Desk research was used to map the demand pool and set clear boundaries for what counts as DRaaS revenue before any modeling was built. We mainly leaned on public and official source types, including NIST publications, FCC communications reliability updates, US-CERT advisories, ISO guidance notes, and industry association materials focused on continuity and resilience.
To translate signals into sizing inputs, we reviewed company filings, investor presentations, product documentation, and credible press coverage to understand how recovery services are priced, packaged, and contracted. In parallel, we used paid subscriptions only where needed for company financials and intelligence, news and financials screening, patent databases, and selected import-export shipment-level checks for supporting infrastructure signals. These desk research sources are illustrative, and additional public references were used for data collection, validation, and clarification.
Primary Interviews and Surveys
Primary work was used to pressure-test what buyers actually procure under DRaaS, and how providers recognize revenue across fully managed, assisted, and self-service delivery models. We spoke with service providers, channel partners, and enterprise users across APAC, EMEA, and the Americas, so assumptions on adoption, recovery tiers, and pricing steps could be adjusted to what is described in live deployments. When desk inputs conflicted, follow-ups were used to confirm what is included as disaster recovery, versus adjacent backup or data protection spend.
Distribution of primary research fieldwork respondents
| Company type | Respondent position | Region |
|---|---|---|
| Top tier: 27% | CXOs: 16% | APAC: 46% |
| Mid tier: 52% | Functional/Unit leaders: 30% | EMEA: 33% |
| Smaller Players: 21% | Managers: 54% | Americas: 21% |
Market-Sizing & Forecasting
Sizing was built using a top-down approach, where enterprise IT resilience spending is reconstructed into a DRaaS demand pool using adoption and attach-rate logic, then filtered by service definitions and delivery models. We corroborated totals with selective bottom-up approximations, such as sampled provider revenue disclosures, channel checks on contract values, and volume-times-ASP sanity checks for common recovery tiers.
Key inputs used in the model include cloud workload migration pace, frequency and severity of outages and cyber incidents, average recovery time objective requirements by industry, changes in regulatory and compliance expectations for resiliency, and observed DRaaS pricing progression by protected workload and service level. Where provider disclosures were incomplete, gaps were handled using peer ratios and cross-checking against regional demand signals, followed by revalidation in interviews.
For forecasting, scenario analysis was used so growth could flex with macro IT budgets, incident-driven urgency, and cloud adoption speed, and then the scenario weights were aligned to what interviewees expected in near-term procurement cycles.
Data Validation & Update Cycle
Outputs were validated through triangulation across multiple indicators, and the main variances were traced back to scope boundaries or to pricing and adoption assumptions. We ran anomaly checks at the region level and against directional signals, then used a second analyst review to confirm that calculations and definitions were applied consistently.
The report is refreshed annually, and interim updates are made when material events shift demand or pricing assumptions. Before delivery, a final review pass is completed so clients receive the most current view using the latest reasonable inputs.
Mordor Intelligence's Disaster Recovery Service Market Size Versus Other Published Estimates
Published market sizes for disaster recovery services can differ even when the titles look similar, mainly because the line between DRaaS, backup, and broader data protection is drawn differently. Variations also come from which year is treated as the current baseline, how fast pricing is assumed to rise, and whether reported values are adjusted for consistent currency timing.
Key gap drivers here are scope and measurement. Some studies include wider business continuity services and related consulting, while others count only cloud-hosted recovery with orchestrated failover, which changes the total quickly in regions where managed services are bundled. By tracking service-scope boundaries, currency timing, and contract packaging rules, Mordor Intelligence keeps the estimate tied to DRaaS subscription revenue that includes failover capability rather than general backup spend.
Benchmark comparison
| Source | Market Size | Gaps in Research Methodology |
|---|---|---|
| Mordor Intelligence | USD 15.31 B (2026) | |
| Industry Research Publisher A | USD 23.50 B (2024) | Uses a broader disaster recovery services definition that can fold in wider continuity services and adjacent recovery activities, and it anchors on an earlier base year that is not aligned to the DRaaS-only scope used here. |
| Market Tracker B | USD 15.89 B (2025) | Uses a disaster recovery service bucket that mixes multiple types such as hosting services and data protection, which can inflate totals when non-DRaaS revenue is counted alongside cloud failover subscriptions. |
The spread in the table is mostly explained by what is counted as disaster recovery versus adjacent backup and continuity items, and by differences in base-year framing. Our approach stays repeatable because it ties the total to a clear DRaaS definition, checks it against pricing and adoption signals, and then rechecks assumptions through primary feedback before forecasts are extended.


Key Questions Answered in the Report
What is the projected Disaster Recovery as a Service market size for 2031?
The market is forecast to reach USD 26.65 billion by 2031, reflecting an 28.9% CAGR from 2026.
Which region is expected to grow the fastest?
Asia-Pacific leads growth with a 30.44% CAGR, driven by cloud-first government policies and heightened disaster-preparedness needs.
Why are fully managed DRaaS solutions so popular?
Enterprises prefer turnkey offerings that include monitoring, testing, and compliance documentation, which reduces internal staffing needs and speeds audits.
How do data-sovereignty rules influence DRaaS adoption?
Localization laws require in-country replication and restrict cross-border failover, shaping architectural choices and sometimes raising costs.
What role does cyber-insurance play in DRaaS demand?
Many insurers now mandate automated disaster-recovery testing, pushing organizations toward DRaaS platforms that supply audit-ready evidence and lower premiums.
Page last updated on:


 Your data is secure and never sold or shared.


