Internet Of Things In Energy Market Size and Share
Market Overview
| Study Period | 2020 - 2031 |
|---|---|
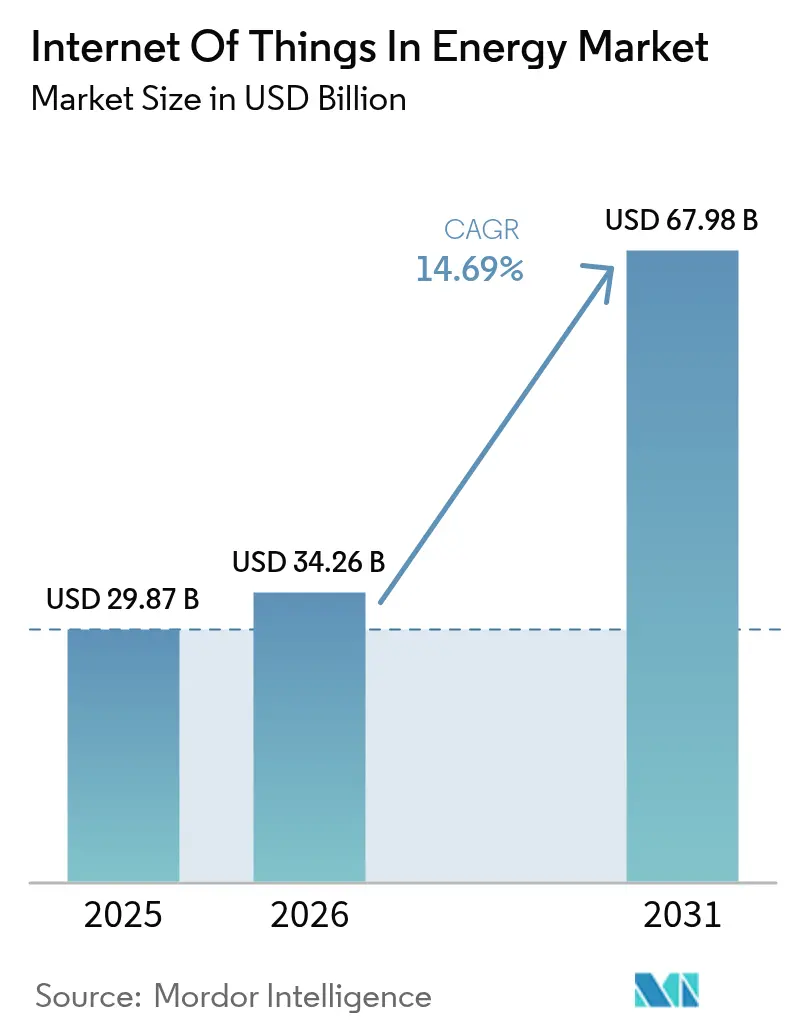
| Market Size (2026) | USD 34.26 Billion |
| Market Size (2031) | USD 67.98 Billion |
| Growth Rate (2026 - 2031) | 14.69% CAGR |
| Fastest Growing Market | Asia Pacific |
| Largest Market | North America |
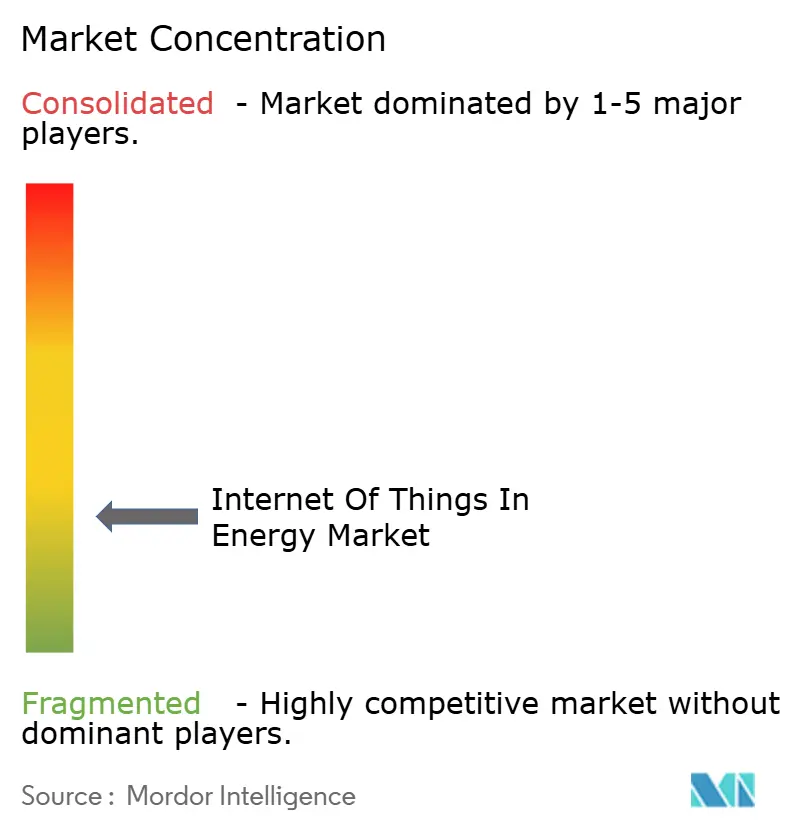
| Market Concentration | Low |
Major Players *Disclaimer: Major Players sorted in no particular order Image © Mordor Intelligence. Reuse requires attribution under CC BY 4.0. | |
Internet Of Things In Energy Market Analysis by Mordor Intelligence
Internet of Things in the energy market size in 2026 is estimated at USD 34.26 billion, growing from 2025 value of USD 29.87 billion with 2031 projections showing USD 67.98 billion, growing at 14.69% CAGR over 2026-2031. Utilities across major economies are moving from centralized command‐and‐control to distributed intelligence so that real-time grid optimization, predictive asset care, and autonomous energy trading can co-exist. Capital spending on smart meters, intelligent substation retrofits, and edge analytics stacks has risen because these investments cut outage minutes and lower maintenance budgets. Semiconductor pricing has stabilized, allowing low-power wide-area modules to fall below the USD 3 threshold, which brings connectivity to secondary feeders, rural solar farms, and behind-the-meter devices. Cellular operators, satellite fleets, and private 5G providers are converging on hybrid network offers that guarantee deterministic latency for protection relay messages while squeezing bandwidth costs for simple sensor traffic. Software vendors have responded by embedding AI toolkits inside asset performance platforms so that energy firms can predict component failures early and monetize flexibility services in wholesale markets.
Key Report Takeaways
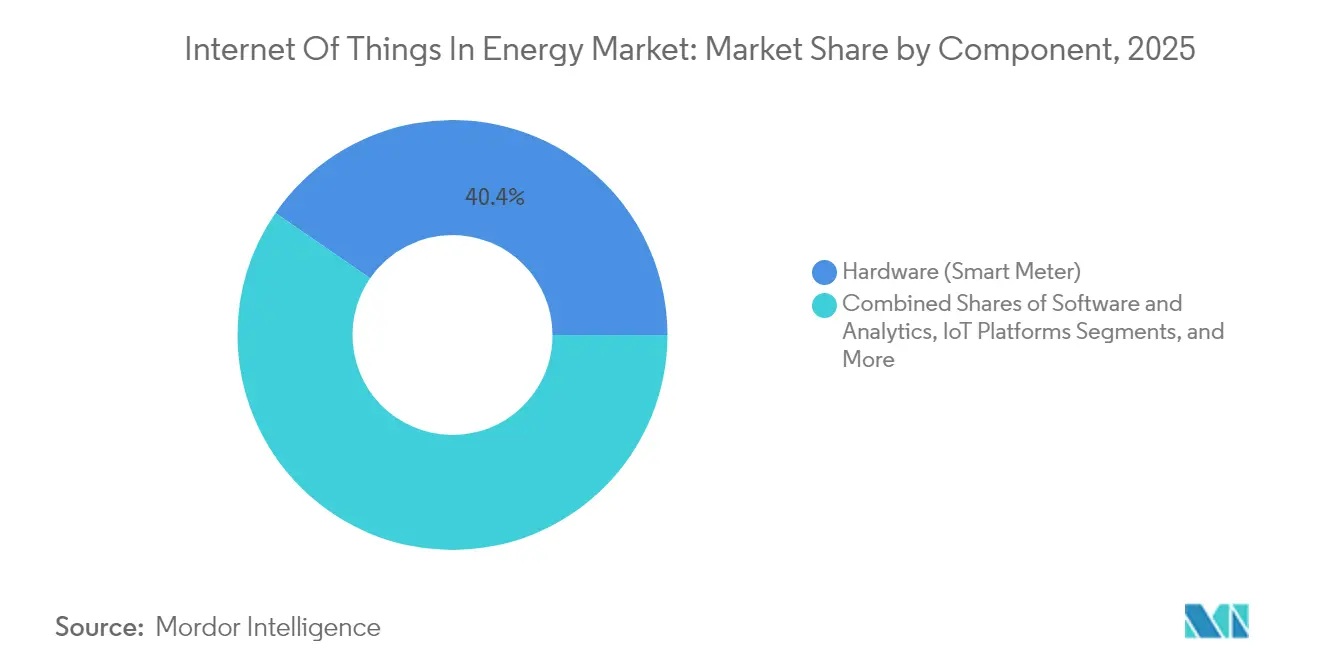
- By component, hardware captured 40.40% of Internet of Things in the energy market share in 2025, while IoT security is poised to expand at a 17.35% CAGR through 2031.
- By application, smart grid monitoring led with 38.10% revenue share in 2025; connected EV infrastructure is projected to post the fastest 15.05% CAGR to 2031.
- By connectivity technology, cellular solutions accounted for 53.50% share of the Internet of Things in the energy market size in 2025, whereas satellite IoT connections are forecast to grow at an 18.2% CAGR.
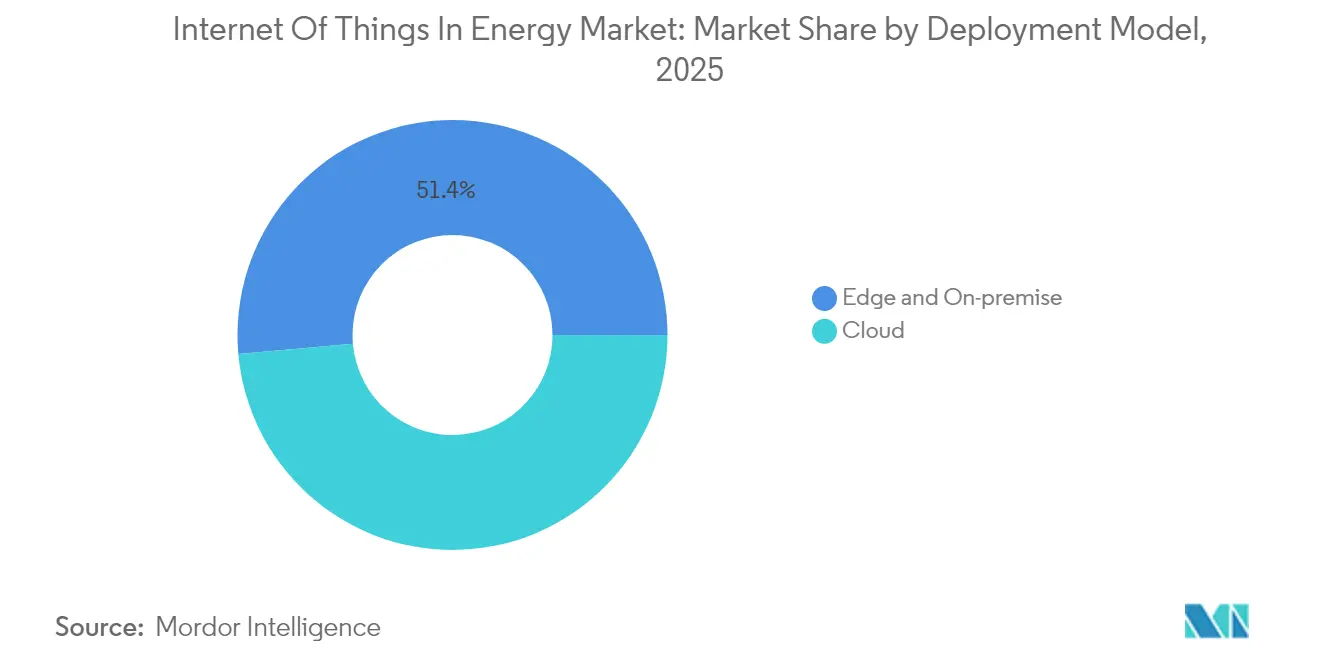
- By deployment model, cloud-hosted platforms commanded 48.60% revenue in 2025 and also headline growth with an 17.65% CAGR through 2031.
- By end user, electric and gas utilities held a 45.40% share of the Internet of Things in the energy market size in 2025; renewable power plants are advancing at a 16.05% CAGR.
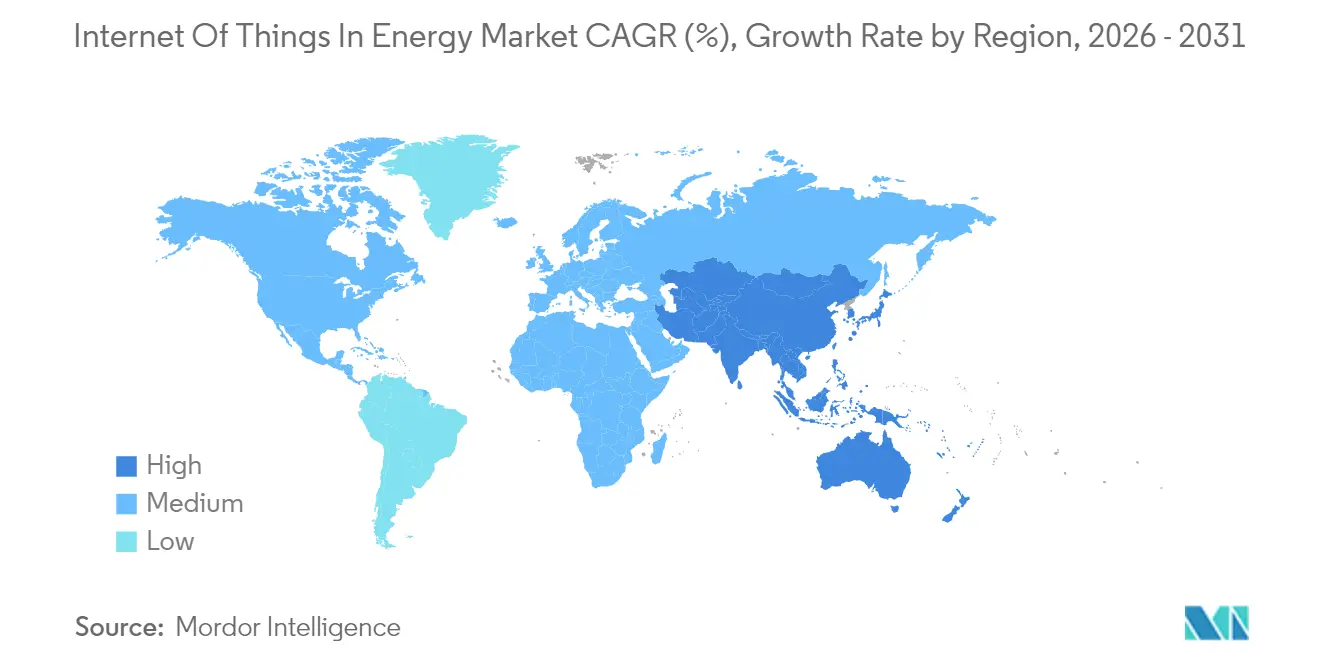
- By geography, North America dominated with 37.60% share, while Asia Pacific is on track for the strongest 16.58% CAGR.
Note: Market size and forecast figures in this report are generated using Mordor Intelligence’s proprietary estimation framework, updated with the latest available data and insights as of 2026.
Global Internet Of Things In Energy Market Trends and Insights
Drivers Impact Analysis*
| Driver | (~) % Impact on CAGR Forecast | Geographic Relevance | Impact Timeline |
|---|---|---|---|
| Utility smart-meter roll-outs and grid modernization mandates | +3.2% | Global, higher in North America and EU | Medium term (2-4 years) |
| Falling 5G/LPWAN module costs | +2.8% | Global, especially APAC hubs | Short term (≤ 2 years) |
| Distributed-renewable orchestration needs | +2.1% | Europe and APAC core, spill-over to North America | Long term (≥ 4 years) |
| AI-driven predictive-maintenance ROI cases | +1.9% | North America and EU industrial corridors | Medium term (2-4 years) |
| Flexibility monetisation (V2G, P2P energy) | +1.6% | EU zones, early adoption in California | Long term (≥ 4 years) |
| Carbon-accounting data regulations | +1.4% | EU, expanding to North America and APAC | Medium term (2-4 years) |
| Source: Mordor Intelligence | |||
Utility Smart-Meter Roll-Outs and Grid-Modernization Mandates
Mandated advanced metering infrastructure has moved beyond the pilot stage as regulators demand visibility of low-voltage networks and demand response outcomes. Honeywell and Verizon now embed native 5G radios into meters, enabling remote firmware updates, self-healing mesh communication, and autonomous service disconnects.[1]Honeywell International, “Honeywell Integrates 5G into Smart Meter Portfolio,” honeywell.com Norway completed nationwide roll-outs yet only 29.5% of households checked live consumption data, underscoring that consumer engagement and intuitive apps decide whether hard savings materialize. Utilities therefore pair technical deployment with customer education, gamified dashboards, and tariff incentives. Advanced meters feed granular interval data to distribution management systems so that rooftop solar back-feed and electric vehicle (EV) clustering can be forecast and balanced without over-building capacity.
Falling 5G/LPWAN Module Cost
Chip supply normalization pushed narrow-band IoT module prices down by 28% between 2023 and 2025, removing a key cost barrier for high-volume sensor roll-outs. Laboratory tests show LTE-M offers higher throughput and lower energy consumption than many alternative low-power protocols, which is important where battery swaps are costly. Semiconductor makers are redesigning micro-controllers with integrated AI acceleration so that anomaly detection can occur at the edge. Research teams have proved that turning LoRa gateways into lightweight compute nodes trims backhaul traffic by 70% without breaking legacy payload formats. Energy firms now equip remote wind farms, rural substations, and valve arrays with these modules, placing asset intelligence where trucks rarely visit.
Distributed-Renewable Orchestration Needs
Variable solar and wind output demands second-by-second coordination across scores of devices scattered over thousands of kilometres. Blockchain-enabled virtual power plants are aggregating households, industry sites, and community energy resources, letting automated smart contracts trade spare capacity while meeting grid codes. Australia’s national trials suggest that vehicle-to-grid chargers could eclipse every other storage class by mid-2030, saving households USD 550 each year and shaving regional peak demand by double-digit percentages.[2]Australian Renewable Energy Agency, “Vehicle-to-Grid in the National Electricity Market,” arena.gov.au Quantum algorithms tested on microgrid models have out-performed classical heuristics in cost minimisation and stability metrics, hinting at a new control stack for densely meshed local grids. Policy frameworks that open wholesale markets to flexibility services provide the commercial trigger for these orchestration platforms.
AI-Driven Predictive-Maintenance ROI Cases
Saudi utility portfolios achieved 40% maintenance cost reductions after coupling sensor networks with deep-learning models that forecast transformer and turbine degradation.[3]Saudi Ministry of Energy, “Smart Maintenance Initiative Progress Report,” energy.gov.sa Peer-reviewed studies record 92% fault-prediction accuracy, 35% fewer outages, and 8.5% higher renewable capacity factors when AI is applied to asset monitoring. Vistra Corp recouped more than USD 60 million in its first year of AI-enhanced SCADA operations while avoiding 2 million tonnes of CO₂. The payback math is convincing enough that power producers are baking AI line-items into every new-build or retrofit budget, reinforcing the upward trajectory of the Internet of Things in the energy market.
Restraints Impact Analysis*
| Restraint | (~) % Impact on CAGR Forecast | Geographic Relevance | Impact Timeline |
|---|---|---|---|
| Cyber-security and OT/IT convergence risk | -2.4% | Global, critical infrastructure in North America and EU | Short term (≤ 2 years) |
| Legacy-SCADA interoperability gaps | -1.8% | North America and EU regions with aging infrastructure | Medium term (2-4 years) |
| Edge-compute talent scarcity | -1.2% | Worldwide, acute in APAC | Medium term (2-4 years) |
| Semiconductor-supply volatility | -0.9% | Global chains, risk in APAC hubs | Short term (≤ 2 years) |
| Source: Mordor Intelligence | |||
Cyber-Security and OT/IT Convergence Risk
As operational equipment becomes routable on public networks, attack surfaces multiply. The EU Cyber Resilience Act will come into force in August 2025, obliging device makers to document software components and issue timely patches. Many substations still run legacy protocols that lack authentication, and intrusion studies show malware can pivot from billing servers to breaker controls in minutes if segmentation is weak. Over-the-air update pipelines, hardware root-of-trust, and zero-trust segmentation are becoming mandatory across new procurement frameworks. Effective governance hinges on closer collaboration between information-technology and operational-technology teams.
Legacy-SCADA Interoperability Gap
Distribution utilities must marry forty-year-old RTUs with IPv6 native sensors. Software-defined networking in digital substations can cut communication hardware counts by half, yet the retrofit is complicated by bespoke wiring looms and life-extension warranties. NB-IoT relay nodes that translate 6LoWPAN packets into IPv4 frames offer a bridging fix, but introduce extra latency and management complexity. Proof-of-concept work in remote gas pipeline sites has validated ESP32-driven gateways that harvest solar power, push data to cloud SCADA, and survive intermittent connectivity. Long change-out cycles mean the constraint will linger through the decade.
*Our forecasts treat driver/restraint impacts as directional, not additive. The impact forecasts reflect baseline growth, mix effects, and variable interactions.
Segment Analysis
By Component: Hardware Dominance Meets Security Acceleration
Smart meters, intelligent sensors, gateways, and edge controllers collectively secured 40.40% of the Internet of Things in the energy market share in 2025. The hardware wave anchors utility digital twins and pushes granular field data into analytics clouds. Security hardware modules and trusted execution environments gain notice because regulators now ask vendors to prove device integrity from chip to cloud. IoT security platforms are forecast to compound at 17.35% through 2031, twice the system average, as the cost of a single operational breach can erase multi-year efficiency savings. Edge servers built on ruggedised ARM or x86 boards are shipping with AI accelerators that handle fault detection in milliseconds. Toshiba recently unveiled a key-management chipset that signs firmware blobs before they touch the field device, trimming audit times for compliance reviewers.
Software and services follow hardware’s beachhead. Utilities are paying for full-stack offerings where the vendor bundles devices, connectivity, and a subscription dashboard. Managed service contracts appeal in regions short of data-science talent because they shift integration risk to the supplier. As a result, services revenue is taking a larger slice of the expanding Internet of Things in the energy market. Meanwhile, component suppliers are moving manufacturing closer to demand centres to buffer any geopolitical shock to semiconductor flows.


By Application: Grid Monitoring Leads While EV Infrastructure Surges
Real-time distribution grid monitoring accounted for 38.10% of 2025 revenue thanks to programs that instrument transformers, feeders, and voltage regulators. AI overlays adapt set-points on the fly so that networks avoid over-voltage when rooftop solar spikes midday. Connected EV infrastructure shows the fastest 15.05% CAGR because chargers double as both load and storage assets. Utilities view them as flexible nodes that can supply reactive power and soak up midday excess. Governments are subsidising bidirectional chargers and demanding open-protocol telemetry, which funnels more devices into the Internet of Things in the energy market.
Predictive maintenance sits close behind as renewable owners chase higher capacity factors. Offshore wind farms now integrate software-defined networking rings that maintain deterministic links to nacelle sensors despite harsh marine environments. Demand-response programs inside commercial buildings have trimmed peak kW draw by up to 86% during critical intervals. Industrial users deploy edge analytics to lower electricity per unit of output, a metric that directly feeds ESG scorecards and investor screens.
By Connectivity Technology: Cellular Dominance Challenged by Satellite Innovation
Cellular links carried 53.50% of connected endpoints inside the Internet of Things in the energy market during 2025, taking advantage of existing macro towers and SIM management systems. Private 5G slices entice wind farm and refinery operators because they promise deterministic quality of service at a known cost. Ericsson estimates payback periods of three years when productivity gains and safety improvements are monetised. Satellite IoT traffic, while small today, is rising at an 18.2% CAGR as new low-earth constellations drop per-megabit prices below USD 1. Remote hydro dams, cross-country pipelines, and offshore platforms all benefit because terrestrial networks stop at the shoreline.
Low-power wide-area networks such as NB-IoT and LoRaWAN dominate metering and environmental sensing where payloads are measured in bytes. Hybrid architectures are gaining favour: a sensor may default to LPWAN but fail over to satellite when signal quality dips. Utilities value this redundancy because service-level agreements for critical infrastructure now capture penalties for missed data windows.
By Deployment Model: Cloud Leadership with Edge Computing Acceleration
Cloud environments claimed 48.60% of market revenue in 2025 and are also forecast to post the fastest 17.65% CAGR. Utilities like the elastic compute and managed security updates that hyperscalers offer. Google Cloud and Carrier Global are co-building a home energy management suite that orchestrates thermostats, batteries, and solar inverters while off-loading heavy learning cycles to public regions.
Yet the pendulum is swinging toward a cloud-plus-edge paradigm for latency-critical control. Research confirms that 60-70% of smart-grid data is already processed locally so that feeder reclosers act within two cycles of a fault. Micro data centres packaged in substation-rated enclosures run Kubernetes clusters and auto-scale analytics pods at the grid edge. Vendors are exploring carbon-negative designs where waste heat warms equipment rooms in winter, saving auxiliary power costs.
By End User: Utility Dominance Shifts Toward Renewable Acceleration
Electric and gas utilities held 45.40% of global spending in 2025 because they shoulder responsibility for grid reliability, billing accuracy, and regulatory reporting. Their asset count runs into the millions, making them the natural anchor for the expanding Internet of Things in the energy market. Renewable power plant operators, however, are climbing fastest at 16.05% CAGR because performance analytics translate directly into increased revenue under availability-based contracts. Saudi Aramco has reported downtime cuts of 80% in upstream facilities after deploying AI-powered maintenance and leak-detection sensors.
Commercial and industrial facilities invest to hedge against volatile tariff structures and to pursue corporate net-zero pledges. Pharmaceutical plants have retrofitted legacy steam and chilled-water meters with wireless pulse transmitters so that energy managers can react to excursions inside a single shift. Prosumer households are becoming a meaningful cohort as smart-home platforms integrate batteries, solar arrays, and EV chargers into a unified algorithm.
Geography Analysis
North America commanded 37.60% of 2025 revenue for the Internet of Things in the energy market. Federal investment in grid resilience, state-level clean-energy standards, and a mature cellular footprint enable rapid adoption. Schneider Electric warns that data-centre load is climbing faster than substation build-outs, forcing utilities to deploy IoT sensors to squeeze every amp from existing lines. Canada’s remote microgrids are early satellite IoT adopters because fibre drops are expensive in permafrost. Mexico’s energy reform is attracting distributed solar investors who demand predictive analytics from day one.
Asia Pacific is the fastest-growing region at a 16.58% CAGR through 2031. Japan’s super-solar project targets 20 GW by 2030 using perovskite cells with a theoretical efficiency beyond 30%. China’s smart-grid rollout under the 14th Five-Year Plan includes multi-energy microgrids and 5G base stations embedded in transmission pylons. India’s renewables push blends IoT sensors with government-subsidised cloud hosting, while South Korean industrial parks equip factories with AI edge boxes to shave power peaks.
Europe shows steady expansion on the back of stringent carbon laws and cross-border balancing markets. The EU Cyber Resilience Act hard-codes security spending into every IoT budget. Germany’s Industry 4.0 initiatives mean factories integrate power-quality meters with production scheduling so that watt-hours per unit become a KPI as important as takt time. The United Kingdom’s public-sector energy efficiency program has already logged double-digit savings after building managers gained minute-level insights. France upgrades nuclear station cooling pumps with vibration sensors to extend operating licenses, and Nordic grid operators test market platforms for real-time flexibility. The Middle East and Africa are earlier in the curve but mega solar-and-storage projects linked to green-hydrogen plants guarantee future demand.

Competitive Landscape
The Internet of Things in the energy market is moderately fragmented. Traditional automation leaders such as Siemens, ABB, and Schneider Electric are buying niche software players to own the full device-to-cloud stack. Yokogawa’s purchase of BaxEnergy brings visibility across 120 GW of renewable assets and underlines the premium placed on specialized domain knowledge. Siemens picked up the 2025 Hermes Award for its Industrial Copilot, an AI assistant that cuts engineering hours and accelerates application deployment.
Technology giants are staking energy positions: Google partners with Carrier for residential optimisation; Microsoft embeds grid services in its Azure IoT Edge; Amazon invests in Satcom links that feed cloud-native energy analytics. Telecom operators collaborate with utilities to launch private 5G, bundling spectrum, devices, and managed security. Cybersecurity specialists such as Dragos and Claroty secure critical infrastructure, while start-ups build blockchain-powered peer-to-peer energy trading platforms. Edge-computing firms ship containerised micro data centres that combine power conditioning, cooling, and AI inference.
Intellectual-property filings cluster around predictive maintenance algorithms, post-quantum encryption for OT, and adaptive protection relays. Vendors advertise open-APIs but still pursue walled-garden ecosystems to lock in service revenue. Buyers respond by insisting on IEC-based interoperability tests before contract sign-off. The resulting negotiation dynamic keeps competition alive and pushes cost curves down, sustaining growth momentum in the Internet of Things in the energy market..
Internet Of Things In Energy Industry Leaders
AGT International
Cisco Systems Inc.
IBM Corporation
Intel Corporation
SAP SE
- *Disclaimer: Major Players sorted in no particular order

Recent Industry Developments
- June 2025: Generac Holdings acquired Neurio Technology to deepen residential energy management and grid-interactive capabilities.
- June 2025: Sakura Internet and JERA signed an MoU to co-locate data centres at LNG plants in Tokyo Bay, merging digital workloads with energy asset footprints.
- March 2025: Carrier Global and Google Cloud began joint development of AI-powered home energy management systems to ease grid strain
- March 2025: Siemens Industrial Copilot won the Hermes Award 2025 for generative-AI-driven industrial automation.


Global Internet Of Things In Energy Market Report Scope
IoT technology in the energy sector cuts costs and creates more productive connected buildings. The Internet of Things in the energy market provides different hardware, software, services, connectivity, and integrated solutions.
The Internet of Things in the Energy Market is segmented by Type (Hardware, IoT Software, IoT Platform, IoT Security, and IoT Services) and Geography. The market sizes and forecasts are provided in terms of value (USD million) for all the above segments.
| Hardware | Smart Thermostats |
| Smart Meters | |
| EV Charging Stations | |
| Other Hardware | |
| Software and Analytics | |
| IoT Platforms | |
| IoT Security | |
| IoT Services |
| Smart Grid Monitoring |
| Energy Management Systems |
| Predictive Maintenance |
| Connected EV Infrastructure |
| Distributed-Renewable Integration |
| Demand Response and Flexibility |
| Cellular (2G-5G) |
| LPWAN (NB-IoT, LoRaWAN, Sigfox) |
| Satellite IoT |
| Wi-Fi/BLE |
| PLC and Other |
| Cloud |
| Edge |
| On-premise |
| Electric and Gas Utilities |
| Oil and Gas Up/Mid/Down-stream |
| Commercial and Industrial Facilities |
| Residential and Prosumer |
| Renewable Power Plants |
| North America | United States | |
| Canada | ||
| Mexico | ||
| South America | Brazil | |
| Argentina | ||
| Europe | Germany | |
| United Kingdom | ||
| France | ||
| Russia | ||
| Asia Pacific | China | |
| India | ||
| Japan | ||
| South Korea | ||
| ASEAN | ||
| Rest of Asia Pacific | ||
| Middle East and Africa | Middle East | Saudi Arabia |
| Turkey | ||
| Africa | South Africa | |
| By Component | Hardware | Smart Thermostats | |
| Smart Meters | |||
| EV Charging Stations | |||
| Other Hardware | |||
| Software and Analytics | |||
| IoT Platforms | |||
| IoT Security | |||
| IoT Services | |||
| By Application | Smart Grid Monitoring | ||
| Energy Management Systems | |||
| Predictive Maintenance | |||
| Connected EV Infrastructure | |||
| Distributed-Renewable Integration | |||
| Demand Response and Flexibility | |||
| By Connectivity Technology | Cellular (2G-5G) | ||
| LPWAN (NB-IoT, LoRaWAN, Sigfox) | |||
| Satellite IoT | |||
| Wi-Fi/BLE | |||
| PLC and Other | |||
| By Deployment Model | Cloud | ||
| Edge | |||
| On-premise | |||
| By End-user | Electric and Gas Utilities | ||
| Oil and Gas Up/Mid/Down-stream | |||
| Commercial and Industrial Facilities | |||
| Residential and Prosumer | |||
| Renewable Power Plants | |||
| By Geography | North America | United States | |
| Canada | |||
| Mexico | |||
| South America | Brazil | ||
| Argentina | |||
| Europe | Germany | ||
| United Kingdom | |||
| France | |||
| Russia | |||
| Asia Pacific | China | ||
| India | |||
| Japan | |||
| South Korea | |||
| ASEAN | |||
| Rest of Asia Pacific | |||
| Middle East and Africa | Middle East | Saudi Arabia | |
| Turkey | |||
| Africa | South Africa | ||


Key Questions Answered in the Report
What is the current size of the Internet of Things in the energy market in 2026?
The market is valued at USD 34.26 billion in 2026 and is forecast to double to USD 67.98 billion by 2031.
Which component category holds the highest share?
Hardware, led by smart meters and edge gateways, captured 40.40% of Internet of Things in energy market share in 2025.
What application area is growing fastest?
Connected EV infrastructure is expanding at a 15.05% CAGR as bidirectional charging moves from pilot to scale.
How important is satellite connectivity for energy IoT?
Satellite IoT is forecast to rise at an 18.2% CAGR because it connects remote hydro, wind, and pipeline assets beyond cellular reach.
Which region will contribute most to future growth?
Asia Pacific is expected to post a 16.58% CAGR through 2031, driven by large-scale renewable deployments and smart-grid programs.
What are the main cybersecurity obligations after 2025?
The EU Cyber Resilience Act requires device makers to embed secure-by-design principles, maintain software bills of materials, and deliver timely patches for connected products.
Page last updated on:


