Multimodal AI Market Size and Share
Market Overview
| Study Period | 2020 - 2031 |
|---|---|
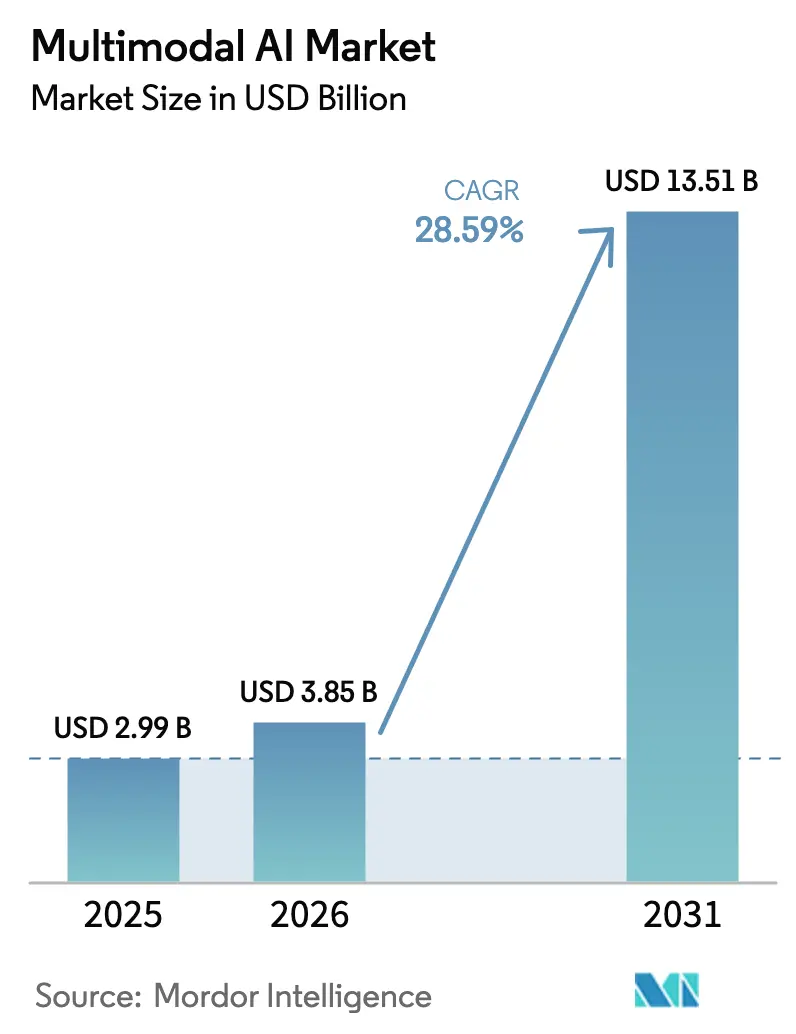
| Market Size (2026) | USD 3.85 Billion |
| Market Size (2031) | USD 13.51 Billion |
| Growth Rate (2026 - 2031) | 28.59% CAGR |
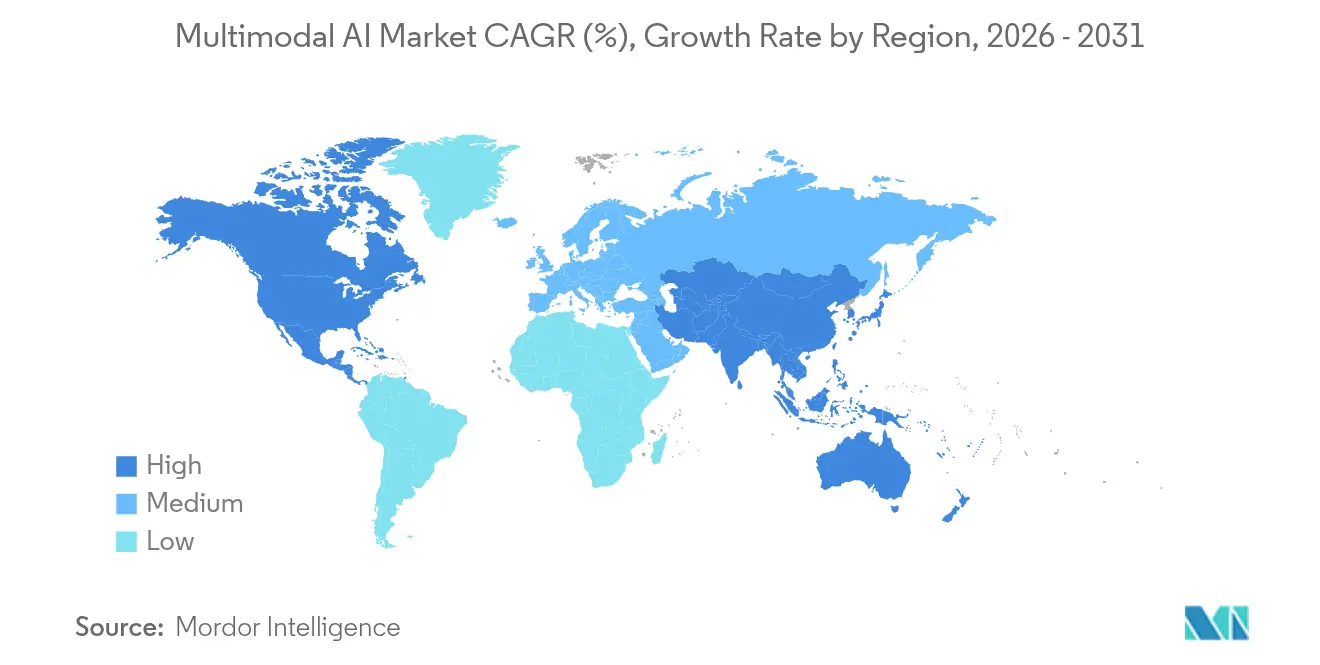
| Fastest Growing Market | Asia Pacific |
| Largest Market | North America |
| Market Concentration | Medium |
Major Players *Disclaimer: Major Players sorted in no particular order Image © Mordor Intelligence. Reuse requires attribution under CC BY 4.0. | |
Multimodal AI Market Analysis by Mordor Intelligence
multimodal AI market size in 2026 is estimated at USD 3.85 billion, growing from 2025 value of USD 2.99 billion with 2031 projections showing USD 13.51 billion, growing at 28.59% CAGR over 2026-2031. Sustained progress in transformer–diffusion architectures, a sharp drop in cloud-GPU pricing and a surge of venture funding have combined to accelerate enterprise adoption across manufacturing, healthcare and financial services. North America retains leadership thanks to heavy infrastructure spending, yet Asia-Pacific records the quickest uptake as national AI programs scale foundation-model deployments. Software platforms still dominate revenue, although service engagements are rising fast as organizations seek integration expertise. Regulatory milestones such as the European Union’s AI Act will shape compliance investments, while breakthroughs in cross-modal reasoning open fresh routes for product differentiation in the multimodal AI market.
Key Report Takeaways
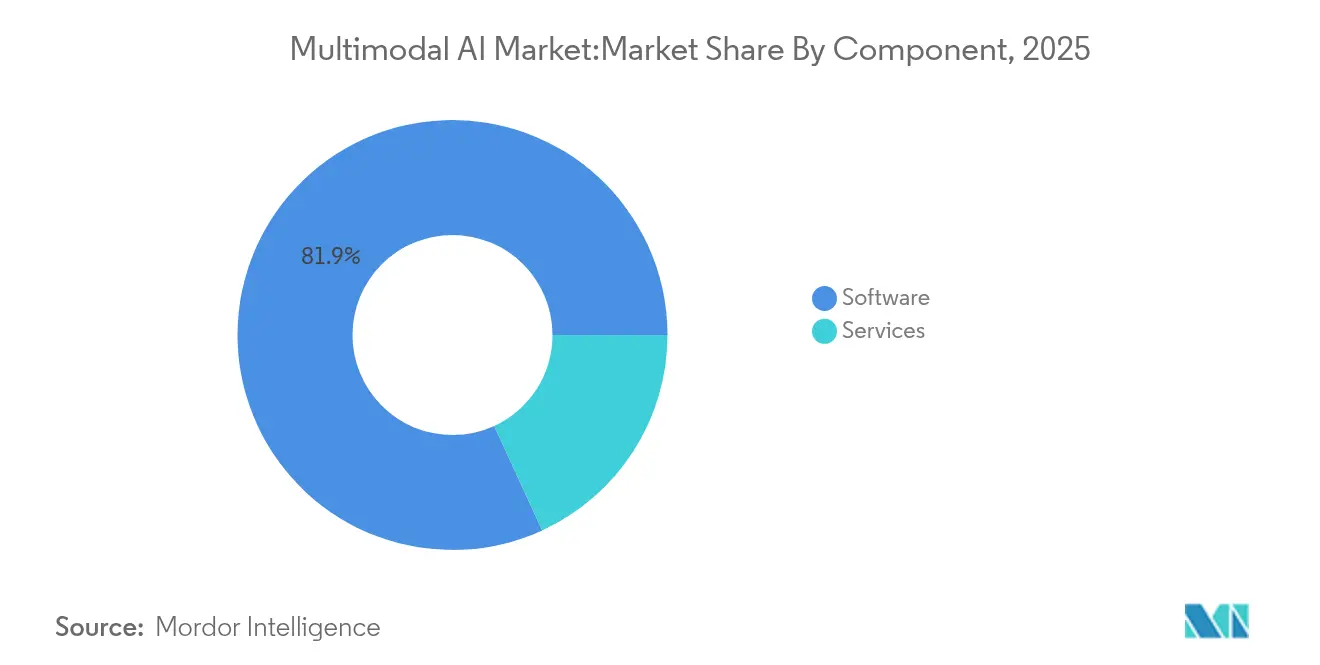
- By component, software held 81.85% revenue share in 2025; services are projected to grow at a 32.10% CAGR to 2031.
- By data modality, text led with 44.20% of the multimodal AI market share in 2025, while video processing is set to expand at a 39.80% CAGR through 2031.
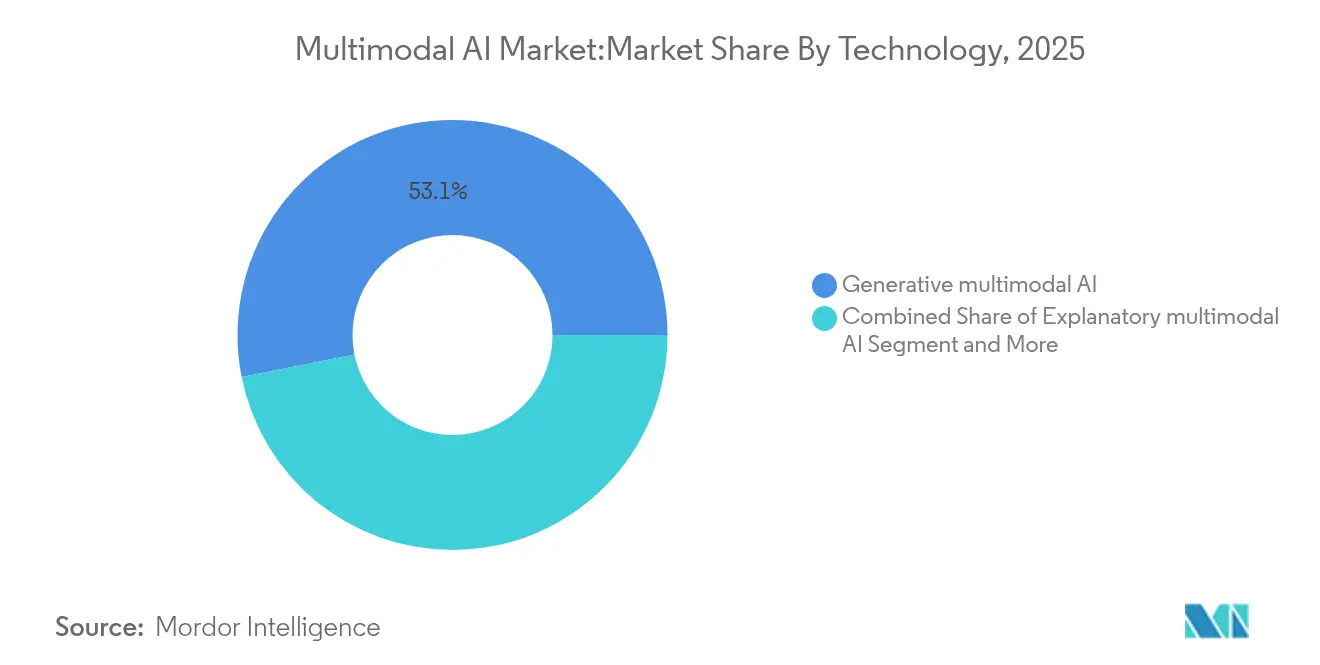
- By technology, generative multimodal AI accounted for a 53.12% share in 2025; interactive multimodal AI is forecast to post a 35.90% CAGR to 2031.
- By industrial vertical, healthcare and life sciences commanded 25.80% share of the multimodal AI market size in 2025; retail and e-commerce are expected to grow at a 33.20% CAGR through 2031.
- By geography, North America captured a 40.70% share in 2025, whereas Asia-Pacific is projected to register the highest 40.90% CAGR to 2031.
Note: Market size and forecast figures in this report are generated using Mordor Intelligence’s proprietary estimation framework, updated with the latest available data and insights as of 2026.
Global Multimodal AI Market Trends and Insights
Drivers Impact Analysis*
| Driver | (~) % Impact on CAGR Forecast | Geographic Relevance | Impact Timeline |
|---|---|---|---|
| Rapid adoption of AI across industries | +8.5% | Global, with a concentration in North America and Asia-Pacific | Medium term (2-4 years) |
| Advances in transformer and diffusion architectures | +6.2% | Global, led by US research institutions and Chinese tech giants | Short term (≤ 2 years) |
| Venture funding surge for foundation-model start-ups | +4.8% | North America and Europe, with spillover to Asia-Pacific | Medium term (2-4 years) |
| Cloud–GPU cost decline via usage-based billing | +3.9% | Global, with early adoption in North America | Short term (≤ 2 years) |
| Demand for multimodal agents in industrial digital twins | +3.2% | Europe and North America manufacturing hubs | Long term (≥ 4 years) |
| Accessibility regulations mandating multimodal outputs | +2.4% | EU and North America, with gradual Asia-Pacific adoption | Long term (≥ 4 years) |
| Source: Mordor Intelligence | |||
Rapid adoption of AI across industries
Enterprises scale multimodal projects as 87% of manufacturers launch generative AI pilots, improving visual inspection and predictive maintenance in automotive production lines. Healthcare providers deploy diagnostic systems that unify radiology scans, electronic records, and genomic data for higher accuracy in oncology decision support. Banking institutions correlate behavioral biometrics with transaction streams to raise fraud-detection precision. Similar gains arise in professional services and creative industries, propelling steady demand growth in the multimodal AI market.
Advances in transformer and diffusion architectures
Unified models such as Gemini 2.5 Pro reach 92% accuracy on mathematical reasoning benchmarks while processing text, images, and audio in a single network[1]Google, “Introducing Gemini 2.5 Pro,” ai.google. Multi-query attention and hardware-aware optimizations cut training compute by 40%, shrinking time-to-market for mid-sized enterprises and expanding the multimodal AI market. Performance gains translate into safer autonomous driving perception stacks and quicker medical-image triage, strengthening adoption momentum.
Venture funding surge for foundation-model start-ups
SoftBank-backed valuation discussions around OpenAI and EUR-scale rounds for firms like Mistral AI highlight risk-capital appetite for multimodal innovation. The funds accelerate specialist approaches in video understanding, digital agents and biology-specific models, deepening the solution pool and intensifying competition across the multimodal AI market.
Cloud-GPU cost decline via usage-based billing.
Elastic pricing on NVIDIA GB300 NVL72 clusters inside Google Cloud trims inference costs by up to 70% and lets start-ups train large multimodal models without up-front capital. Microsoft adds audio chat to GPT-4o Realtime Preview, showing how infrastructure upgrades unlock new product categories. Lower total cost of ownership speeds enterprise pilots, especially among mid-market firms that now enter the multimodal AI market earlier.
Restraint Impact Analysis*
| Restraint | (~) % Impact on CAGR Forecast | Geographic Relevance | Impact Timeline |
|---|---|---|---|
| Integration complexity for heterogeneous data streams | -4.2% | Global, particularly affecting enterprise deployments | Medium term (2-4 years) |
| High compute and energy cost of large models | -3.8% | Global, with acute impact in regions with high energy costs | Short term (≤ 2 years) |
| Scarcity of cross-modal benchmark datasets | -2.9% | Global research community, affecting model validation | Long term (≥ 4 years) |
| Edge-device memory and latency constraints | -2.1% | Asia-Pacific manufacturing and IoT deployments | Medium term (2-4 years) |
| Source: Mordor Intelligence | |||
Integration complexity for heterogeneous data streams
Projects consume as much as 80% of timelines on preprocessing because data arrives in inconsistent formats and time stamps. Healthcare deployments struggle to merge imaging archives with patient records under strict privacy rules, delaying roll-outs by 12-18 months. Manufacturers face similar hurdles when synchronizing sensor telemetry with camera feeds inside digital-twin platforms, limiting scale across the multimodal AI market.
High compute and energy cost of large models
Training a GPT-4o-class model can require 25,000 H100 GPUs running for months, with single-cycle costs above USD 50 million[2]NVIDIA, “Sustainability Report 2025,” nvidia.com. Rising data-center power demand elevates sustainability concerns; forecasts show AI using 9% of the United States' electricity by 2030, creating budget and carbon-compliance pressures that slow procurement in the multimodal AI market.
*Our forecasts treat driver/restraint impacts as directional, not additive. The impact forecasts reflect baseline growth, mix effects, and variable interactions.
Segment Analysis
By Component: Services Accelerate Despite Software Dominance
Software platforms accounted for 81.85% of 2025 revenue as mature development frameworks underpin most production deployments in the multimodal AI market. Buyers value turnkey model hubs and auto-pipeline orchestration that reduce coding overhead and support continuous integration. Yet services post a 32.10% CAGR to 2031 because successful deployments hinge on domain knowledge, regulatory mapping and custom tuning, activities only specialist integrators supply. Financial institutions partner with cloud hyperscalers for compliance-ready advisory bots, while manufacturers outsource digital-twin build-outs that link vision systems with maintenance logs. The shift from license to outcome-based contracting aligns provider incentives with return-on-investment targets, reinforcing service growth inside the multimodal AI market.Demand for architecture audits, bias testing and privacy engineering rises as regulations tighten.
Consulting teams craft data lineage frameworks and energy-efficient fine-tuning flows that internal IT groups lack. As more firms adopt multimodal agents for operations support, recurring optimization retains revenue streams beyond initial roll-out. This stickiness propels the services slice toward a larger share of future multimodal AI market size while software vendors bundle training credits and reference toolchains to protect margins.


By Data Modality: Video Processing Emerges as Growth Leader
Text retained 44.20% share in 2025 because natural-language processing remains the entry point for many enterprises exploring the multimodal AI market. Real-time video analysis grows at a 39.80% CAGR as temporal reasoning breakthroughs deliver autonomous driving perception, sports analytics and security surveillance. Image recognition continues to support pathology review and printed-circuit inspection, although growth moderates as these use cases mature.
Live-stream commerce and social platforms inject terabytes of video per second into enterprise workflows, prompting demand for scalable captioning, moderation and generation capabilities. Retailers roll out smart-shelf monitoring that fuses video with inventory feeds to limit stock-outs. Energy producers combine drone footage with sensor telemetry for remote asset inspection, showcasing cross-modal fusion benefits. Edge-optimized codecs reduce bandwidth overhead, permitting deployment in bandwidth-constrained sites. Such advances keep video the fastest-rising contributor to the multimodal AI market size and encourage ecosystem investment in specialized accelerators.
By Technology: Interactive Systems Drive Innovation
Generative systems held 53.12% of 2025 revenue by automating marketing copy, image synthesis and design iterations across the multimodal AI market. Interactive multimodal AI, which processes and responds to several input types in real time, grows at 35.90% CAGR on the back of conversational agents that manage complex workflows. Hospitals try bedside assistants that interpret clinician speech, vital-sign sensors and radiology images within a single query session, increasing care-plan accuracy.
Explanatory multimodal AI gains traction where transparent reasoning is mandatory, such as loan underwriting and drug safety review. Predictive stacks integrate tabular, textual and visual data to sharpen demand planning and fraud scoring. Translative engines convert spoken directions to on-screen diagrams, improving accessibility and cross-border collaboration. The blending of generation, interaction and explanation within cohesive orchestration hubs hints at future convergence inside the multimodal AI market.
By Industrial Vertical: Healthcare Leadership with Retail Momentum
Healthcare and life sciences represented 25.80% of 2025 spending, using multimodal image–record fusion to elevate diagnostic precision in oncology and cardiovascular care. Genomic labs pair sequencing data with phenotypic notes to accelerate target discovery. Hospitals pilot AI scribes that merge speech recognition with clinical-note summarization, freeing clinician time. These mission-critical wins sustain healthcare dominance inside the multimodal AI market.
Retail and e-commerce expand at 33.20% CAGR through personalized styling tools and augmented-reality try-ons that integrate camera feeds, text prompts and purchase histories. Big-box chains introduce aisle companions that converse with shoppers while scanning shelf layouts, reducing staff burden. The productivity upside pushes investment even among mid-tier merchants. Manufacturing, BFSI and transportation round out adoption, each exploiting domain-specific extensions of the multimodal AI industry.
Geography Analysis
North America kept 40.70% share in 2025, buoyed by USD 80 billion in new Microsoft data centers and Amazon’s USD 30 billion build-out in Pennsylvania and North Carolina. A dense research cluster, deep venture pools and a permissive regulatory stance sustain first-mover advantage. Canada nurtures sustainability use cases in mining and forestry, while Mexico applies multimodal inspection in export assembly plants. Despite leadership, the region faces talent competition as Asia-Pacific scales public-sector AI programs that attract researchers away from incumbents.
Asia-Pacific posts the fastest 40.90% CAGR to 2031 as China, Japan and India align national roadmaps with foundational AI. Beijing funds GPU clusters and open-source model benches, speeding domestic alternatives to Western offerings. Japan integrates multimodal robotics in smart-factory revamps, while India uses conversational agents in agriculture extension programs. ASEAN markets deploy cloud credits for small and medium enterprises, lowering entry thresholds and broadening the multimodal AI market.
Europe delivers steady progress under the AI Act, which balances innovation and risk controls. The European Commission earmarks EUR 200 billion for AI Factories that supply compute and compliance tooling. Germany embeds multimodal inspection in Industry 4.0 lines, France advances radiology-image triage, and the Nordics apply AI to maritime routing. Harmonized data-sovereignty rules help cross-border health-data projects, amplifying regional collaboration. Elsewhere, Gulf states and South America pursue green-field infrastructures, creating future battlegrounds for providers targeting the multimodal AI market.

Competitive Landscape
The multimodal AI market shows moderate concentration. Google, Microsoft, Meta and OpenAI invest heavily in frontier compute capacity and talent, but specialist entrants narrow performance gaps in niche contexts. Meta acquired 49% of Scale AI for USD 14.3 billion to accelerate annotation tooling, signalling a land-grab for data pipelines[3]Meta, “Meta Invests in Scale AI,” about.meta.com. NVIDIA spent USD 1 billion across fifty deals in 2024 to secure ecosystem alignment around its chips. Cloud hyperscalers move toward vertical integration, pairing custom silicon with proprietary orchestration layers, which raises switching costs.
Vertical specialists differentiate through domain accuracy and compliance readiness. Twelve Labs refines temporal video-understanding APIs, while Openstream.ai standardizes conversational macros for regulated workflows. Edge-focused vendors compress models for camera gateways and autonomous drones where latency budgets are strict.
Outcome-based pricing grows, with providers accepting revenue-share or performance-warranty terms to prove value. This evolution rewards players that deliver measurable gains rather than parameter counts within the multimodal AI market.
Multimodal AI Industry Leaders
Open AI
Alphabet Inc. (Google LLC)
Microsoft Corporation
Amazon Web Services Inc.
Meta Platforms Inc.
- *Disclaimer: Major Players sorted in no particular order

Recent Industry Developments
- January 2025: Microsoft announces USD 80 billion investment in AI data centers, with over half allocated to United States capacity to meet multimodal AI demand.
- June 2025: Meta closes USD 14.3 billion investment in Scale AI, creating an internal superintelligence lab.
- March 2025: NVIDIA, Google and Alphabet outline joint development of robotics accelerators, including Google Cloud adoption of NVIDIA GB300 NVL72 GPUs.
- March 2025: CoreWeave acquires Weights and Biases to combine hyperscale infrastructure with MLOps pipelines.


Research Methodology Framework and Report Scope
Market Definitions and Key Coverage
Our study defines the multimodal artificial intelligence (AI) market as total worldwide revenue generated by packaged software, developer platforms, and managed services that create, train, and run models able to process at least two data streams (text, image, video, audio, or sensor) and deliver integrated outputs. The 2025 baseline covers cloud, on-premise, and edge deployments sold commercially to enterprises and public agencies. According to Mordor Intelligence, these offerings generated USD 2.99 billion in 2025.
Scope exclusion. We deliberately leave out hardware accelerators, single-modal point solutions, and strictly in-house developments.
Segmentation Overview
- By Component
- Software / Solutions
- Services
- By Data Modality
- Text
- Image
- Audio
- Video
- Sensor / Multispectral
- By Technology
- Generative multimodal AI
- Explanatory multimodal AI
- Interactive multimodal AI
- Translative multimodal AI
- Predictive / Analytic multimodal AI
- By Industrial Vertical
- BFSI
- Government and Public Sector
- Healthcare and Life Sciences
- IT and Telecommunications
- Manufacturing
- Media and Entertainment
- Retail and E-commerce
- Transportation and Logistics
- Others (Energy, Education, etc.)
- By Geography
- North America
- United States
- Canada
- Mexico
- South America
- Brazil
- Argentina
- Rest of South America
- Europe
- United Kingdom
- Germany
- France
- Italy
- Spain
- Nordics
- Rest of Europe
- Middle East and Africa
- Middle East
- Saudi Arabia
- United Arab Emirates
- Turkey
- Rest of Middle East
- Africa
- South Africa
- Egypt
- Nigeria
- Rest of Africa
- Middle East
- Asia-Pacific
- China
- India
- Japan
- South Korea
- ASEAN
- Australia
- New Zealand
- Rest of Asia-Pacific
- North America
Detailed Research Methodology and Data Validation
Primary Research
We speak with platform engineers, cloud integrators, AI chip providers, and enterprise buyers across North America, Europe, and Asia-Pacific, while brief surveys capture average API volumes and seat pricing that refine service-mix ratios. These interactions validate desk findings and surface live drivers such as parameter-count inflation and inference-hour uptake.
Desk Research
Mordor analysts begin with public datasets from the US Bureau of Economic Analysis, Eurostat digital-economy surveys, Japan's MIC ICT statistics, WIPO patent filings, and IEEE Xplore articles that benchmark multimodal models, anchoring macro spend and adoption signals.
We then review company 10-Ks, investor decks, trade-association white papers, and subscription inputs from D&B Hoovers and Dow Jones Factiva to map vendor revenue splits, pricing moves, and partnership flows. The list is illustrative. Many further references inform data checks and clarifications.
Market-Sizing & Forecasting
We first allocate global AI software spend to multimodal workflows using production data shares, patent prevalence, and venture-funding ratios, and then cross-check totals with sampled API call-volume times average price roll-ups. Core inputs include accelerator shipments, cloud inference hours, token pricing, multimodal patent filings, and regulatory guidance on synthetic media. Five-year forecasts emerge from ARIMA models stress-tested under three macro scenarios, and scaling factors drawn from survey feedback close gaps left by private vendors.
Data Validation & Update Cycle
Our analysts run variance tests against GPU spot prices, open-source model downloads, and quarterly disclosures before senior review. Reports refresh annually, with off-cycle revisions after material events, before an analyst re-checks numbers for delivery.
Why Our Multimodal AI Baseline Commands Reliability
We observe that published values differ because firms slice the opportunity by distinct modality mixes, product bundles, and starting years. Many omit services, freeze currency at historic rates, or project image-only adoption across every use case, which skews totals.
External releases put the market at USD 1.73 billion in 2024 and USD 1.0 billion in 2023 respectively.
Benchmark comparison
| Market Size | Anonymized source | Primary gap driver |
|---|---|---|
| USD 2.99 B (2025) | Mordor Intelligence | NA |
| USD 1.73 B (2024) | Regional Consultancy A | Excludes services and SMEs, focuses on software in North America only |
| USD 1.00 B (2023) | Global Consultancy B | Older base year and constant 2022 FX rates; hardware and services omitted |
The comparison shows our figure sits between early conservative counts and narrow modality extrapolations, because every assumption links to observable metrics and is re-verified with practitioners. Decision-makers gain a balanced, transparent baseline.


Key Questions Answered in the Report
What is the current size of the multimodal AI market?
The multimodal AI market size stands at USD 3.85 billion in 2026 and is forecast to reach USD 13.51 billion by 2031.
Which region is growing fastest in the multimodal AI market?
Asia-Pacific records the highest 40.90% CAGR through 2031, propelled by national AI initiatives and private investment.
Which component segment will expand most rapidly?
Services are projected to grow at a 32.10% CAGR as enterprises seek integration expertise for complex multimodal deployments.
Why is video processing gaining momentum?
Real-time video analytics advances and rising live-stream content volumes push video processing to the highest 39.80% CAGR.
What are the chief restraints on market growth?
Integration complexity across heterogeneous data sources and the high compute-energy cost of large models are the leading barriers.
How concentrated is competition in the multimodal AI market?
The market scores 6 on a 1-10 scale, indicating moderate concentration where leading hyperscalers coexist with agile specialists.
Page last updated on:


