AI Image Recognition Market Size and Share
Market Overview
| Study Period | 2020 - 2031 |
|---|---|
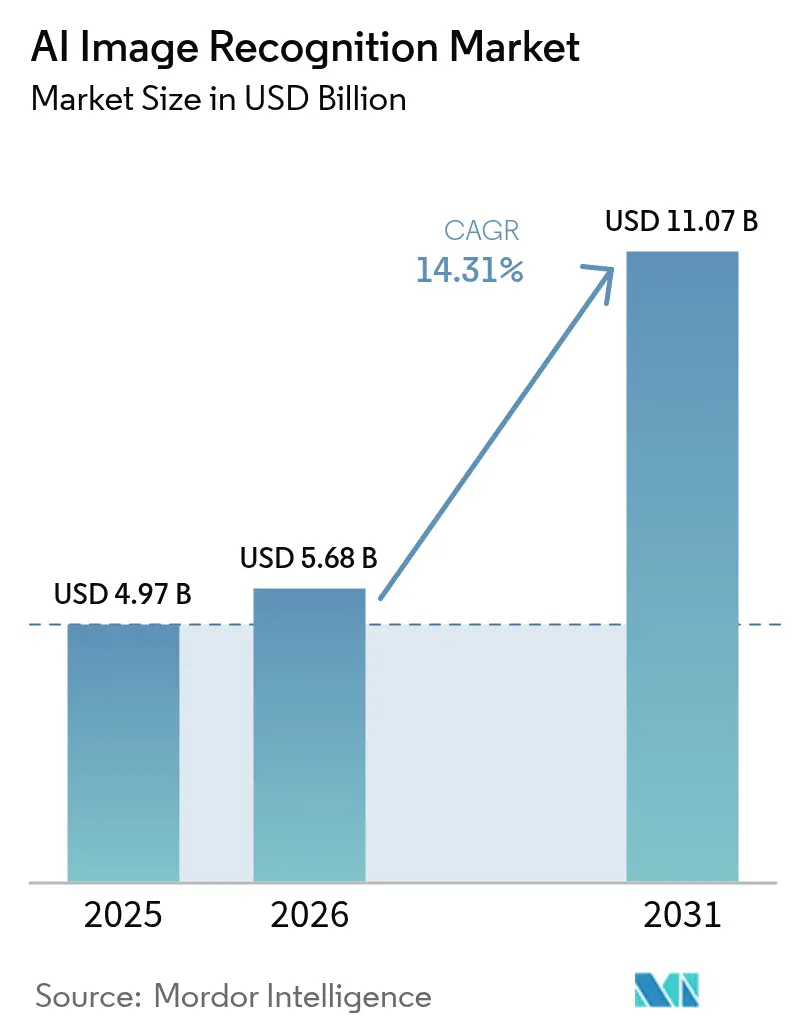
| Market Size (2026) | USD 5.68 Billion |
| Market Size (2031) | USD 11.07 Billion |
| Growth Rate (2026 - 2031) | 14.31% CAGR |
| Fastest Growing Market | Asia Pacific |
| Largest Market | North America |
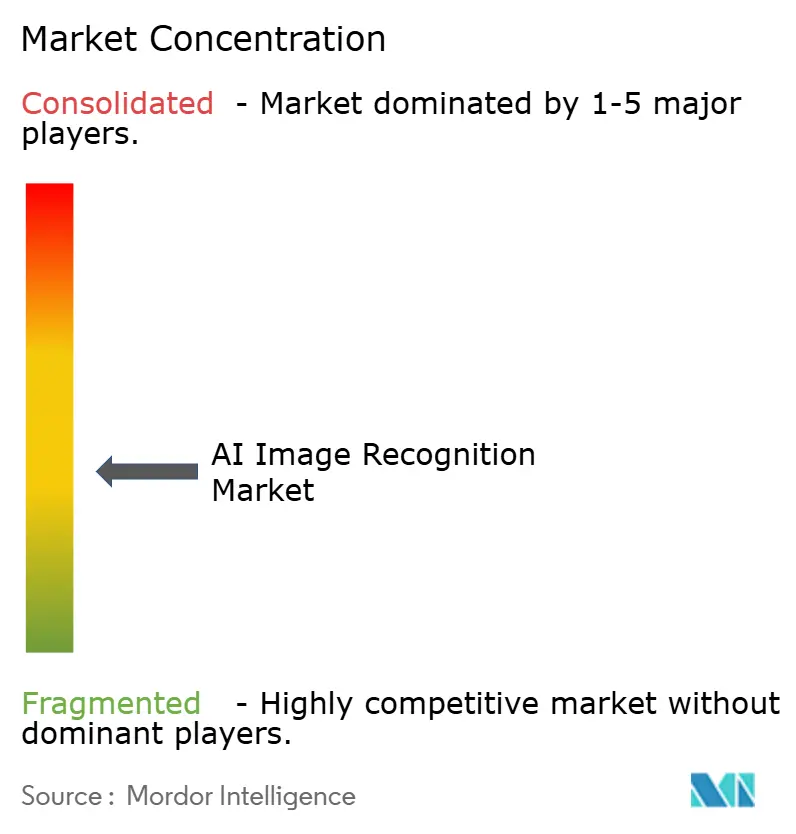
| Market Concentration | Medium |
Major Players *Disclaimer: Major Players sorted in no particular order Image © Mordor Intelligence. Reuse requires attribution under CC BY 4.0. | |
AI Image Recognition Market Analysis by Mordor Intelligence
The AI image recognition market size was valued at USD 4.97 billion in 2025 and estimated to grow from USD 5.68 billion in 2026 to reach USD 11.07 billion by 2031, at a CAGR of 14.31% during the forecast period (2026-2031). This expansion is rooted in enterprise reliance on automated visual intelligence that now stretches from factory floors to diagnostic suites. Falling silicon costs, multimodal foundation models, and maturing edge hardware keep total cost of ownership on a downward trajectory, making large-scale rollouts economically viable. Vendors redirect capital toward vertically integrated stacks that bundle chips, software, and services, streamlining procurement cycles and boosting deployment velocity. Meanwhile, synthetic data engines shrink labeling budgets, broadening participation for mid-sized firms that previously lacked annotated imagery. Collectively, these trends position the AI image recognition market for durable double-digit growth.
Key Report Takeaways
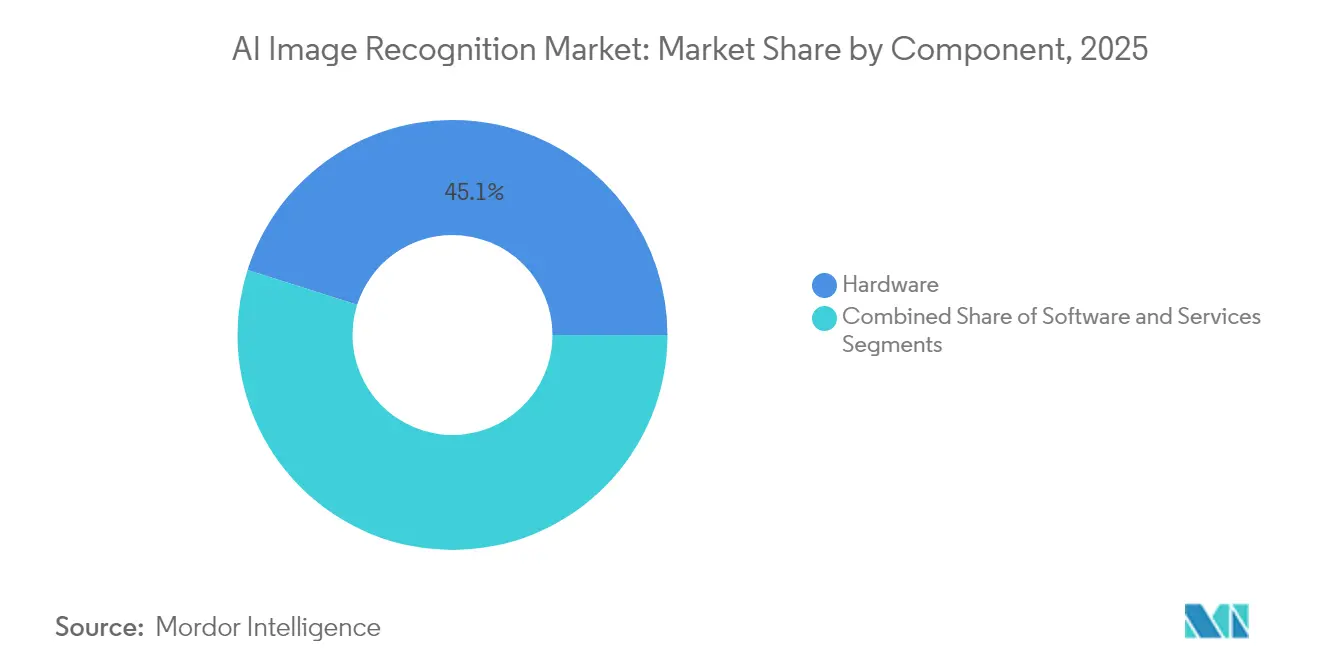
- By component, hardware commanded 45.12% of AI image recognition market share in 2025, whereas services are projected to expand at a 14.67% CAGR through 2031.
- By deployment model, on-premise solutions held 67.95% of the AI image recognition market size in 2025, while cloud deployment is on track for a 16.37% CAGR to 2031.
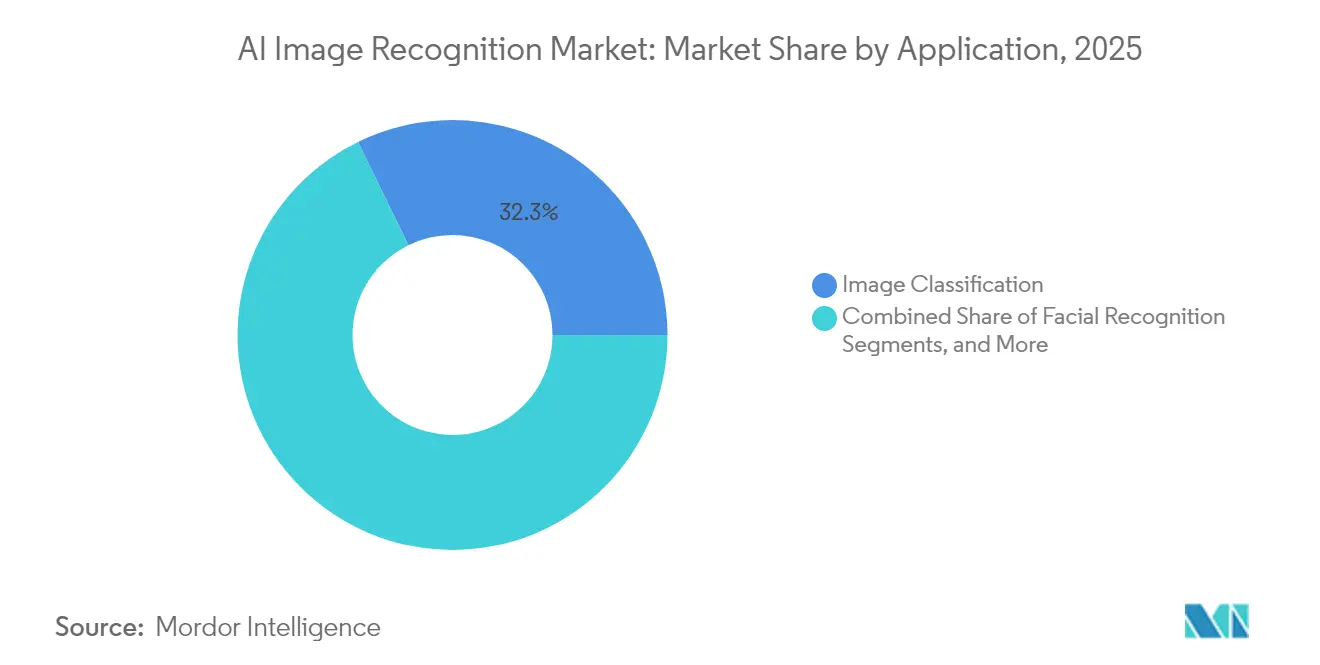
- By application, image classification contributed 32.25% of AI image recognition market size in 2025, yet industrial inspection advances at a 16.22% CAGR through the forecast horizon.
- By end-user industry, retail and e-commerce captured 28.74% revenue share of the AI image recognition market size in 2025; healthcare is the fastest-growing user group at a 15.05% CAGR.
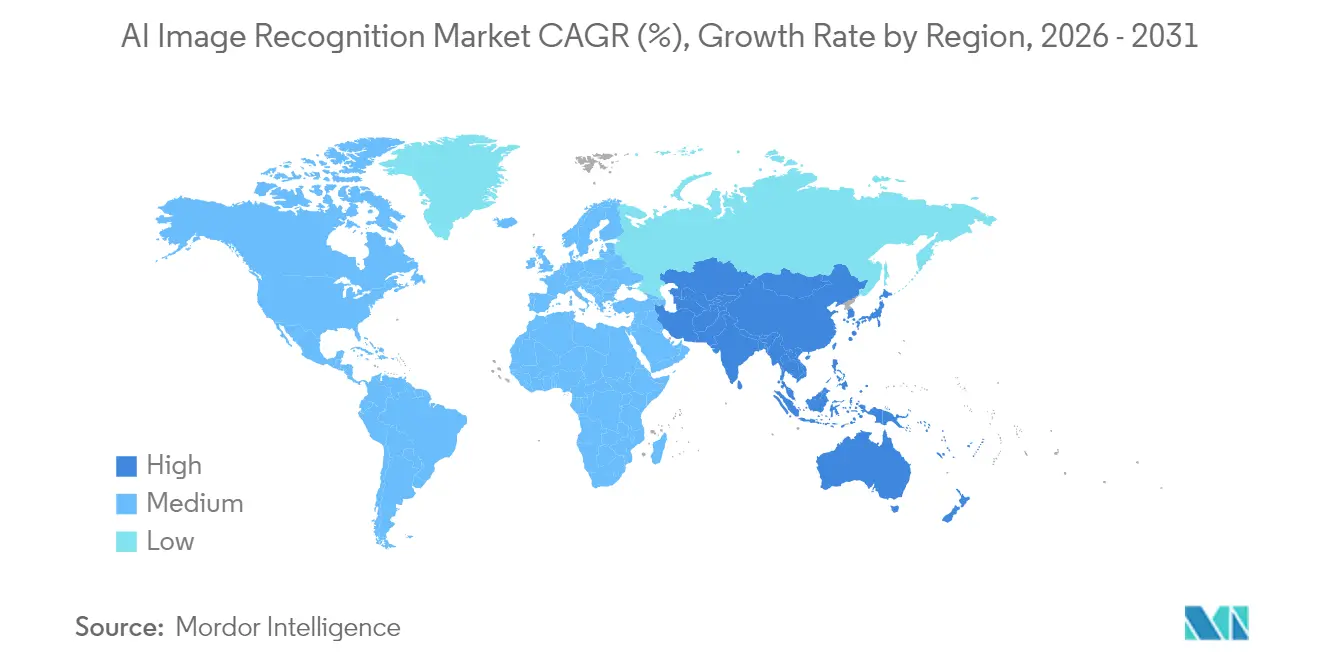
- By geography, North America captured 27.35% revenue share of the AI image recognition market size in 2025; Asis-Pacific is the fastest-growing on track for a 15.61% CAGR to 2031.
Note: Market size and forecast figures in this report are generated using Mordor Intelligence’s proprietary estimation framework, updated with the latest available data and insights as of 2026.
Global AI Image Recognition Market Trends and Insights
Drivers Impact Analysis*
| Driver | (~) % Impact on CAGR Forecast | Geographic Relevance | Impact Timeline |
|---|---|---|---|
| Cloud-native AI adoption boom | +2.8% | Global, with concentration in North America and EU | Medium term (2-4 years) |
| Proliferation of high-resolution cameras | +2.1% | Global, led by Asia-Pacific manufacturing hubs | Short term (≤ 2 years) |
| Retail loss-prevention initiatives | +1.9% | North America and EU retail corridors | Short term (≤ 2 years) |
| Expansion of Smart Cities and Surveillance Infrastructure | +2.4% | Asia-Pacific core, spill-over to MEA | Long term (≥ 4 years) |
| Synthetic data pipelines slashing labeling cost | +1.7% | Global, early adoption in tech centers | Medium term (2-4 years) |
| Satellite imagery firms open-sourcing labeled sets | +1.3% | Global, concentrated in research institutions | Long term (≥ 4 years) |
| Source: Mordor Intelligence | |||
Cloud-Native AI Adoption Boom
Hyperscale providers deliver containerized vision pipelines that push models from prototype to production inside weeks, trimming time-to-value for manufacturers and retailers. Microsoft Azure and Google Cloud showcase packaged defect-detection blueprints that lower entry barriers for firms with limited ML staff. Kubernetes-orchestrated inference endpoints allocate compute only when imagery arrives, enabling 15–40% cost savings versus fixed on-premise clusters. As a result, the AI image recognition market benefits from faster procurement cycles and broader user diversity.[1]Google Cloud, “AutoML Vision Product Page,” cloud.google.com
Proliferation of High-Resolution Cameras
Fifth-generation automotive ADAS units and 8K industrial sensors now pair with on-device AI accelerators that deliver sub-50 ms inference without network round-trips. Continental’s MFC525 camera offers a 110-degree field of view while performing object classification locally, and Samsung’s latest neural engines hit 38 TOPS inside consumer smartphones. These capabilities unlock real-time quality control and immersive AR functions, widening the addressable base of the AI image recognition market. [2]Continental Automotive, “MFC525: Fifth Generation Camera for ADAS,” continental.com
Retail Loss-Prevention Initiatives
Shrinkage drains billions from global retailers, but AI-enabled video analytics detect anomalous behavior with 85% accuracy and reduce false alarms by 60%. Deployments at Walmart and Carrefour demonstrate direct ROI within 12 months, propelling adoption in convenience and big-box formats alike. Gains extend to shelf-stock monitoring, tightening inventory accuracy and elevating the value proposition for the AI image recognition market. [3]Veesion, “AI Theft Detection Technology Overview,” veesion.co
Synthetic Data Pipelines Slashing Labelling Cost
Domain-randomized, photorealistic datasets now train vision models with 90% less manual labeling effort. Automotive OEMs feed synthetic lane-mark images into perception stacks, shortening validation cycles and supporting faster over-the-air model updates. These savings enlarge budgets for additional use cases within the AI image recognition market. [4]NVIDIA Corporation, “Q1 FY2026 Financial Results,” nvidia.com
Restraints Impact Analysis*
| Restraint | (~) % Impact on CAGR Forecast | Geographic Relevance | Impact Timeline |
|---|---|---|---|
| Data-privacy and compliance hurdles | -1.8% | EU and California leading, global adoption | Medium term (2-4 years) |
| Shortage of domain-specific talent | -1.4% | Global, acute in emerging markets | Long term (≥ 4 years) |
| GPU supply chain geopolitics elevating capex risk | -2.1% | Global, concentrated in Asia-Pacific | Short term (≤ 2 years) |
| Rising legal exposure from biased algorithms | -1.2% | North America and EU regulatory focus | Medium term (2-4 years) |
| Source: Mordor Intelligence | |||
Data-Privacy and Compliance Hurdles
The EU AI Act and California statutes impose robust audit trails, inflating validation costs by up to 30% for medical-imaging deployments. Conflicting data-residency mandates compel dual-stack architectures, slowing rollouts among mid-size hospitals that lack dedicated privacy teams. Such friction tempers growth momentum in the AI image recognition market.
GPU Supply Chain Geopolitics Elevating Capex Risk
Twelve-month lead times for advanced GPUs inflate project budgets and push enterprises toward FPGA or ASIC alternatives, demanding new toolchains and extending integration timelines. These uncertainties weigh on near-term hardware procurement across the AI image recognition market.
*Our forecasts treat driver/restraint impacts as directional, not additive. The impact forecasts reflect baseline growth, mix effects, and variable interactions.
Segment Analysis
By Component: Hardware Dominance Faces Services Disruption
Hardware controlled 45.12% of 2025 revenue, yet services post a 14.67% CAGR that outpaces all other categories. Edge-ready cameras and inference chips from NVIDIA and Intel lower latency below 50 ms, energizing brownfield retrofits in manufacturing plants. Software, especially low-code model-ops platforms, eases custom pipeline creation for firms without deep data-science benches. Meanwhile, professional services providers craft domain-tuned datasets and continuous-learning workflows that elevate production accuracy beyond initial proof points. This shift toward holistic outcomes rather than discrete products broadens wallet share for integrators inside the AI image recognition market.


By Deployment Model: Cloud Acceleration Challenges On-Premises Dominance
On-premises systems retained 67.95% revenue in 2025 because hospitals, banks, and defense agencies must keep imagery within local firewalls. Edge scenarios in mines, ships, and remote factories mirror this preference, where intermittent connectivity precludes cloud round-trips. Even so, cloud workloads grow at 16.37% CAGR as elastic GPU pools absorb seasonal or burst-heavy image pipelines. Hybrid topologies marry edge preprocessing with cloud retraining, letting enterprises tune inference at the edge while leveraging petascale datasets centrally. This blended paradigm safeguards compliance yet benefits from hyperscaler economics, reinforcing long-run expansion of the AI image recognition market.
By Application: Industrial Inspection Disrupts Traditional Hierarchies
Image classification still contributes 32.25% of 2025 spending, powering content moderation, catalog tagging, and basic surveillance. Object detection and tracking remain staples in logistics and mobility. Industrial inspection, however, registers the fastest 16.22% CAGR as automotive, electronics, and packaging plants pursue zero-defect mandates. Vision-guided inspection swaps human sampling for 100% coverage, elevating first-pass yield and compressing warranty costs. Because inspection datasets are proprietary, vendors with domain competence secure stickier contracts, lifting service revenue inside the AI image recognition market.
By End-User Industry: Healthcare Acceleration Reshapes Market Dynamics
Retail and e-commerce led 2025 with 28.74% revenue share thanks to loss-prevention rollouts, planogram analytics, and frictionless checkout pilots. Yet healthcare is scaling fastest at a 15.05% CAGR as radiology backlogs lengthen. AI triage tools cut scan-to-report intervals by 30%, freeing radiologists for complex reads. Multimodal models fuse CT imagery with electronic health records to flag high-risk cases sooner, reducing adverse events. Regulatory clearances in the United States and Japan catalyze wider hospital uptake, expanding the clinical footprint of the AI image recognition market.
Geography Analysis
North America held 27.35% revenue in 2025, buoyed by a dense funding ecosystem and domestic chip fabrication initiatives such as TSMC’s USD 165 billion Arizona campus. Corporate M&A, evidenced by Meta’s USD 14.8 billion stake in Scale AI, intensifies regional R&D velocity. Government incentives for semiconductor resilience further anchor the AI image recognition market in the United States and Canada.
Europe exhibits moderated yet steady adoption, framed by the bloc’s stringent AI Act. German heavy-industry leaders weave vision into automated assembly, while French startups refine clinical decision support under GDPR safeguards. Investment remains disciplined but targeted, favoring vendors able to certify transparency and bias mitigation. Such rigor shapes solution design across the AI image recognition market.
Asia-Pacific shows the highest trajectory at 15.61% CAGR. China allocates multiyear budgets topping USD 70 billion for smart-city and surveillance grids. Japan’s USD 65 billion semiconductor program and South Korea’s leadership in HBM memory create a vertically integrated supply base. India’s developer pool sustains global model-tuning services at competitive rates, collectively accelerating the AI image recognition market.

Regulatory Landscape
Regulatory landscape for AI image recognition is tightening around transparency, risk management, and biometric-use constraints, with the EU Artificial Intelligence Act (Regulation (EU) 2024/1689) providing a major global compliance anchor. The Act introduces obligations for high-risk AI systems, including biometric identification and certain safety-critical use cases, requiring technical documentation, risk management, and human oversight, and it fully applies from 2 August 2026. In parallel, the United States continues to rely heavily on guidance and voluntary frameworks such as NIST AI RMF 1.0 for governance and controls, which many multinational buyers use as a procurement baseline for auditability, bias mitigation, and model lifecycle management.
In China, national standardization is adding region-specific requirements tied to AI-generated content: GB 45438-2025 (Cybersecurity technology, labeling method for content generated by artificial intelligence) was released on 28 February 2025 and implemented on 1 September 2025, pushing providers to add labeling and detection features that touch image pipelines and downstream distribution. These overlapping regimes increase compliance engineering effort for global vendors, shaping architecture choices such as on-premises deployments for regulated imagery, dual-stack data residency designs, and the integration of synthetic-media detection and provenance tooling into commercial offerings.
Value Chain Analysis
The value chain begins with data capture and sensing (cameras, industrial sensors, mobile devices) and continues into data preparation (collection, labeling, synthetic data generation), model development (training, evaluation, MLOps), and deployment (edge inference hardware, on-premise servers, and cloud AI platforms). Upstream leverage sits with compute and acceleration vendors as GPU and edge-AI availability influences project timing and bill of materials, while hyperscalers and platform providers package vision services, model endpoints, and observability that speed time-to-production. Downstream, system integrators and vertical solution builders translate generic recognition models into workflows for inspection, loss prevention, surveillance, and medical imaging, where domain data and process knowledge drive differentiation.
Recent industrial and logistics programs show how value accrues in application-layer deployments that reuse existing camera networks and operational systems. Examples include APSEZ expanding its partnership with Kaleris in June 2026 to deploy AI-augmented terminal operating systems across 15 container terminals, and EAIGLE partnering with PortCity in July 2026 to scale computer-vision-based gate and yard automation by turning camera infrastructure into active data-capture points. These moves highlight the role of edge deployment, integration with operational software, and continuous model tuning as the key monetization points, with services and lifecycle support increasingly bundled alongside hardware and software to sustain performance in real-world environments.
Competitive Landscape
Industry concentration is moderate as platform players chase full-stack control. NVIDIA dominates training silicon with an estimated 80% share of data-center GPUs, reinforcing CUDA dependency across ISVs. Apple, Google, and Samsung launch bespoke neural processors to localize inference on phones and laptops, diluting reliance on external chips. Software pure-plays such as Clarifai forge alliances with Getty Images and Deepgram, layering multimodal cognition atop visual pipelines. Synthetic data specialists like Scale AI monetize dataset generation that feeds smaller entrants. Patent filings reveal intense activity around edge-optimized attention architectures, indicating future differentiation in power-constrained scenarios. Consolidation persists as large balances target niche expertise, raising the entry bar inside the AI image recognition market.
AI Image Recognition Industry Leaders
Google LLC (Alphabet Inc.)
Clarifai Inc.
IBM Corporation
Intel Corporation
Google (Alphabet)
- *Disclaimer: Major Players sorted in no particular order

Market Opportunities and Future Outlook
Compliance-driven transparency and synthetic-media identification is opening a clear product and services lane for image recognition vendors, especially where customers need machine-readable marking, detection, and reporting workflows. The EU AI Act (Regulation (EU) 2024/1689) sets concrete milestones, including obligations for certain transparency requirements as the Act phases in, and it fully applies from 2 August 2026, pushing enterprises and platforms to operationalize governance, logging, and content authenticity controls across image pipelines. Google’s May 2026 launch of an AI content detection capability on Google Cloud provides a market proof point that detection tooling is being productized as part of enterprise platforms rather than treated as a standalone research function.
Industrial operations also present whitespace for scaling from pilots into standardized rollouts that combine edge vision, networking, and IT/OT integration. Cisco’s 2026 State of Industrial AI findings that 61% of industrial organizations use AI in live operations, with 20% reporting scaled, mature deployments, reinforces that buyers are actively moving beyond experimentation and require production-grade monitoring, security, and integration patterns that extend to visual intelligence. This environment supports opportunities for vendors that can deliver end-to-end inspection and safety solutions, hybrid edge-cloud model update pipelines, and domain-tuned data services, while also meeting tightening privacy and audit expectations in regulated sectors such as healthcare and public security.
Recent Industry Developments
- July 2026: IBM introduced new multi-agent capabilities and specialized modernization workflows for its enterprise AI software portfolio. The update strengthens tooling for deploying and orchestrating AI in production, which supports broader use of vision and vision-language components inside governed enterprise stacks.
- May 2026: Google expanded synthetic-media safeguards by launching an AI content detection capability on Google Cloud. Packaging detection in a cloud platform aligns with rising enterprise requirements for provenance and auditability across image-centric workflows.
- September 2025: Clarifai rolled out a major platform upgrade for its Reasoning Engine, enabling scalable, enterprise-grade deployment of vision and reasoning tasks across edge and on-premises environments. The update integrates governance, security, and policy controls to support production-scale image recognition workloads.


Research Methodology Framework and Report Scope
Market Definition and Coverage
For this study, the AI image recognition market covers revenues earned from AI-based systems that detect, classify, or localize objects and scenes in images or video, including related hardware, software, and services used to run these models in real environments.
Scope exclusions: We exclude legacy, rule-based vision tools that do not learn from data and do not use machine learning or deep learning methods.
Segmentation Overview
- By Component
- Hardware
- Software
- Services
- By Deployment Model
- Cloud
- On-premises
- By Application
- Image Classification
- Object Detection and Tracking
- Facial Recognition
- Industrial Inspection
- Medical Imaging
- Other Niche Applications
- By End-user Industry
- Automotive
- BFSI
- Healthcare Providers and Med-tech
- Retail and E-commerce
- Security and Surveillance Integrators
- Manufacturing
- Others (Agriculture, Energy, etc.)
- By Geography
- North America
- United States
- Canada
- Mexico
- South America
- Brazil
- Argentina
- Rest of South America
- Europe
- Germany
- United Kingdom
- France
- Italy
- Spain
- Rest of Europe
- Asia-Pacific
- China
- Japan
- India
- South Korea
- Australia
- Rest of Asia-Pacific
- Middle East and Africa
- Middle East
- Saudi Arabia
- United Arab Emirates
- Turkey
- Rest of Middle East
- Africa
- South Africa
- Nigeria
- Egypt
- Rest of Africa
- Middle East
- North America
Data Sources, Market Sizing, and Validation
Desk Research
Desk research was used to build the first version of the market map and to set realistic boundaries on what counts as AI image recognition revenue. We relied on public, non-paywalled sources such as US Census and Bureau of Labor Statistics data for macro indicators, World Bank and IMF series for cross-country normalization, and OECD and national telecom regulators for digital and connectivity context that affects deployment.
We also reviewed sources such as NIST publications for computer vision evaluation signals, patent databases to track model and edge inference activity, and trade statistics to sanity-check relevant hardware movement when it influences system shipments. Company annual reports, earnings call transcripts, investor decks, and credible press were used to confirm product positioning and reported revenue exposure, and selective paid subscriptions were used for company financials and news intelligence. Where needed, we used patent and shipment-level import-export views to cross-check equipment activity. These examples are not exhaustive, and many other public sources were referred to for data collection, validation, and research clarification.
Primary Interviews and Surveys
Primary work focused on confirming what buyers actually purchase and how vendors recognize revenue across software licenses, subscriptions, services, and embedded hardware. We spoke with a mix of solution providers, system integrators, and enterprise users across APAC, EMEA, and the Americas, so manufacturing, security, retail, and mobility adoption patterns could be checked against the desk model before finalizing assumptions.
Distribution of primary research fieldwork respondents
| Company type | Respondent position | Region |
|---|---|---|
| Top tier: 31% | CXOs: 13% | APAC: 42% |
| Mid tier: 49% | Functional/Unit leaders: 32% | EMEA: 32% |
| Smaller Players: 20% | Managers: 55% | Americas: 26% |
Market-Sizing & Forecasting
Sizing started with a top-down build that ties total spend to observable demand pools in computer vision deployments, and then allocates shares to AI image recognition use cases using adoption and penetration assumptions gathered from interviews. To keep the totals grounded, we corroborated outputs with selective bottom-up approximations, such as sampled vendor revenue exposure, channel checks on solution bundles, and ASP times volume logic for common deployments, and then adjusted when the two views did not align.
Key inputs used in the model include the installed base of cameras and imaging endpoints in enterprise settings, the shift from on-premise to cloud and hybrid deployment, GPU and edge inference hardware availability, average contract values for vision software and managed services, and the pace of regulatory and security-driven rollouts in surveillance and workplace safety. Where a clean bottom-up roll-up was not possible, gaps were handled using proxy variables like shipment trends, buyer budget ranges, and typical attach rates of analytics software to new deployments. For forecasting, scenario analysis was used around cloud adoption speed and edge processing uptake, and the final curve was pressure-tested with expert views on pricing progression and procurement cycles.
Data Validation & Update Cycle
Validation was done through repeated variance checks across the model outputs, segment totals, and independent signals that indicate real deployment intensity. Outliers were flagged when growth implied unrealistic endpoint additions, sharp price changes, or adoption jumps that could not be explained by interviews or public indicators, and then the assumptions were revisited.
Before sign-off, numbers go through a multi-step analyst review so that inputs, math, and scope rules are consistent across years and regions. The report is refreshed annually, and interim updates are triggered when major events materially change demand, pricing, or deployment plans. Right before delivery, a final pass is completed so clients receive the latest updated view.
Mordor Intelligence's AI Image Recognition Market Size Compared With Other Published Estimates
Published market numbers for AI image recognition often look far apart because the category label is used loosely across studies, and because revenue recognition can be mixed with adjacent computer vision areas. We also see differences when some estimates use only software revenue, when others fold in broader image analytics, or when currency timing and inflation handling are not clearly stated.
Camera endpoint growth, AI-enabled inspection deployments, and the split between edge and cloud inference are the checks that keep Mordor Intelligence's estimate aligned to paid hardware, software, and managed services used specifically for machine learning based image recognition, rather than the wider image recognition umbrella. Base-year choices also matter, since some publishers anchor on earlier years and then project aggressively, without revalidating pricing and attach rates through recent buyer conversations.
Benchmark comparison
| Source | Market Size | Gaps in Research Methodology |
|---|---|---|
| Mordor Intelligence | USD 5.68 B (2026) | |
| Global Research Publisher A | USD 62.30 B (2024) | Uses a broad image recognition definition that can include non-AI methods and wider computer vision applications, and the year base differs, which can inflate totals when adjacent categories are counted together. |
| Industry Publisher B | USD 68.46 B (2026) | Covers the wider image recognition stack (including OCR and code recognition) across many applications, which expands scope beyond AI image recognition revenues that are tied to ML based detection and classification. |
The spread in the table is mainly explained by scope boundaries and the way adjacent vision categories are bundled, rather than a single math difference. By sticking to clearly defined AI-based recognition revenue streams and then checking the totals against deployment signals and real-world pricing feedback, the final market value stays traceable to repeatable inputs.


Key Questions Answered in the Report
How large is the AI image recognition market today, and where is it heading by 2031?
The market totals USD 5.68 billion in 2026 and is forecast to reach USD 11.07 billion by 2031, implying robust expansion for the period.
What compound annual growth rate is expected for the market in the forecast window?
The market is projected to grow at a 14.31% CAGR between 2026 and 2031.
Which component category is growing the fastest?
Services show the highest momentum with a 14.67% CAGR, reflecting enterprise demand for integration, model tuning, and lifecycle support.
Which geographic region will record the strongest growth through 2031?
Asia-Pacific carries the highest trajectory at a 15.61% CAGR, driven by sizeable public and private investments in AI hardware and city-scale deployments.
How is the balance between cloud and on-premises deployment evolving?
On-premises solutions captured 67.95% revenue in 2025, yet cloud workloads are expanding at a 16.37% CAGR as hyperscale elasticity and managed model services gain favor.
What is the most significant constraint currently limiting adoption?
GPU supply chain volatility adds capital-expenditure risk and extends project lead times, prompting some firms to explore alternative silicon and hybrid edge architectures.
Page last updated on:


