Explainable AI Market Size and Share
Market Overview
| Study Period | 2020 - 2031 |
|---|---|
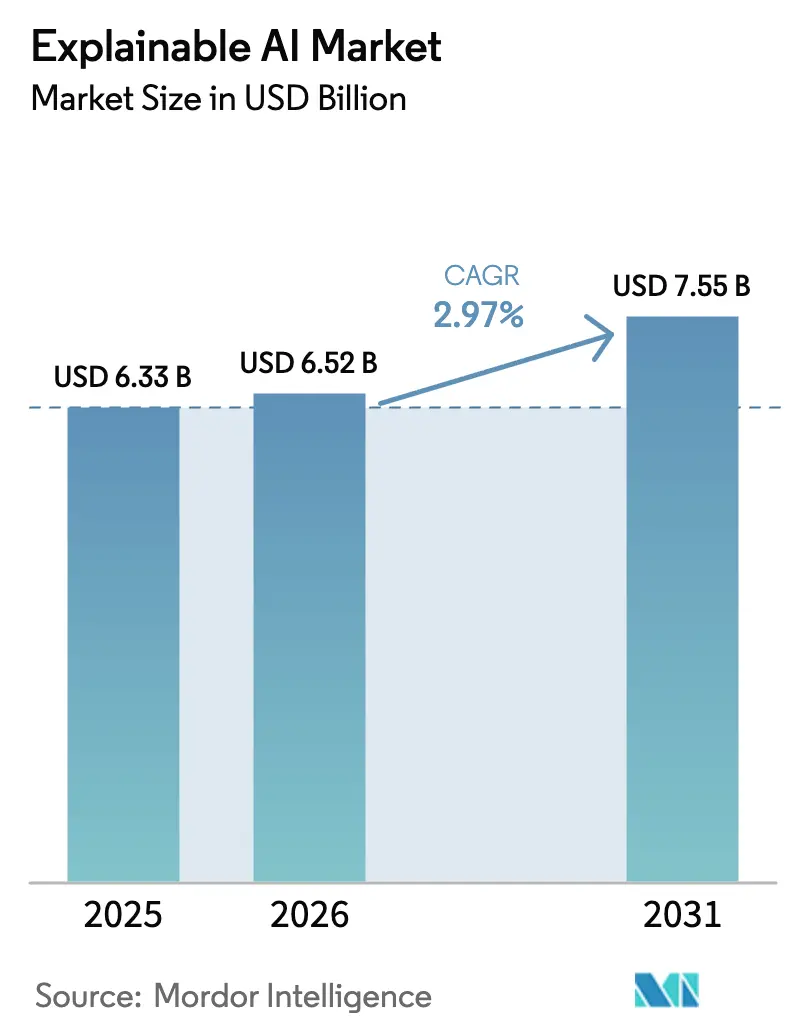
| Market Size (2026) | USD 6.52 Billion |
| Market Size (2031) | USD 7.55 Billion |
| Growth Rate (2026 - 2031) | 2.97% CAGR |
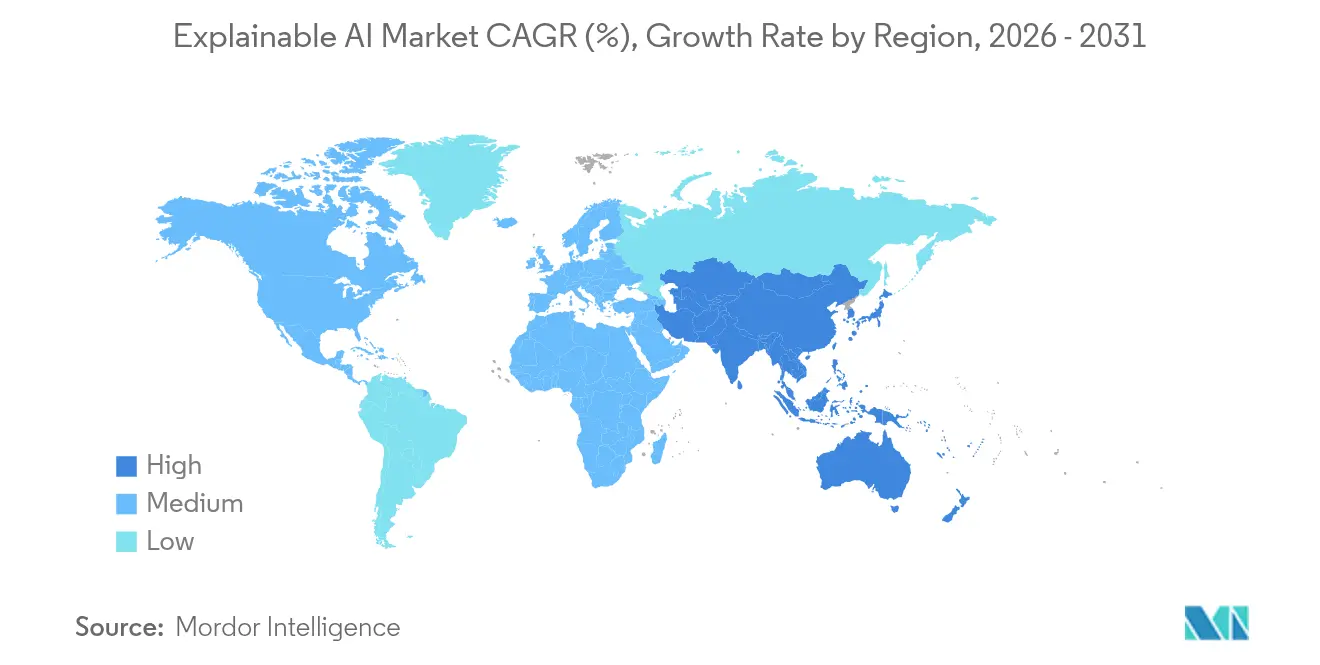
| Fastest Growing Market | Asia Pacific |
| Largest Market | North America |
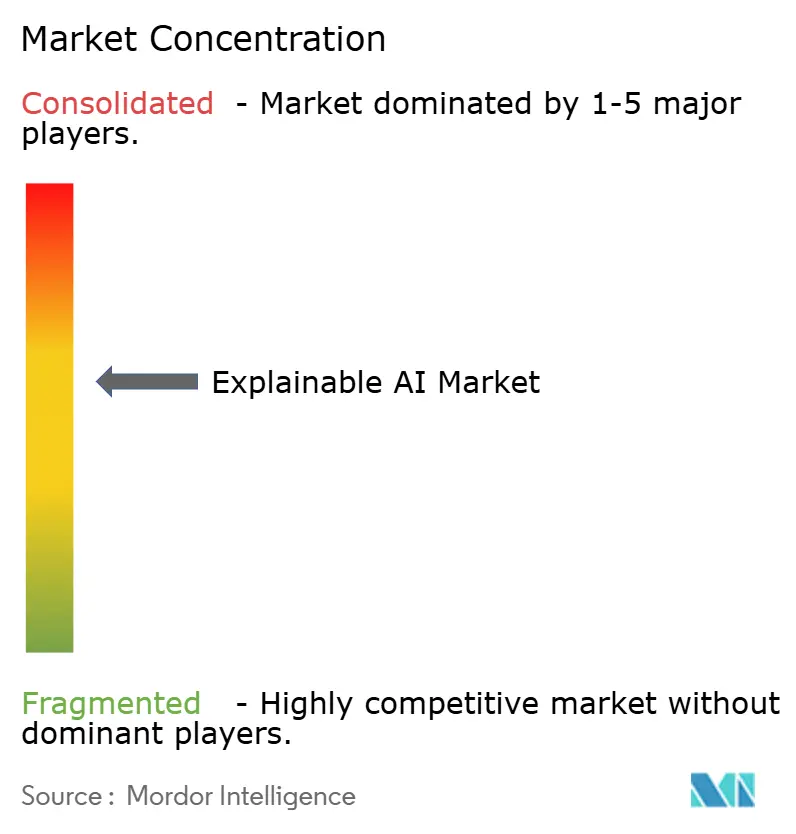
| Market Concentration | Medium |
Major Players *Disclaimer: Major Players sorted in no particular order Image © Mordor Intelligence. Reuse requires attribution under CC BY 4.0. | |
Explainable AI Market Analysis by Mordor Intelligence
Explainable AI market size in 2026 is estimated at USD 6.52 billion, growing from 2025 value of USD 6.33 billion with 2031 projections showing USD 7.55 billion, growing at 2.97% CAGR over 2026-2031.
Sustained growth is underpinned by risk-based regulations, cloud-first deployment economics, and rising board-level scrutiny of model risk in high-stakes sectors. The EU AI Act, United States model-risk guidance, and APAC regulatory harmonization have elevated transparency from an optional feature to a license-to-operate requirement. Continuous data-centric development, expanding cloud GPU capacity, and integrated AI-governance suites further accelerate adoption across the explainable AI market. Vendors able to combine model observability, bias mitigation, and audit-ready reporting are positioned to capture the largest opportunities as enterprises replace point tools with end-to-end platforms.
Key Report Takeaways
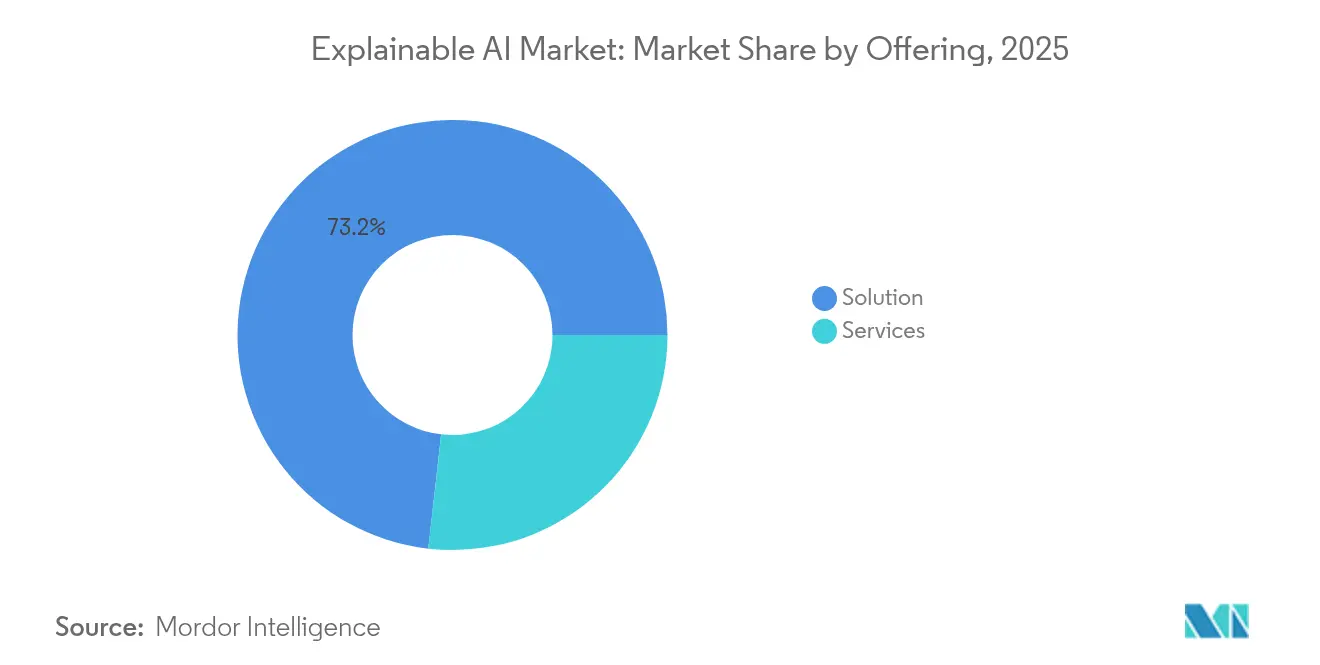
- By offering, solutions retained 73.20% of the explainable AI market share in 2025 while services are projected to scale at a 33.08% CAGR through 2031.
- By deployment, cloud captured 66.20% revenue share of the explainable AI market size in 2025 and is on track to expand at a 32.24% CAGR between 2026 and 2031.
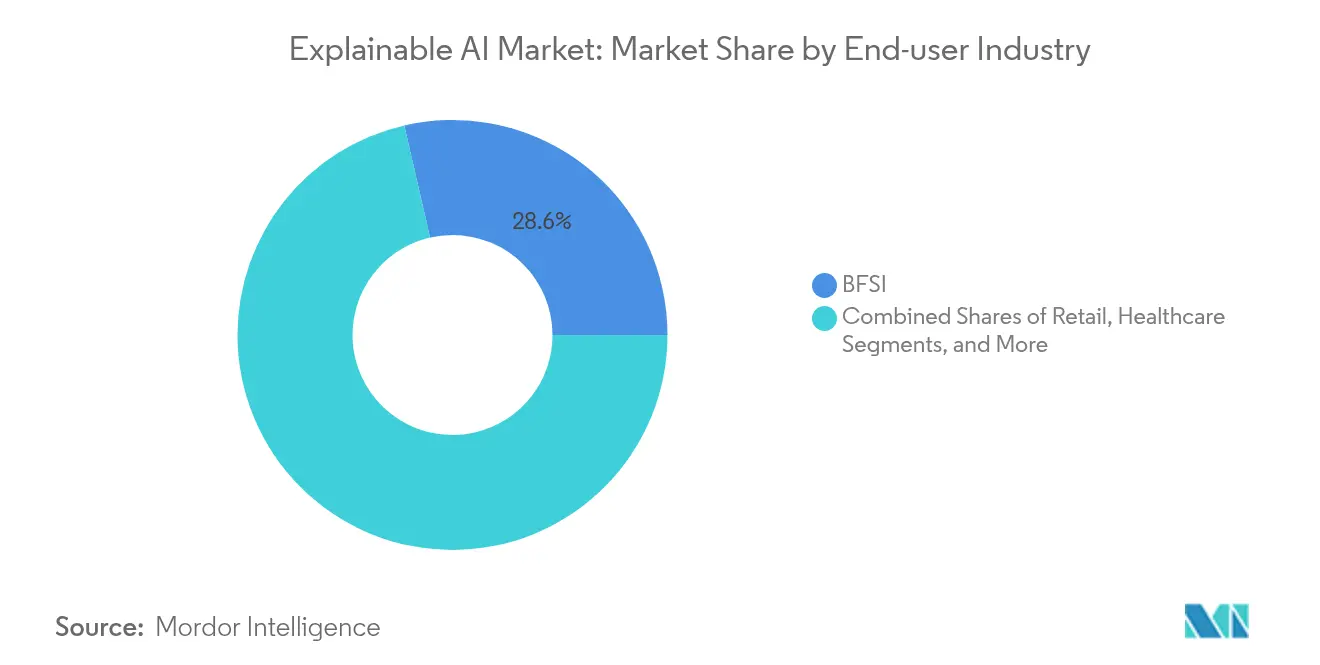
- By end-user industry, BFSI accounted for 28.60% of the explainable AI market size in 2025 while healthcare is projected to surge at a 39.26% CAGR to 2031.
- By Geography, North America accounted for 42.40% of the explainable AI market size in 2025, while Asia-Pacific is projected to surge at a 30.41% CAGR to 2031.
Note: Market size and forecast figures in this report are generated using Mordor Intelligence’s proprietary estimation framework, updated with the latest available data and insights as of 2026.
Global Explainable AI Market Trends and Insights
Drivers Impact Analysis*
| Driver | (~) % Impact on CAGR Forecast | Geographic Relevance | Impact Timeline |
|---|---|---|---|
| Rapid compliance spends triggered by EU AI Act and allied regulations | +8.20% | Europe, North America, APAC | Short term (≤ 2 years) |
| Shift from model-centric to data-centric AI demanding continuous interpretability | +6.80% | Global | Medium term (2-4 years) |
| Cloud-native AI-governance suites embedding XAI by default | +5.40% | Global | Medium term (2-4 years) |
| Surge in GenAI pilots that face board-level model-risk scrutiny | +4.90% | Global | Short term (≤ 2 years) |
| Financial-services MRM mandates broadening to cover XAI | +3.10% | North America, Europe | Long term (≥ 4 years) |
| Commercialization of open-source libraries for Kubernetes and MLOps | +2.60% | Global | Medium term (2-4 years) |
| Source: Mordor Intelligence | |||
Rapid compliance spends triggered by EU AI Act and allied regulations
The EU AI Act entered into force in August 2024 and mandates human oversight, risk documentation, and algorithmic transparency for high-risk systems.[1]European Parliament and Council of the European Union, “Regulation (EU) 2024/168 implementing rules on Artificial Intelligence,” europarl.europa.eu Fines up to EUR 35 million have prompted urgent investment in governance programs that embed explainability as standard practice. Extraterritorial reach compels non-EU vendors to align products, expanding the explainable AI market across North America and APAC. Consulting demand has spiked as enterprises race to meet February 2025 documentation deadlines. Vendors providing automated evidence packs and pre-built compliance templates now enjoy accelerated deal cycles.
Shift from model-centric to data-centric AI demanding continuous interpretability
Regulators and practitioners recognize that performance drift often stems from shifting data rather than static algorithms. FDA guidance issued in 2024 obliges device manufacturers to track data provenance and retraining events throughout the lifecycle. Enterprises therefore require platforms that generate explanations at every inference while mapping input lineage. Integrated data-governance and monitoring functions have become core differentiators, which is fueling incremental revenue across the explainable AI market.
Cloud-native AI-governance suites embedding XAI by default
Hyperscale providers have folded explainability into baseline services. IBM’s watsonx. governance automates bias scans and compliance workflows. Google Cloud’s Vertex Evaluation Service delivers output-quality rationales for large language models. AWS expanded SageMaker to include model explainability across training, deployment, and monitoring stages. Native integration trims deployment effort, attracts mid-market adopters, and raises the competitive bar for stand-alone specialists within the explainable AI market.
Surge in GenAI pilots that face board-level model-risk scrutiny
Generative AI rollouts have moved explainability from data-science to governance agendas. The Financial Stability Board’s November 2024 assessment found 93% of banks anticipate profit uplift from AI but highlighted gaps in control testing.[2]Financial Stability Board, “Artificial Intelligence and Machine Learning in Financial Services,” fsb.org Board audit committees now demand heat-map visualizations, token-path explanations, and bias dashboards before approving GenAI programs. Vendors capable of demystifying transformer outputs capture premium pricing as the explainable AI market expands into content generation, coding assistants, and customer dialogue systems.
Restraints Impact Analysis*
| Restraint | (~) % Impact on CAGR Forecast | Geographic Relevance | Impact Timeline |
|---|---|---|---|
| Scarcity of validated, domain-specific XAI benchmarks | -4.70% | Global | Long term (≥ 4 years) |
| Legal ambiguity on IP disclosure while exposing model internals | -3.20% | North America, Europe | Medium term (2-4 years) |
| Limited interpretability for complex multimodal architectures | -2.40% | Global | Medium term (2-4 years) |
| Shortage of specialized XAI talent outside major tech hubs | -1.90% | Emerging markets | Long term (≥ 4 years) |
| Source: Mordor Intelligence | |||
Scarcity of validated, domain-specific XAI benchmarks
Healthcare clinicians, bankers, and regulators struggle to compare explanation quality because no uniform pass-fail yardsticks exist. Each implementation must craft bespoke metrics, extending project timelines and dampening adoption. Industry groups are drafting sector-specific scorecards, yet a broad consensus may take years, tempering parts of the explainable AI market.
Legal ambiguity on IP disclosure while exposing model internals
Enterprises fear that deep explanations could reveal trade secrets. USPTO guidance published in 2024 underscores tension between patent disclosure and proprietary protection. Financial institutions in particular, view algorithm transparency as a potential leakage of competitive advantage. The resulting caution slows full-scale deployments in segments that prize secrecy, restraining some future spending across the explainable AI market.
*Our forecasts treat driver/restraint impacts as directional, not additive. The impact forecasts reflect baseline growth, mix effects, and variable interactions.
Segment Analysis
Segment 1
Solutions generated 73.20% of revenue in 2025 while services accelerated at a 33.08% CAGR. The explainable AI market size for solutions reached USD 4.63 billion in 2025 and continues to expand as enterprises license toolkits that automate feature attribution and bias scans. Integration depth with MLOps pipelines, cloud consoles, and data catalogs remains a critical buying criterion. The segment benefits from bundled-platform economics: vendors embed explainability alongside drift detection, thereby increasing average contract values.
Services contribute a smaller top-line but are the growth engine. Regulatory audits, model-risk attestations, and AI-literacy upskilling create recurring consulting revenue. Advisory teams translate legal text into technical controls, conduct model-fairness tests, and validate documentation before supervisory submissions. These capabilities convert one-off software sales into long-term managed service engagements across the explainable AI market.


By Deployment: Cloud Dominance Intensifies
Cloud accounted for 66.20% of spending in 2025, reflecting hyperscale elasticity and the economics of shared GPU pools. The explainable AI market share held by cloud deployments is boosted by centralized updates that keep pace with evolving regulation. Pay-as-you-go pricing lowers entry barriers for mid-size enterprises that cannot justify on-premises GPU clusters. Cloud platforms also simplify cross-border compliance as providers roll out region-specific controls in a uniform console.
On-premises installations persist in data-sovereignty environments such as defense and critical infrastructure. Yet semiconductor shortages, especially for advanced GPUs, impede expansion. Hybrid patterns have emerged: developers build and explain models in the cloud, then port inference runtimes to secure data centers. The arrangement sustains moderate growth for local nodes while cloud retains strategic leadership within the explainable AI market.
By End-User Industry: Healthcare Sets the Pace
BFSI captured 28.60% of 2025 revenue, underscoring a decade of model-risk regulation. Credit, fraud, and trading desks rely on post-hoc explanations for audit trails. Healthcare is the breakout opportunity. After the FDA’s 2024 device guidance, the segment is forecast to grow 39.26% annually to 2031. The explainable AI market size for healthcare is set to expand most rapidly as clinical stakeholders demand algorithmic clarity before integrating diagnostics into patient pathways.
Manufacturing, retail, and IT-telecom record mid-teens CAGRs on back of Industry 5.0 and hyper-personalization initiatives. Workers on smart-factory floors use human-machine interfaces that surface feature-importance rankings to justify predictive maintenance alerts. Retailers deploy recommendation engines with customer-side explanations to comply with consumer-data directives, further diversifying revenue streams across the explainable AI market.
Geography Analysis
North America produced 42.40% of 2025 turnover as mature BFSI and healthcare ecosystems required compliance-ready AI tools. The region benefits from Federal Reserve SR 11-7 expectations, FDA transparency mandates, and concentrated cloud infrastructure that accelerates adoption. Venture funding and corporate R&D underpin a robust supply network of start-ups and platform giants, keeping innovation cycles short and sustaining premium license pricing in the explainable AI market.
Asia-Pacific is the fastest-growing territory, registering a 30.41% CAGR through 2031. Japan’s projected AI expansion from USD 4.5 billion in 2024 to USD 7.3 billion by 2027 illustrates national-level momentum.Singapore’s Monetary Authority promotes responsible AI toolkits, while China’s Interim Measures for Generative AI enforce algorithmic transparency. These policies create sizeable local demand yet also impose localization challenges that favor regional cloud providers. Local language processing and culturally adapted explanations further differentiate solutions as the explainable AI market matures in APAC.
Europe sits between North America’s scale and APAC’s velocity. The EU AI Act positions the bloc as the de facto global reference for high-risk system governance. Vendors must supply documentation templates, bias-testing modules, and user-friendly dashboards in all official EU languages. Implementation complexity is higher yet so are switching costs once platforms are embedded. Data-sovereignty preferences also drive interest in sovereign-cloud offerings, carving out niches for European providers within the broader explainable AI market.

Competitive Landscape
The market displays moderate fragmentation. IBM, Microsoft, Amazon, and Google embed explainability into flagship AI services, leveraging pre-existing client footprints and ecosystem lock-in. Their scale advantages cover R&D, compliance mapping, and edge-to-cloud integration that mid-tier rivals struggle to match. These incumbents primarily monetize platform consumption rather than stand-alone licenses, broadening the explainable AI market through bundled adoption.
Specialists such as Fiddler AI, Arthur AI, and H2O.ai differentiate via deeper diagnostics, domain packs, and open-architecture connectors. Venture funding supports rapid iteration cycles; for instance, Fiddler secured USD 50 million in cumulative Series B financing to expand observability features.[4]Fiddler AI, “Series B Funding Announcement,” fiddler.ai Strategic acquisitions are intensifying. Snowflake bought Truera to embed XAI inside its Data Cloud, and Nvidia signaled interest in Lepton AI to strengthen model analytics. Partnerships with GSIs like Capgemini and PwC broaden service reach for toolmakers that lack global delivery networks.
Patent-filing velocity increased following USPTO’s 2024 AI guidance. While giants dominate volume, niche providers focus on algorithm-specific claims covering counterfactual explanations and multimodal attribution. The race for intellectual property underscores both competitive urgency and the need to shield methods from disclosure, reinforcing the earlier restraint around legal ambiguity. Overall, technical differentiation, regulatory alignment, and ecosystem partnerships are the primary levers shaping rivalry across the explainable AI market.
Explainable AI Industry Leaders
IBM Corporation
Microsoft Corporation
Amelia US LLC
Google LLC
Arthur.ai
- *Disclaimer: Major Players sorted in no particular order

Recent Industry Developments
- June 2025: Fiddler AI partnered with Carahsoft to extend AI observability across U.S. public-sector agencies.
- April 2025: Artisan closed a USD 25 million Series A round led by Glade Brook Capital to scale its explainable sales-agent platform.
- March 2025: Nvidia announced intent to acquire Lepton AI for several hundred million USD to bolster model-explanation tooling.
- February 2025: Together AI secured USD 305 million in Series B funding, bringing valuation to USD 3.3 billion and emphasizing transparency features.


Global Explainable AI Market Report Scope
XAI is a collection of processes, tools, and methods that authorize human users to understand and trust the output produced by machine learning algorithms. It describes an AI model, its expected impact, and potential biases. Its benefits characterize model accuracy, fairness, transparency, and outcomes in AI-powered decision-making. Explainable AI is necessary for an organization to build trust and confidence when placing AI models into production. AI also enables an organization to adopt a responsible path to AI development.
The explainable AI market is segmented by offering (solutions and services), deployment (cloud and on-premise), end-user industry (BFSI, healthcare, manufacturing, retail, IT and telecommunication, and other end-user industries), and geography (North America, Europe, Asia-Pacific, Latin America, and Middle East and Africa). The report offers market size and forecasts in value (USD) for all the above segments.
| Solution |
| Services |
| Cloud |
| On-premise |
| BFSI |
| Healthcare |
| Manufacturing |
| Retail |
| IT and Telecommunication |
| Other End-user Industries |
| North America |
| South America |
| Europe |
| Asia-Pacific |
| Middle East and Africa |
| By Offering | Solution |
| Services | |
| By Deployment | Cloud |
| On-premise | |
| By End-user Industry | BFSI |
| Healthcare | |
| Manufacturing | |
| Retail | |
| IT and Telecommunication | |
| Other End-user Industries | |
| By Geography | North America |
| South America | |
| Europe | |
| Asia-Pacific | |
| Middle East and Africa |


Key Questions Answered in the Report
What is the current size of the explainable AI market?
The explainable AI market is valued at USD 6.52 billion in 2026 and is projected to reach USD 7.55 billion by 2031.
Which deployment model leads the explainable AI market?
Cloud deployment dominates with a 66.20% revenue share in 2025 and is expanding to a 32.24% CAGR due to scalable GPU access and rapid compliance updates.
Why is healthcare the fastest-growing end-user sector?
FDA guidance issued in 2024 requires continuous transparency for AI-enabled medical devices, propelling healthcare at a 39.26% CAGR through 2031.
How does the EU AI Act influence global adoption?
The EU regulation enforces high-risk system transparency with fines up to EUR 35 million, prompting enterprises worldwide to embed explainability to ensure market access.
What restrains faster explainable AI market growth?
Lack of validated domain benchmarks and legal uncertainty around intellectual-property exposure slow decision-making, especially in heavily regulated industries.
Which companies are leading in embedded explainability?
IBM, Microsoft, Google Cloud, and AWS lead through platform integration, while specialists like Fiddler AI and Arthur AI excel in deep model diagnostics and industry customization.
Page last updated on:


