
Technology, Media and Telecom
5th MayPricing Strategy for Semiconductor Components
3 Min Read
Personal Service Robots Market Report is Segmented by Type (Domestic Cleaning Robots, Lawn-Mowing Robots and More), Technology (AI-Powered, Voice-Recognition Enabled and More), Connectivity (Wi-Fi, Bluetooth and More), Sales Channel (Online Retail, Specialty Electronics Stores and More) and Geography. The Market Forecasts are Provided in Terms of Value (USD).
Market Overview
| Study Period | 2020 - 2031 |
|---|---|
| Market Size (2026) | USD 20.08 Billion |
| Market Size (2031) | USD 41.11 Billion |
| Growth Rate (2026 - 2031) | 15.42 % CAGR |
| Fastest Growing Market | Asia Pacific |
| Largest Market | North America |
| Market Concentration | Medium |
Major Players *Disclaimer: Major Players sorted in no particular order. Image © Mordor Intelligence. Reuse requires attribution under CC BY 4.0. |
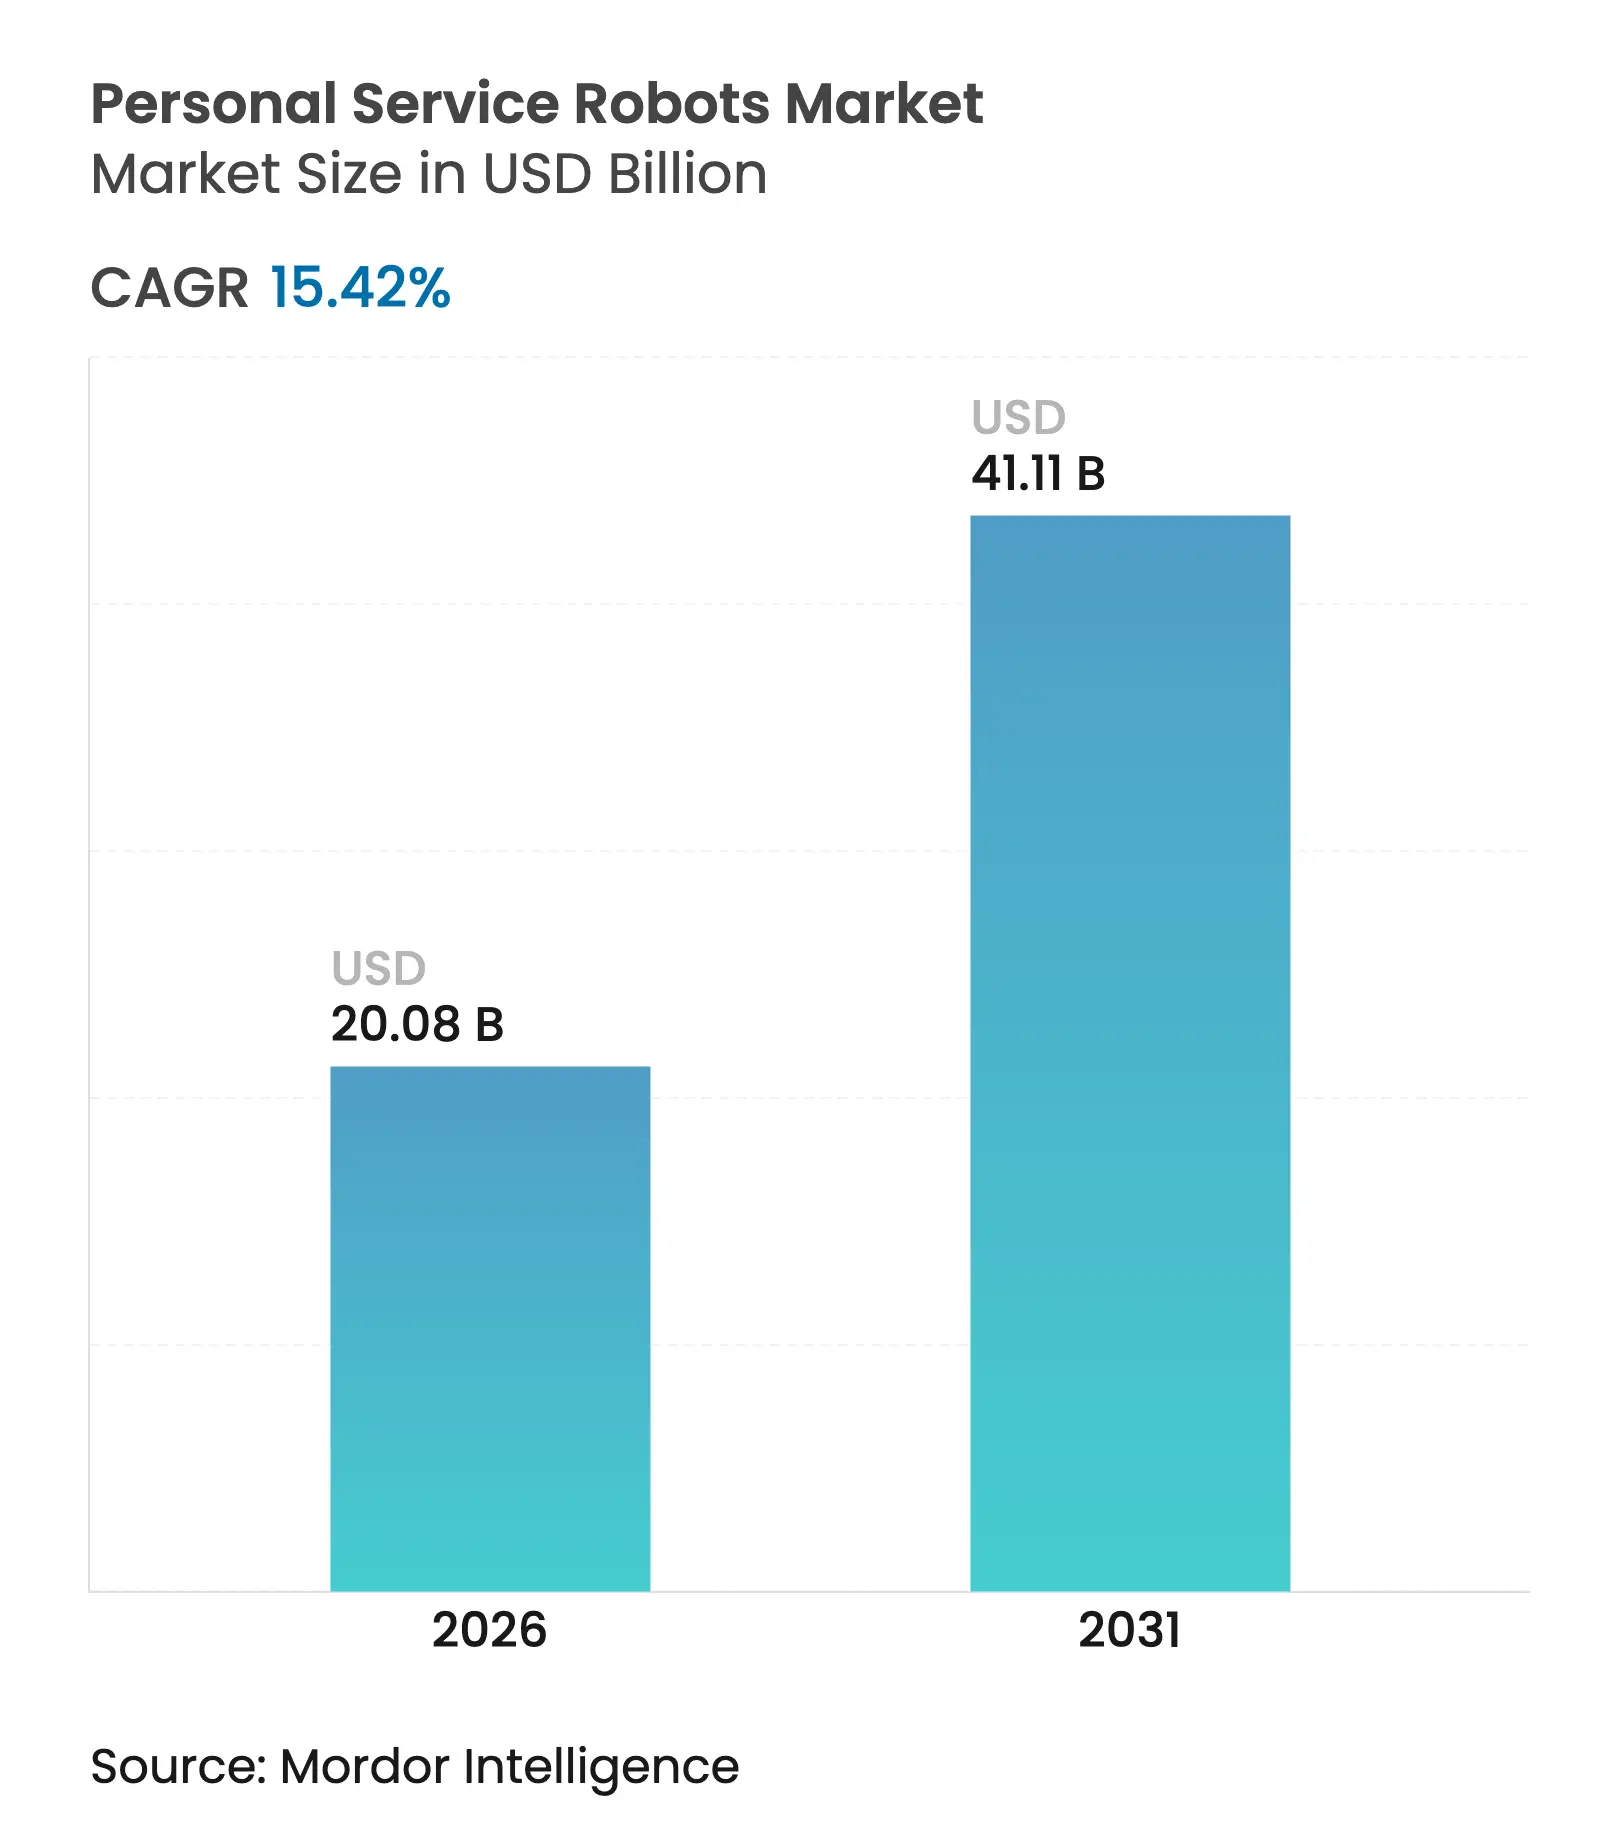
The personal service robots market size is expected to grow from USD 17.4 billion in 2025 to USD 20.08 billion in 2026 and is forecast to reach USD 41.11 billion by 2031 at 15.42% CAGR over 2026-2031. Rising elderly populations, lower component prices, and AI-IoT convergence position the home service robots market for sustained double-digit growth. Government funding for aging care, robust e-commerce infrastructure, and subscription models that convert upfront capital outlay into operating expense are reinforcing demand. Competitive pressure from Chinese manufacturers is forcing incumbents to accelerate innovation cycles, while ecosystem players such as Amazon, Samsung, and LG push platform-centric strategies that monetize software and data rather than hardware alone. Supply-chain vulnerability in key semiconductor inputs and privacy regulation remain the primary near-term brakes on momentum.
Key Report Takeaways
Note: Market size and forecast figures in this report are generated using Mordor Intelligence's proprietary estimation framework, updated with the latest available data and insights as of 2026.
Drivers Impact Analysis
| Driver | (~) % Impact on CAGR Forecast | Geographic Relevance | Impact Timeline | |||
|---|---|---|---|---|---|---|
Soaring adoption of robotic vacuum cleaners
Soaring adoption of robotic vacuum cleaners
| +3.2% | North America and Europe | Medium term (2-4 years) |
(~) % Impact on CAGR Forecast
:
+3.2%
|
Geographic Relevance
:
North America and Europe
|
Impact Timeline
:
Medium term (2-4 years)
|
Rapidly ageing population elevating demand for assistive
robots
Rapidly ageing population elevating demand for assistive
robots
| +4.1% | Asia-Pacific, spill-over to North America and Europe | Long term (≥ 4 years) | |||
Falling sensor and hardware prices
Falling sensor and hardware prices
| +2.8% | Global | Short term (≤ 2 years) | |||
AI-IoT integration enhances functionality and perceived
value
AI-IoT integration enhances functionality and perceived
value
| +3.5% | North America and EU, expanding to APAC | Medium term (2-4 years) | |||
Subscription models lower upfront ownership costs Subscription models lower upfront ownership costs | +3.6% | North America, Western Europe, Japan | Medium term (2–4 years) | |||
Government “age-in-place” incentives for home-care tech Government “age-in-place” incentives for home-care tech | +4.0% | Japan, Singapore, Europe, Australia | Long term (≥ 4 years) | |||
| Source: Mordor Intelligence | ||||||
Soaring Adoption of Robotic Vacuum Cleaners
Global shipments of robotic vacuums hit 5.014 million units in Q3 2024, validating mainstream acceptance and preparing consumers for higher-order tasks. Roborock’s Saros Z70 adds a mechanical arm capable of manipulating objects, illustrating the category’s move beyond floor care. Cost-effective Chinese brands now hold more than 80% of the Korean market, demonstrating price-driven displacement of incumbents.[1]The Korea Herald. "Samsung, LG to challenge Chinese rivals with 'all-in-one' robot vacuums. The segment’s success has lowered psychological barriers to home autonomy, encouraging users to upgrade to multifunctional systems. Manufacturers leverage this installed base for upselling extended-service plans and AI feature unlocks.
Rapidly Ageing Population Elevating Demand for Assistive Robots
Japan committed more than USD 300 million to care robots by 2018, a precedent echoed by Horizon Europe’s EUR 1.3 billion allocation for eldercare robotics.[2]MIT Technology Review. "Inside Japan's Long Experiment in Automating Eldercare. One-quarter of elderly Japanese living alone may depend on robots by 2030. South Korea already deploys AI caregivers in senior facilities, signaling a tipping point for institutional adoption. Acceptance drivers differ culturally—convenience dominates in Japan, aesthetics in Finland—requiring localized product design. These demographic shifts create structural demand resistant to economic cycles.
Falling Sensor and Hardware Prices
Gallium Nitride power chips and inexpensive MCUs are pushing feature sets once reserved for USD 2,000-plus models into sub-USD 1,500 price tiers.[3]Semicon Electronics. "Humanoid Robots on the Rise: A New Catalyst for the Semiconductor Sector." Demand surge has outstripped manufacturing capacity, giving component suppliers new pricing power. Tesla’s Optimus faces rare-earth magnet bottlenecks, illustrating how supply constraints can delay mass market entry despite technology readiness. Price deflation mirrors smartphones: as bill-of-materials costs fall, premium capabilities cascade into mainstream SKUs. Analysts expect average retail pricing to fall to USD 500-1,500 by 2030, unlocking the next consumption layer.
AI-IoT Integration Enhances Functionality and Perceived Value
Samsung’s Ballie now embeds Google’s Gemini AI, enabling conversational commands rather than app-driven control. Amazon formed an agentic AI group to extend natural-language robotics across home and warehouse settings. NVIDIA’s ReMEmbR augments spatial memory, letting robots recall object locations even after human disturbances. NYU and Meta’s OK-Robot achieved 58.5% task success in cluttered rooms, jumping to 82% after tidying, proving data-driven refinement loops . Integrated AI platforms drive replacement cycles as consumers seek unified management of lighting, security, and personal assistance through a single robotic hub.
Restraints Impact Analysis
| Restraint | (~) % Impact on CAGR Forecast | Geographic Relevance | Impact Timeline | |||
|---|---|---|---|---|---|---|
High Initial Purchase Costs
High Initial Purchase Costs
| -2.1% | Global, hitting price-sensitive emerging markets the hardest | Short term (≤ 2 years) |
(~) % Impact on CAGR Forecast
:
-2.1%
|
Geographic Relevance
:
Global, hitting price-sensitive emerging markets the
hardest
|
Impact Timeline
:
Short term (≤ 2 years)
|
Safety and Privacy Concerns Around In-Home Cameras
Safety and Privacy Concerns Around In-Home Cameras
| -1.8% | North America and EU, where regulators apply stricter scrutiny | Medium term (2-4 years) | |||
Devices from different brands don’t work together
Devices from different brands don’t work together
| -1.3% | Global, as fragmented ecosystems slow seamless smart-home setups | Medium term (2-4 years) | |||
Shortages of MCU and motor-driver components
Shortages of MCU and motor-driver components
| -1.6% | Global, with supply risks concentrated in Asia-Pacific production | Short term (≤ 2 years) | |||
| Source: Mordor Intelligence | ||||||
High Initial Purchase Costs
Tesla’s humanoid prototype is priced at USD 20,000-30,000, far beyond mainstream budgets. Robots-as-a-Service options, such as Formic’s month-to-month contracts, aim to shift capex to opex but risk subscription fatigue. Chinese disruptor Seauto cut pool-cleaner unit costs below USD 90 while sustaining functionality, proving that aggressive pricing can unlock untapped demand. Cost sensitivity diverges sharply by region; North American households tolerate premium tickets, whereas emerging-market uptake depends on sub-USD 400 entry points. Manufacturers are experimenting with modular hardware upgrades to defer initial outlay.
Safety and Privacy Concerns Around In-Home Cameras
Vision-based navigation raises surveillance fears at a time when GDPR and similar rules demand explicit data stewardship. EU projects such as SHAPES require ethical-by-design frameworks before deployment. Studies of care professionals rank privacy among the top adoption barriers, despite clear functional benefits. Continuous data uploads essential for AI learning intensify user skepticism. Vendors are responding with edge-processing options and encrypted local storage, yet regulatory lag leaves buyers uncertain. Healthcare institutions impose strict vetting processes, elongating sales cycles.
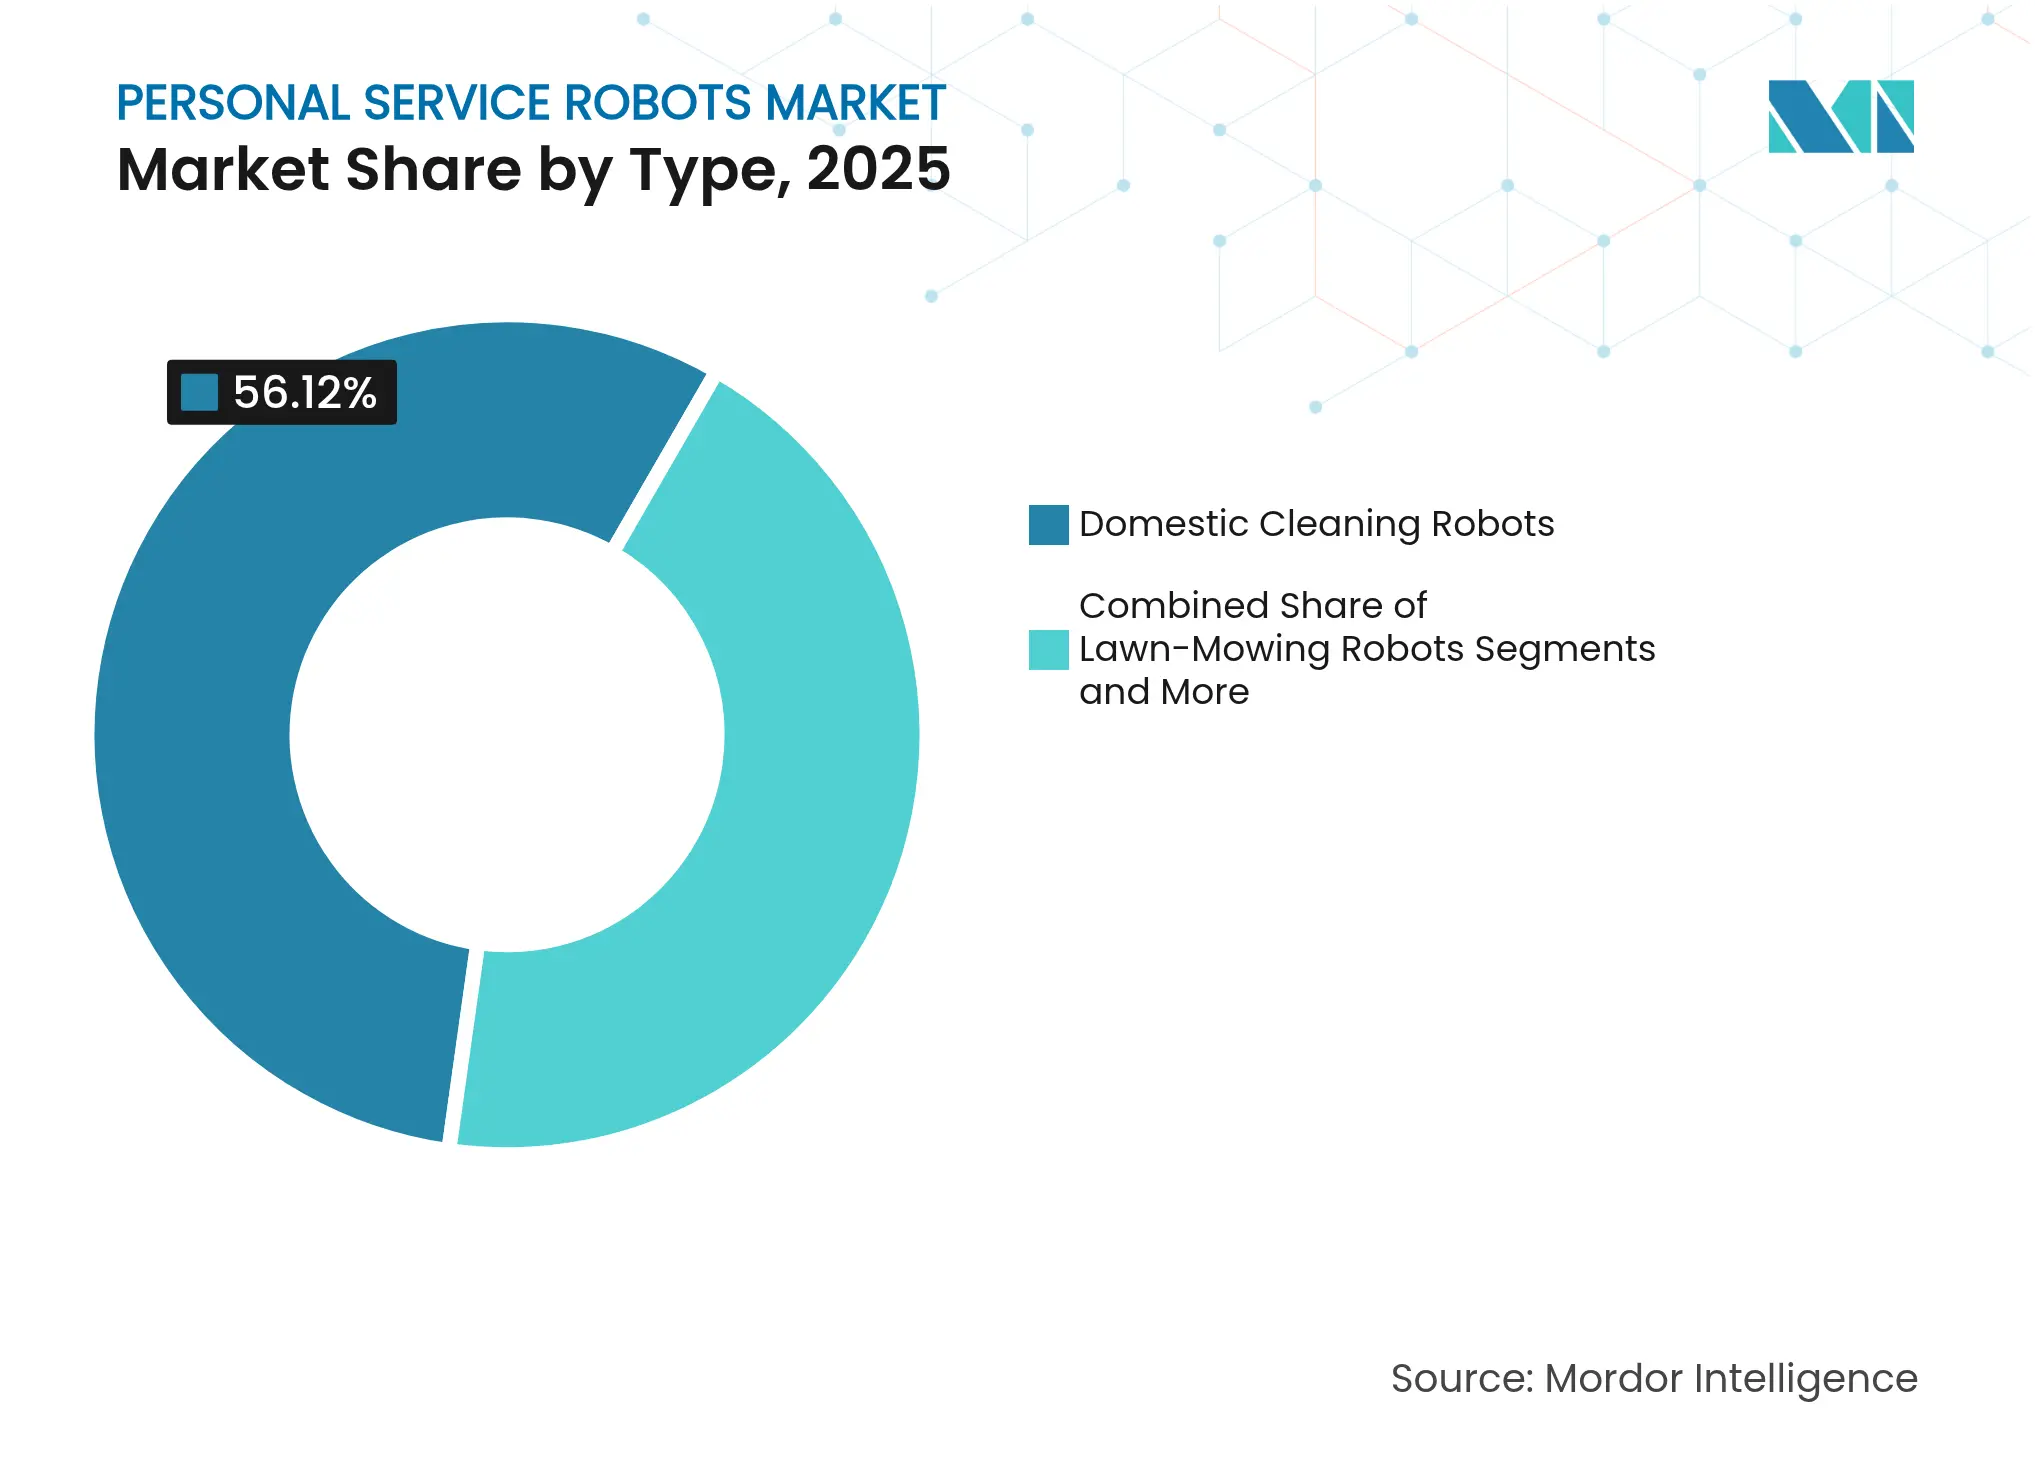
By Type: Cleaning Dominance Faces Care Revolution
Domestic cleaning robots generated 56.12% of 2025 revenue, cementing the home service robots market foundation. Growth momentum now shifts to elderly and handicap-assistance units, forecast at a 19.55% CAGR. Lawn-mowing models equipped with RTK positioning debuted at CES 2025, targeting Europe and North America’s large-lot homeowners. Pool-cleaning entrants like Seauto surpassed USD 100 million sales by pricing units at USD 199-399 and capturing price-sensitive segments. Entertainment companions, typified by Samsung’s projector-equipped Ballie, blend utility and leisure to widen addressable households. ADAM, a modular eldercare robot, demonstrates how imitation learning enables complex support tasks such as meal delivery and fall detection.
The care category’s 19.55% CAGR will raise its share of the home service robots market size from single digits toward parity with cleaning by 2031. Integrating vital-sign monitoring and telehealth gateways positions these robots as extensions of healthcare infrastructure. Vendors partner with insurance firms to pilot reimbursement models, accelerating uptake among fixed-income seniors. Meanwhile, continued price drops in vacuum and lawn segments will protect volume leadership but compress margins. Strategic differentiation therefore tilts toward AI software updates and service subscriptions rather than one-off hardware margins.
Note: Segment shares of all individual segments available upon report purchase
By Technology: Vision Systems Lead Cloud Migration
Vision systems held 46.58% share of the home service robots market in 2025, underpinning object recognition required for advanced tasks. Cloud-controlled models, advancing at 22.45% CAGR through 2031, exploit centralized processing to deliver frequent AI updates without onboard compute overhead. Dreame’s X50 illustrates this shift with a motorized arm and cloud-driven object database recognizing 200 items. Voice-enabled interfaces migrate from premium to baseline, while sensor-only navigation retreats to budget tiers.
Cloud reliance raises latency and data-sovereignty issues, prompting hybrid architectures combining edge inference with remote learning. Google’s patent on AR-based robot training suggests virtual-physical feedback loops that shorten development cycles. Competitive focus thus pivots to algorithmic accuracy and dataset breadth rather than mechanical innovation. As cloud ecosystems mature, vendors will monetize software licenses, driving recurring revenue even as hardware ASPs fall.
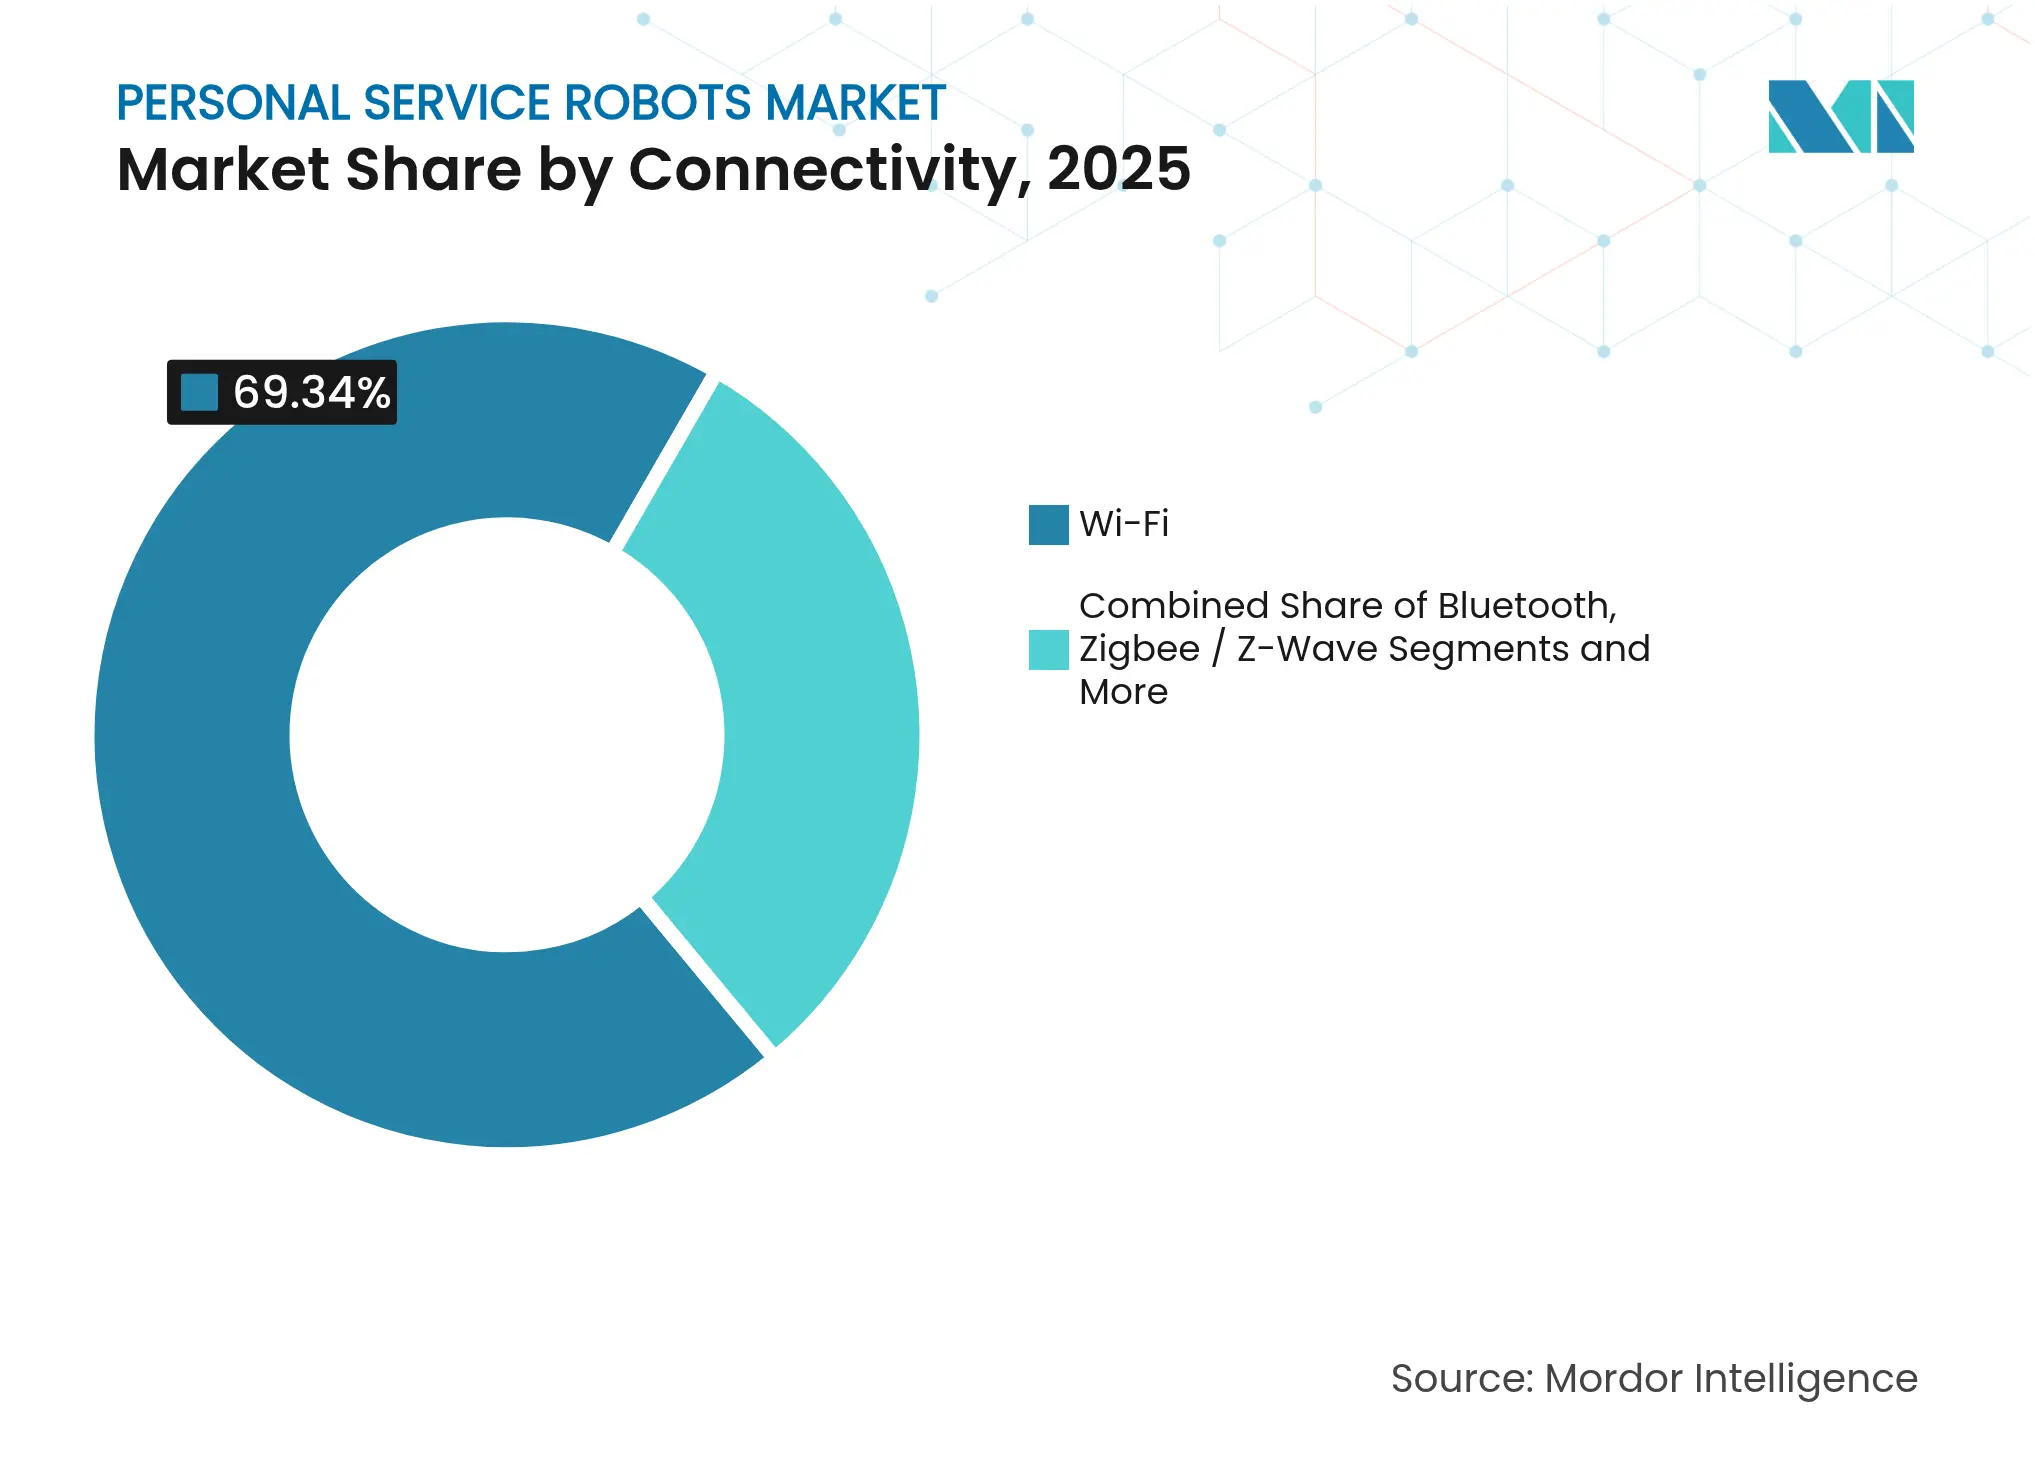
By Connectivity: Wi-Fi Dominance Challenged by 5G
Wi-Fi accounts for 69.34% of 2025 shipments thanks to ubiquitous home routers. Yet 5G modules, growing at 23.92% CAGR through 2031, enable low-latency teleoperation and continuous cloud mapping. Upcoming Wi-Fi 7 promises deterministic latency and multi-link operation, benefiting AI workloads. Bluetooth remains relevant for low-power peripherals, while Zigbee/Z-Wave mesh protocols integrate lighting and sensor networks.
Samsung’s patent on enhanced assistance scheduling over 5G exemplifies investment in ultra-reliable links for mixed-reality tasks. Meta’s wake-time optimization patent reduces battery drain during idle comms, extending duty cycles for patrol and monitoring bots. Future designs likely adopt dual radios to balance cost and performance. Connectivity resilience will prove decisive in households plagued by congested Wi-Fi or patchy 5G.
Note: Segment shares of all individual segments available upon report purchase
By Sales Channel: E-commerce Leads Direct-to-Consumer Surge
Online retail generated 63.12% of 2025 revenue as shoppers rely on reviews and doorstep delivery for bulky goods. Direct-to-consumer websites, climbing 18.68% CAGR through 2031, allow vendors to bundle extended warranties and software subscriptions while capturing data for product iteration. Seauto’s Amazon ranking, fourth in its class with RMB 50 million sales in Q1 2025, highlights platform power for rapid scaling.
Brick-and-mortar electronics chains remain essential for high-touch demonstrations, especially for USD 1,500-plus caregiving robots. Mass merchandisers cater to value-seekers but face declining share as feature complexity necessitates specialist sales staff. RaaS schemes favor direct channels where monthly fees and remote diagnostics integrate seamlessly with vendor CRM systems. Amazon’s own humanoid logistics projects hint at vertically integrated supply chains that could bundle household robots with Prime memberships.
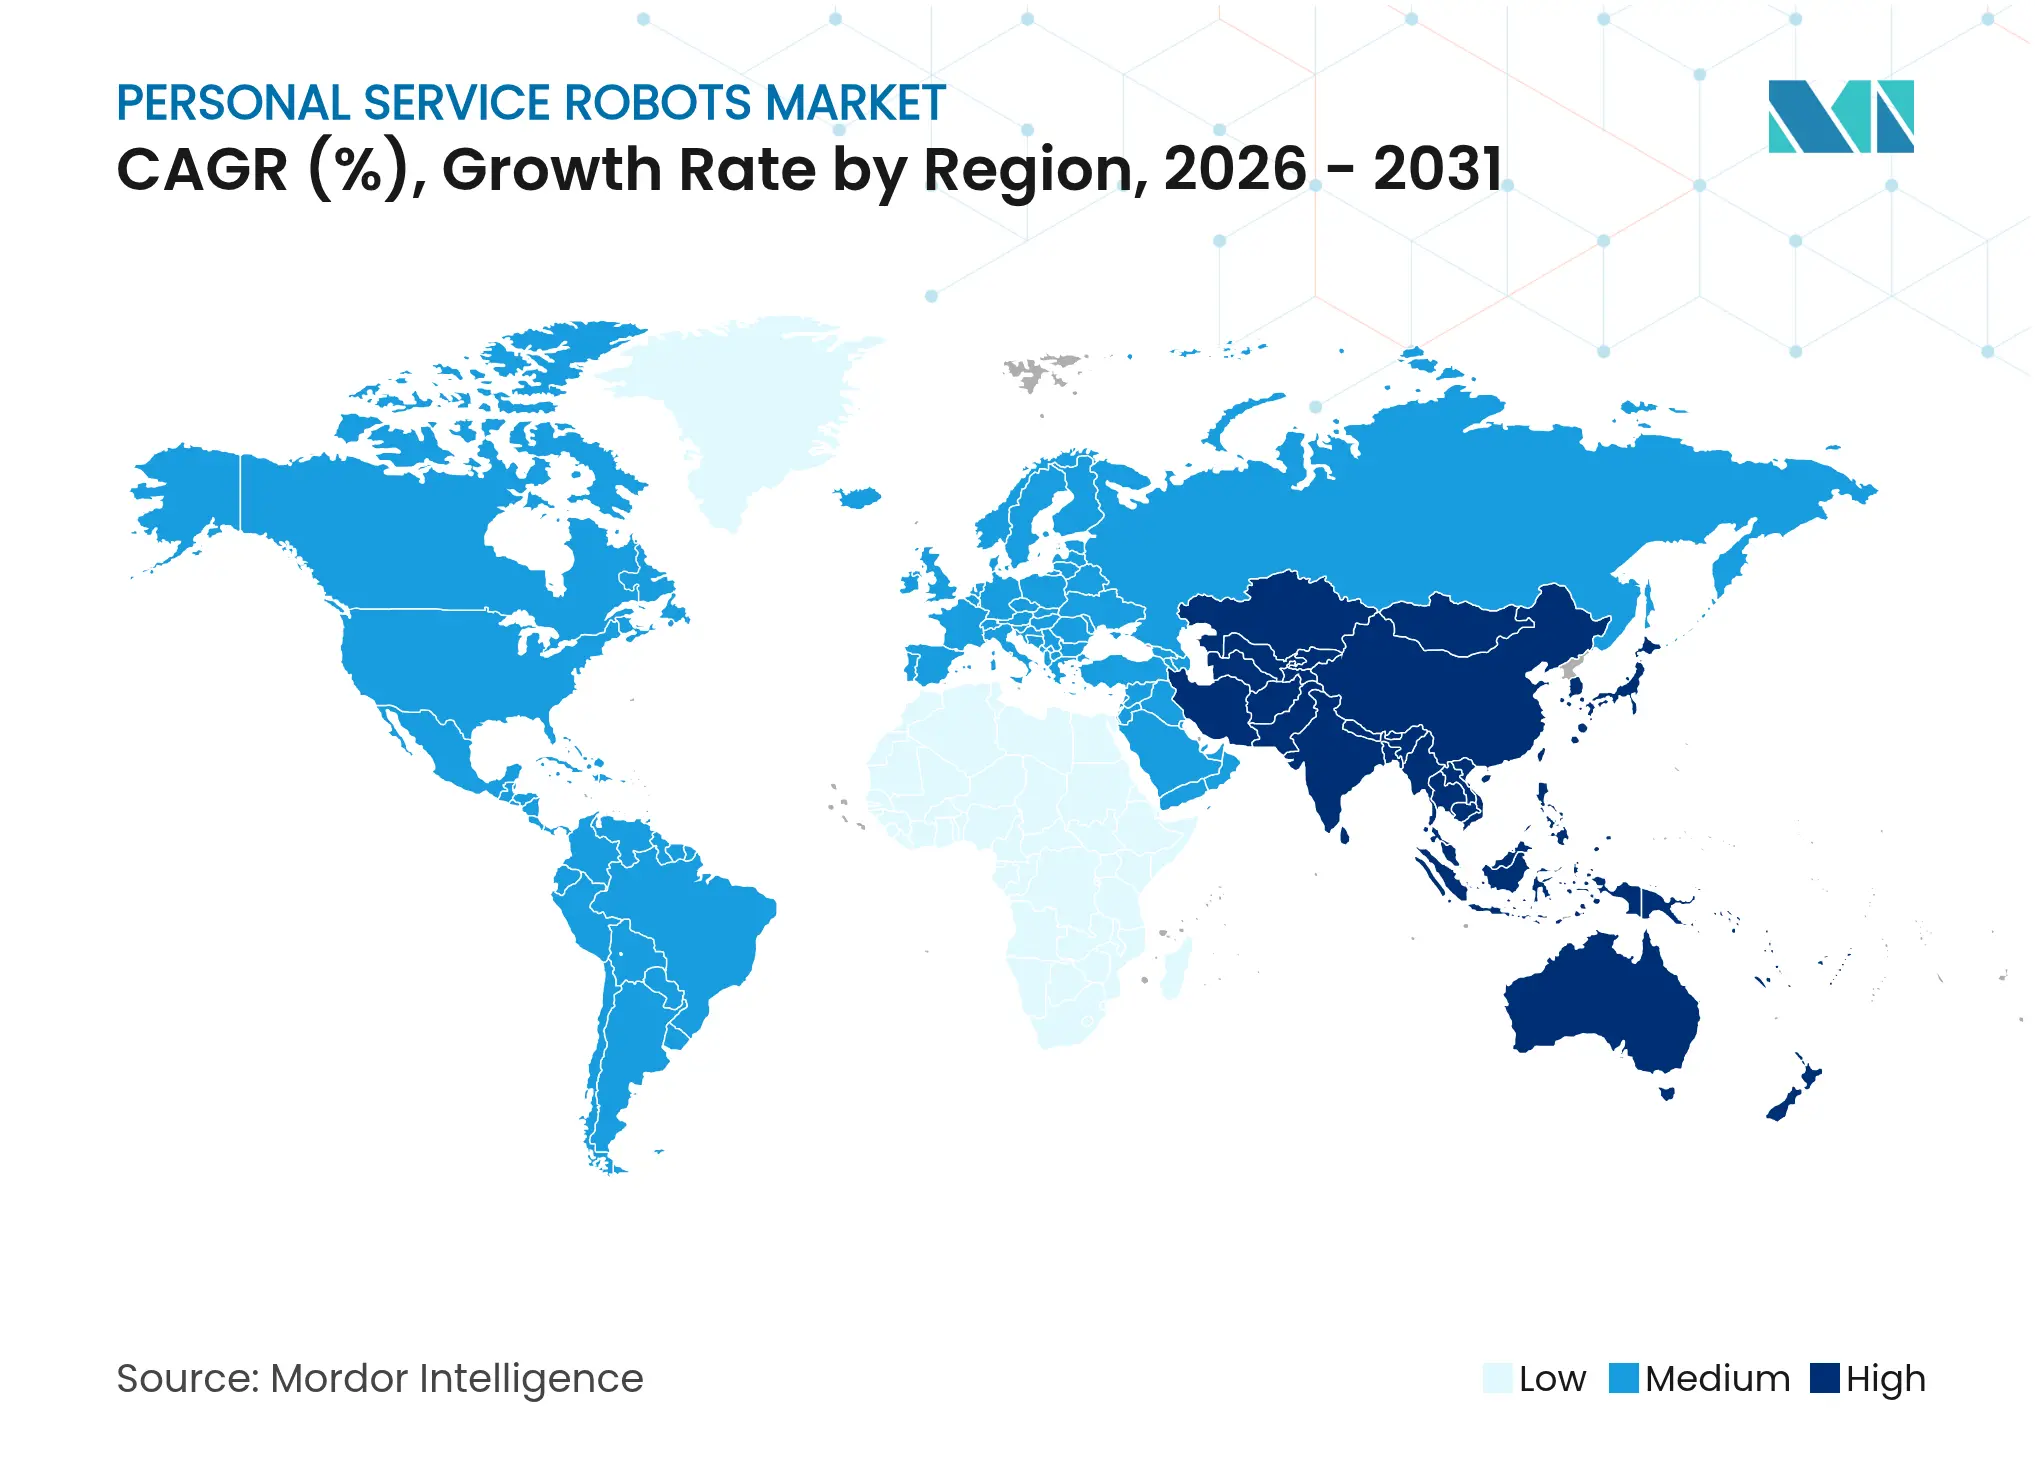
North America generated 33.45% of 2025 revenue, reflecting early adopter culture and high disposable income. Mature smart-home infrastructure simplifies robot integration, and consumers show willingness to pay premiums for AI features. The United States leads regional demand for vacuum and lawn robots, while Canada shows faster uptake of eldercare applications under public healthcare pilot programs.
Asia-Pacific holds the fastest 16.02% CAGR through 2031. China’s OEM ecosystem grants local brands cost advantage; Dreame’s overseas sales rose 120% in 2024, underscoring manufacturing scale. Japanese ministries fund eldercare pilots, turning the country into a living lab for aging-related robotics. South Korea’s deployment of AI aides in senior facilities accelerates public acceptance.
Europe’s regulatory rigor emphasizes CE marking, safety, and GDPR compliance. Horizon Europe’s EUR 1.3 billion robotics program targets social care, guaranteeing a pipeline of university-industry collaborations. Germany and France favor premium models with advanced privacy features. The Nordics prioritize design aesthetics, aligning with research that places form factor high in purchase decisions.
Market Concentration
The home service robots market exhibits moderate fragmentation. iRobot’s 45% revenue drop in 2024 exposes incumbents to low-cost competition and platform shifts. Ecovacs posted RMB 16.54 billion (USD 2.3 billion) revenue, leveraging China-based manufacturing and aggressive overseas marketing. Roborock followed with RMB 11.95 billion (USD 1.67 billion) and contemplates a USD 500 million Hong Kong listing to fund R&D.
Strategic deals redefine boundaries between consumer electronics and robotics. Samsung invested USD 180 million in Rainbow Robotics and unveiled Bot Fit wearables and Boli home robots, signaling a multi-form-factor approachs. LG secured a 51% stake in Bear Robotics to integrate commercial know-how into consumer projects such as the Self-driving AI Home Hub. Patent race intensifies as Google, Meta, and Samsung file claims in wireless optimization and AI training, anticipating commoditization of hardware and a pivot to IP licensing.
Smaller players exploit niche gaps. Seauto rides scale efficiency to dominate sub-USD 400 pool cleaners, while Formic’s subscription model targets SMBs seeking entry-level automation. Start-ups developing elder-specific robots secure grants under public health initiatives, creating a pipeline of potential acquisition targets for conglomerates building end-to-end home platforms.

*Disclaimer: Major Players sorted in no particular order
1. INTRODUCTION
2. RESEARCH METHODOLOGY
3. EXECUTIVE SUMMARY
4. MARKET LANDSCAPE
5. MARKET SIZE AND GROWTH FORECASTS (VALUE)
6. COMPETITIVE LANDSCAPE
7. MARKET OPPORTUNITIES AND FUTURE OUTLOOK
Market Definitions and Key Coverage
Our study defines the personal service robots market as revenue from autonomous or semi-autonomous units purchased for private use, vacuum and floor cleaners, lawn-mowing and pool robots, companion or social bots, plus elderly or handicap-assistance devices, measured at the first hardware sale.
Scope Exclusions: Robots built for professional or commercial settings, aftermarket parts, and maintenance contracts sit outside our coverage.
Segmentation Overview
Detailed Research Methodology and Data Validation
Primary Research
Mordor analysts interviewed robot makers, component suppliers, e-commerce retailers, and care providers across North America, Europe, China, Japan, and South Korea. Insights on replacement cycles, channel cuts, and adoption barriers refined key assumptions.
Desk Research
We began with open data from the International Federation of Robotics, UN household and aging databases, and Consumer Technology Association briefs to size the installed base and demographic demand drivers. Patent analytics via Questel and IEEE journals traced sensor, vision, and SLAM advances that influence unit pricing. Company filings and D&B Hoovers set shipment and ASP guardrails, while Factiva news and Volza customs logs confirmed export flows. These references are illustrative; many additional sources guided our desk validation.
Market-Sizing & Forecasting
In our model, regional household counts are multiplied by verified robot penetration and multi-unit factors, then paired with current ASPs drawn from IFR shipment tables. Supplier roll-ups and sampled online sell-through provide bottom-up checks, with gaps bridged by regional analogs vetted in interviews.
We forecast through 2030 using multivariate regression that blends five levers, elderly population share, disposable income, smart-home density, lithium-battery cost trends, and average robot ASP, plus scenario analysis for supply or price shocks.
Data Validation & Update Cycle
Before publication, we benchmark outputs against IFR unit data and customs trends; two analyst reviews resolve anomalies, and reports refresh annually, with interim updates for tariff moves, currency swings, or component shortages.
Why Mordor's Personal Service Robots Baseline Commands Trust
Benchmark comparison
Published estimates often diverge because many studies blend professional and personal robots, apply different ASP ladders, or refresh models on mismatched calendars.
Our view reports only personal-use hardware in constant 2024 USD and is rebuilt each year; other publishers may add service revenue or use broad service robot umbrellas, inflating totals.
| Market Size | Anonymized source | Primary gap driver | ||
|---|---|---|---|---|
USD 17.40 B (2025) | Mordor Intelligence | - | Anonymized source:Mordor Intelligence | Primary gap driver:- |
USD 65.48 B (2024) | Regional Consultancy A | Combines professional robots and service fees | ||
USD 62.85 B (2025) | Global Consultancy B | Aggregates full service robotics umbrella | ||
USD 26.35 B (2025) | Trade Journal C | Omits low-cost household models |
Pricing Strategy for Semiconductor Components
3 Min Read
Accelerating Additive Manufacturing Adoption in India
3 Min Read
When decisions matter, industry leaders turn to our analysts. Let’s talk.