Multi-Cloud Networking Market Size and Share
Market Overview
| Study Period | 2020 - 2031 |
|---|---|
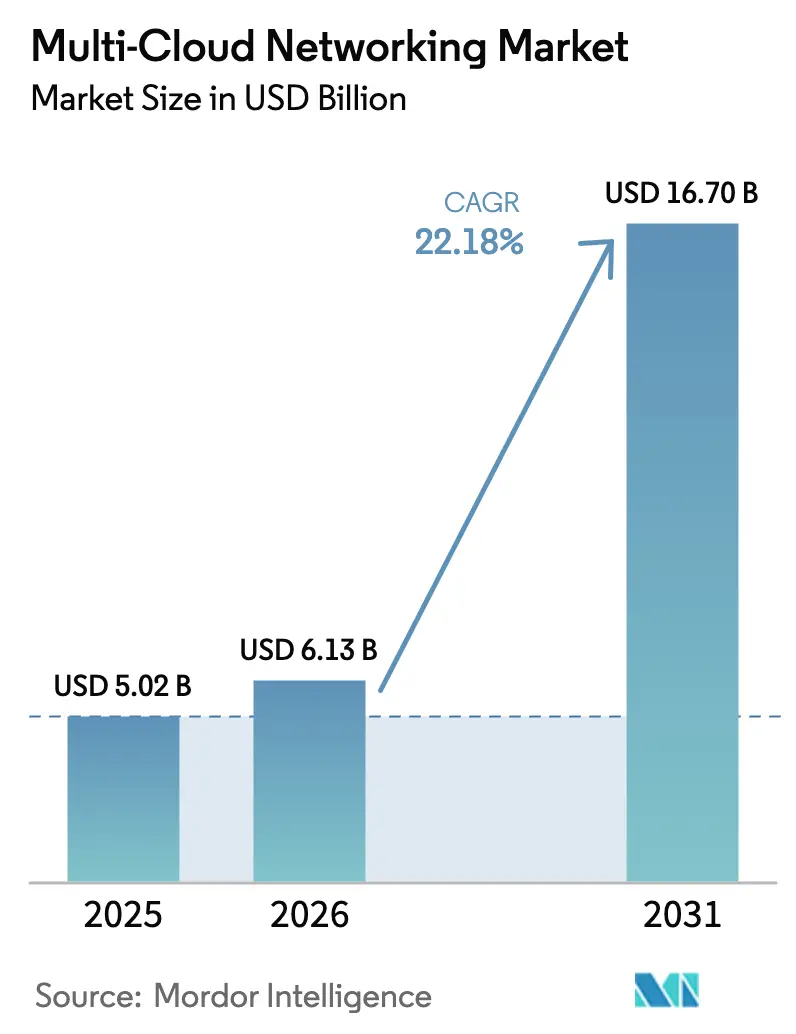
| Market Size (2026) | USD 6.13 Billion |
| Market Size (2031) | USD 16.7 Billion |
| Growth Rate (2026 - 2031) | 22.18% CAGR |
| Fastest Growing Market | Asia Pacific |
| Largest Market | North America |
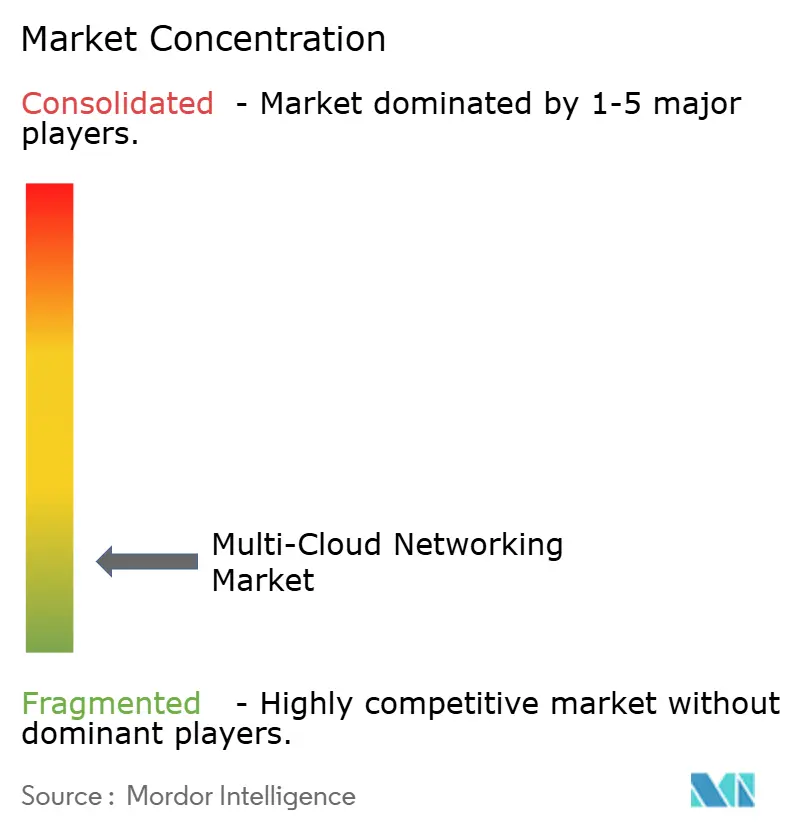
| Market Concentration | Low |
Major Players *Disclaimer: Major Players sorted in no particular order Image © Mordor Intelligence. Reuse requires attribution under CC BY 4.0. | |
Multi-Cloud Networking Market Analysis by Mordor Intelligence
Multi-cloud networking market size in 2026 is estimated at USD 6.13 billion, growing from 2025 value of USD 5.02 billion with 2031 projections showing USD 16.7 billion, growing at 22.18% CAGR over 2026-2031. Demand is accelerating as enterprises redesign their architectures around distributed clouds that must exchange data with minimal latency, consistent security and predictable costs. Vendor-agnostic fabrics, AI-ready interconnects and automated policy engines now sit at the center of procurement plans as organizations sidestep lock-in, rebalance workloads in real time and comply with tightening data-residency mandates. Market momentum also benefits from the surge in AI inference traffic across geographically spread edge nodes, which amplifies the need for deterministic, application-aware paths that span several public and private clouds. In parallel, egress-fee management tools and pay-as-you-grow connectivity models strengthen business cases among cost-sensitive adopters.
Key Report Takeaways
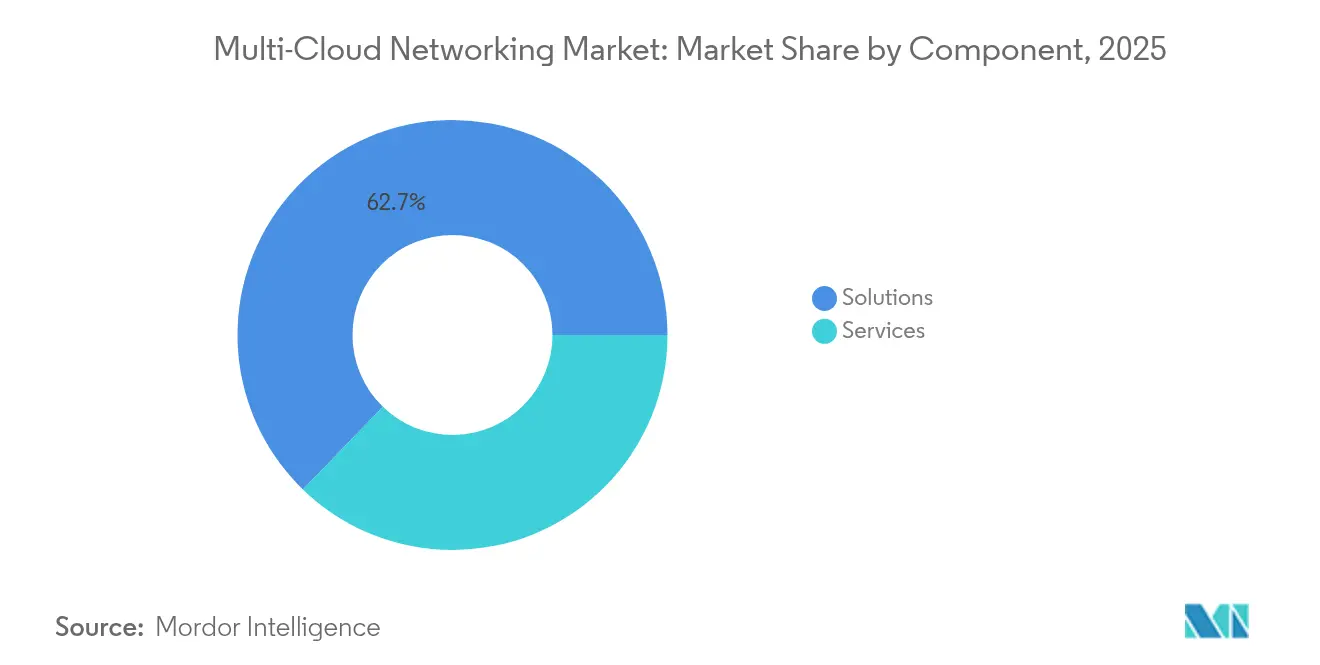
- By component, solutions led with 62.75% revenue share in 2025, while services are forecast to expand at a 24.1% CAGR through 2031.
- By deployment mode, public cloud captured 66.10% of the multi-cloud networking market share in 2025; hybrid cloud is projected to grow at a 26.6% CAGR to 2031.
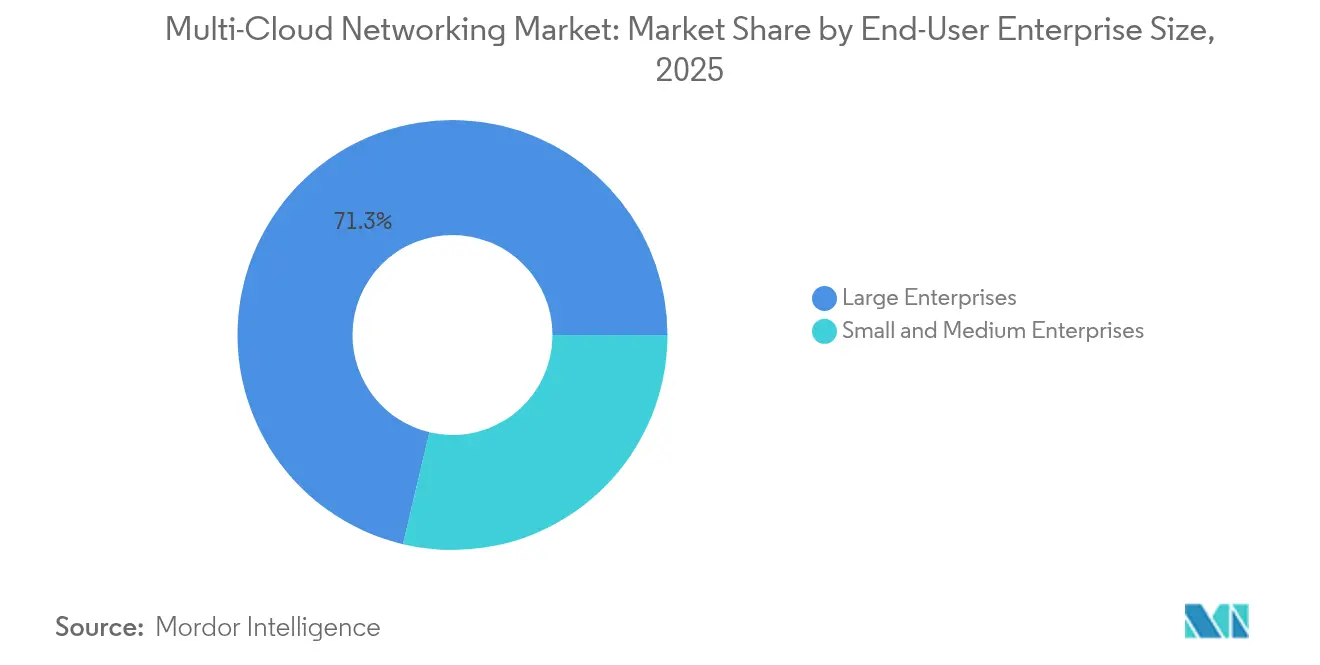
- By end-user enterprise size, large enterprises accounted for 71.30% share of the multi-cloud networking market size in 2025, whereas SMEs are advancing at a 27.3% CAGR.
- By end-user industry, BFSI maintained leadership with 23.50% share in 2025; healthcare is on track for the fastest 30.45% CAGR through 2031.
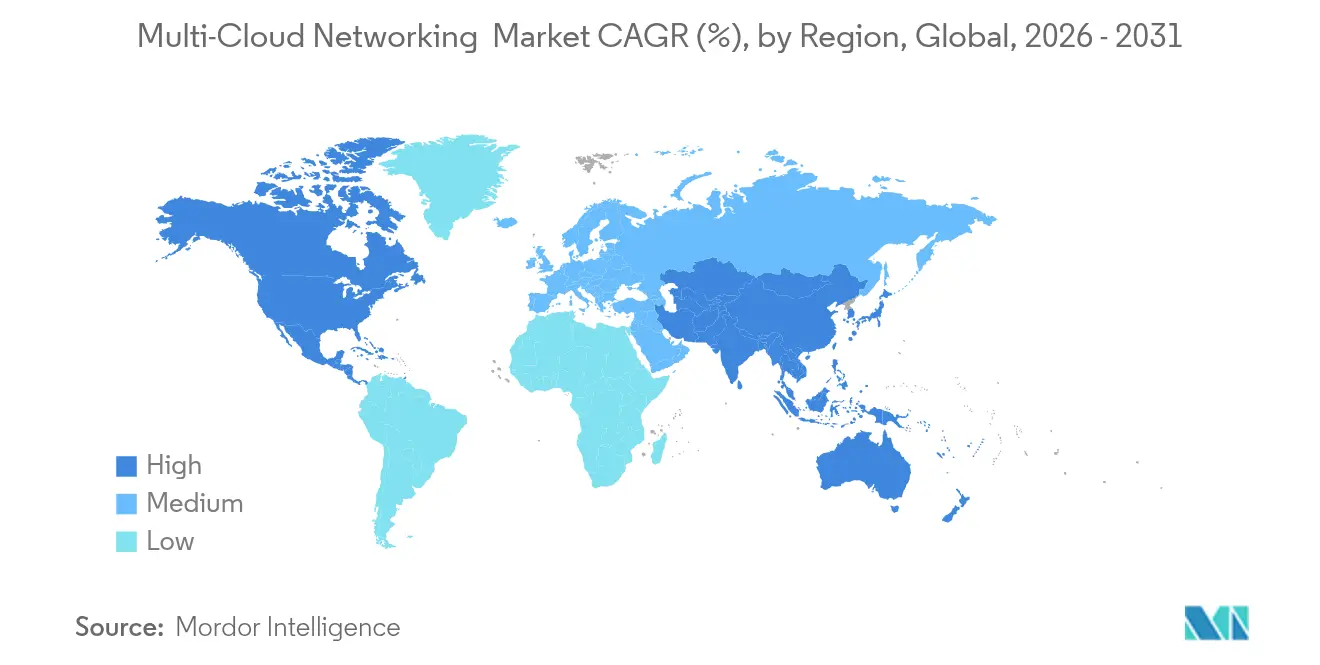
- By geography, North America held 41.20% share in 2025, yet Asia-Pacific is poised to expand at a 25.9% CAGR to 2031.
Note: Market size and forecast figures in this report are generated using Mordor Intelligence’s proprietary estimation framework, updated with the latest available data and insights as of 2026.
Global Multi-Cloud Networking Market Trends and Insights
Drivers Impact Analysis*
| Driver | (~) % Impact on CAGR Forecast | Geographic Relevance | Impact Timeline |
|---|---|---|---|
| Surging adoption of IaaS/PaaS/SaaS | +4.2% | Global, with North America and Europe leading | Medium term (2-4 years) |
| Avoiding vendor lock-in strategies | +3.8% | Global, particularly Asia-Pacific and Europe | Long term (≥ 4 years) |
| Edge-computing-led low-latency connectivity | +3.5% | Global, with Asia-Pacific core, spill-over to MEA | Medium term (2-4 years) |
| Regulatory data-residency compliance | +2.9% | Europe and Asia-Pacific primarily, expanding to MEA | Long term (≥ 4 years) |
| AI workload inter-cloud GPU fabric demand | +4.1% | North America and Europe, expanding to Asia-Pacific | Short term (≤ 2 years) |
| Egress-fee optimization monetization | +2.7% | Global, particularly cost-sensitive SME segments | Medium term (2-4 years) |
| Source: Mordor Intelligence | |||
Surging Adoption of IaaS/PaaS/SaaS
Explosive growth in cloud service consumption requires enterprises to interconnect hundreds of applications across multiple providers while safeguarding performance and governance. Deutsche Bank’s migration of 200+ workloads to Google Cloud illustrates the network complexity now typical in heavily regulated sectors. Industry surveys show that 78% of organizations plan to host at least 40% of workloads in the cloud by 2025, with 42% naming agile development as a key motive[1]Cisco Press Team, “Cisco Global Hybrid Cloud Trends Report,” cisco.com. This trajectory forces investment in vendor-agnostic overlays that provide deterministic routing, integrated security and single-pane management. As workloads span IaaS, PaaS and SaaS layers, demand grows for policy engines capable of adapting to each layer’s unique performance profile without adding manual overhead. Resulting architectures place the multi-cloud networking market at the heart of digital-first initiatives.
Avoiding Vendor Lock-in Strategies
Diversification across cloud providers is now embedded in enterprise risk playbooks to avoid pricing pressure and service disruptions[2]Armon Dadgar, “State of Cloud Strategy Survey,” hashicorp.com. Platforms such as Alkira’s Cloud Network-as-a-Service claim cost savings of up to 40% by abstracting provider specifics and automating multi-cloud deployment. This shift underpins steady expansion of the multi-cloud networking market as organizations seek programmable fabrics that move workloads freely, apply uniform policies and simplify negotiations with hyperscalers. Consistency of experience across clouds also accelerates DevOps cycles, boosting organizational agility.
Edge-Computing-Led Low-Latency Connectivity Demand
Real-time analytics, immersive media and smart-manufacturing workloads depend on latencies below 10 ms, compelling enterprises to push compute to the edge while sustaining seamless links back to clouds for heavy processing. Malaysia’s Digital Nasional Berhad achieved 99.8% uptime on a multi-operator core that interconnects six carriers, proving that edge-to-cloud fabrics can scale nationally. Similar blueprints are emerging across logistics, healthcare and retail, driving steady enlargement of the multi-cloud networking market. Traffic orchestration tools that dynamically select low-latency paths, enforce QoS and absorb failovers in real time now rank high on purchase criteria.
Regulatory Data-Residency Compliance
Data-sovereignty laws in the EU, India and Indonesia oblige enterprises to process and store sensitive records within national borders. These mandates prompt adoption of sovereign clouds and regional availability zones, amplifying the need for intelligent routing that keeps regulated data local while allowing global application access. Networking platforms that identify record types, enforce policy-based segmentation and guarantee audit trails are therefore integral to compliance strategies, especially in BFSI and healthcare. Such regulatory pressure widens the multi-cloud networking market as organizations look for solutions able to toggle paths based on jurisdictional triggers without manual intervention.
Restraints Impact Analysis*
| Restraint | (~) % Impact on CAGR Forecast | Geographic Relevance | Impact Timeline |
|---|---|---|---|
| Limited multi-cloud networking skills | -2.8% | Global, acute in Asia-Pacific and emerging markets | Medium term (2-4 years) |
| Security and compliance complexity | -2.1% | Global, heightened in regulated industries | Long term (≥ 4 years) |
| Legacy on-premises integration hurdles | -1.9% | North America and Europe | Medium term (2-4 years) |
| Hyperscaler integrated WAN cannibalization | -1.6% | Global, impacting traditional vendors | Long term (≥ 4 years) |
| Source: Mordor Intelligence | |||
Limited Multi-Cloud Networking Skills
Roughly 62% of IT leaders report difficulty hiring staff able to design, secure and operate multi-cloud networks. The scarcity is more acute in emerging economies, delaying complex deployments and pushing enterprises toward managed services and low-touch automation. Certification programs such as Aviatrix ACE are growing, yet coverage across all major clouds remains fragmented. Consequently, platform vendors embed no-code tools and AI-guided workflows to shrink skill requirements, positioning the multi-cloud networking market for continued growth despite talent headwinds.
Security and Compliance Complexity
Each hyperscaler enforces distinctive shared-responsibility models and tooling, turning policy alignment into a non-trivial exercise. Forty-four percent of enterprises rate security as their principal concern when adopting service meshes. Uniform posture management across clouds, data centers and edge sites is still emerging, and any misalignment can invite breaches and regulatory fines. Vendors now bundle micro-segmentation, threat analytics and posture drift detection into connectivity platforms, but lingering complexity continues to temper some investment decisions.
*Our forecasts treat driver/restraint impacts as directional, not additive. The impact forecasts reflect baseline growth, mix effects, and variable interactions.
Segment Analysis
By Component: Services Gain Momentum as Platforms Mature
Solutions accounted for 62.75% of revenue in 2025 as enterprises favored integrated offerings that bundle control, data and orchestration layers in a single stack. This dominance underscores confidence in turnkey toolsets that alleviate do-it-yourself integration burdens across disparate clouds. Yet services are expanding at a 24.1% CAGR, signaling a rising preference for outside expertise during design, implementation and lifecycle management. The multi-cloud networking market size for services stood at USD 1.87 billion in 2025 and is on pace to more than double by 2031, reflecting growing reliance on managed and professional services alongside in-house skills refinement.
Growth in services is accentuated by AI-assisted operations delivered through Network-as-a-Service contracts. Cisco and its partners now embed predictive analytics to pre-empt congestion and automate ticket resolution. Such managed innovations appeal to resource-constrained IT teams that value outcome-based SLAs over hardware ownership. Vendors that package consulting, deployment and AI-driven support together are capturing wallet share among both incumbents and new adopters, helping the multi-cloud networking market reach broader organizational tiers.


By Deployment Mode: Hybrid Cloud Ascends from Niche to Norm
Public cloud continues to dominate with 66.10% share in 2025 thanks to its elastic resource model and rapid on-ramp for new workloads. However, hybrid adoption is racing ahead at a 26.6% CAGR as enterprises refine strategies to optimize cost, latency and compliance simultaneously. The multi-cloud networking market size tied to hybrid architectures is projected to approach USD 7.03 billion by 2031, underpinned by demand for policy-driven path selection that bridges on-premises facilities with multiple public clouds.
Healthcare organizations illustrate the trend; many retain patient records on private clouds yet run analytics in hyperscale environments to accelerate research. Huawei Cloud’s 106% hybrid revenue spike in 2023 offers further evidence of this pivot. Networking vendors that deliver unified control planes across underlays, overlays and security zones will remain pivotal as hybrid designs shift from experimental to mainstream across regulated industries.
By End-User Enterprise Size: Democratization Unlocks SME Potential
Large enterprises commanded 71.30% of the multi-cloud networking market in 2025, leveraging deep technical teams and sizeable budgets to pursue advanced workload distribution strategies. Their implementations prioritize global redundancy, AI-optimized routing and granular compliance controls across hundreds of business units. In contrast, SMEs are expanding involvement at a 27.3% CAGR as simplified orchestration and subscription-based pricing dismantle historic barriers. The multi-cloud networking market share attributable to SMEs is forecast to near 30.40% by 2031, reflecting democratization through low-code toolsets and bundled managed services.
Solutions such as Peplink’s SpeedFusion Cloud let smaller banks like Cantilan in the Philippines mesh public clouds with branch offices without specialized staff peplink. Consumption-based models align costs with usage, enabling SMEs to adopt enterprise-grade resilience and performance at predictable price points. As vendor roadmaps prioritize intuitive dashboards and automated compliance templates, SMEs are expected to accelerate digital transformation using multi-cloud fabrics once limited to global corporations.
By End-User Industry: Healthcare Surges Ahead of BFSI Stronghold
BFSI retained leadership with 23.50% share in 2025 owing to early cloud adoption, stringent uptime mandates and cross-border regulatory obligations that favor provider diversification. Yet healthcare is registering a 30.45% CAGR, the fastest among all verticals, as hospitals digitalize records, enable tele-medicine and run AI diagnostics that span clouds. This expansion is set to lift healthcare’s portion of the multi-cloud networking market size from USD 0.48 billion in 2025 to well above USD 2.3 billion by 2031.
Phoenix Children’s Hospital moved to a cloud-delivered Zscaler platform to safeguard clinical data while ensuring seamless access across multiple providers. Similar initiatives propel demand for deterministic routing, zero-trust overlays and automated audit reporting. Manufacturing and telecom sectors also accelerate, but healthcare’s need for fast, secure data exchange between edge imaging devices and centralized AI engines positions it as the primary growth engine over the next five years within the multi-cloud networking industry.
Geography Analysis
North America’s 41.20% share in 2025 is anchored by a dense concentration of hyperscalers, mature broadband infrastructure and an active venture capital ecosystem funding start-ups that aim to streamline multi-cloud orchestration. Financial institutions and digital-native companies routinely interconnect data centers with multiple clouds, driving innovation in AI-ready fabrics, 400 Gbps optics and egress-cost analytics. Regional momentum is reinforced by initiatives like Lumen and Google Cloud’s partnership to bring high-capacity fiber paths that simplify hybrid cloud adoption.
Asia-Pacific, while smaller today, is forecast to grow at 25.9% CAGR as data-sovereignty mandates in India, Indonesia and South Korea oblige localized processing yet still demand global reach. Governments promote sovereign-cloud contracts and tax incentives that nudge enterprises toward multi-cloud designs capable of enforcing jurisdiction-aware routing. Projects such as Malaysia’s multi-operator core network show how telcos are laying nationwide backbones optimized for low-latency cloud connectivity. Despite divergent economic maturity, both developed and emerging Asia-Pacific markets are converging on the same architectural requirement: interconnectivity that adapts instantly to shifting compliance and performance needs, sustaining robust expansion of the multi-cloud networking market.
Europe maintains steady uptake powered by GDPR and digital-sovereignty goals. Enterprises prefer architectures that can localize personal data while using US-based clouds for high-performance compute. VMware’s guidance on trans-Atlantic data flows underscores the complexity of reconciling privacy and performance at scale. Vendors proficient in granular geo-fencing and audit-grade logging are well positioned as the region invests in cloud exchanges and AI-specific links. Emerging momentum in the Middle East, Africa and South America shows similar patterns, though adoption hinges on carrier-neutral edge data centers and affordable backhaul. Collectively, these geographies will keep the multi-cloud networking market on a high-growth trajectory through 2031.

Competitive Landscape
Competition is fragmented as legacy networking titans, cloud-native software vendors and hyperscalers battle for architectural mindshare. Cisco earmarked USD 1 billion for an AI investment fund, pairing its Silicon One switching silicon with NVIDIA’s Spectrum-X to ease deployment of AI clusters both on-premises and across clouds. HPE’s USD 14 billion acquisition of Juniper and IBM’s USD 6.4 billion deal for HashiCorp illustrate a land-grab for software talent able to unify networking, security and automation into a single control fabric.
Software-first disruptors such as Aviatrix, Alkira and Prosimo focus on abstracting cloud idiosyncrasies behind policy-driven overlays that integrate routing, segmentation and cost analytics. Their agility resonates with enterprises looking for cloud-agnostic operations without forklift hardware upgrades. Meanwhile, hyperscalers extend offerings like Google Cloud WAN, promising 40% faster performance and 40% lower TCO versus self-managed WANs. Such moves threaten to commoditize third-party interconnect providers, yet also expand the total addressable multi-cloud networking market by easing initial adoption.
Strategic differentiation centers on three axes: embedded AI, zero-trust security and consumption-based pricing. Vendors that unify these attributes while supporting multilateral partnerships—covering SD-WAN, SASE, observability and edge compute—will outpace rivals. White-space opportunities remain in vertical-specific compliance, GPU fabric automation and federated edge-cloud orchestration. Given robust venture investment and constant MandA, the competitive field will likely consolidate around platforms offering end-to-end simplicity without compromising performance.
Multi-Cloud Networking Industry Leaders
Akamai technologies
Cisco Systems, Inc.
F5, Inc.
Juniper Networks Inc.
VMware Inc.
- *Disclaimer: Major Players sorted in no particular order

Recent Industry Developments
- June 2025: Cisco unveiled a secure network architecture aimed at accelerating workplace AI transformation, featuring AI-powered management and devices engineered for low-latency inference.
- May 2025: Arista Networks surpassed USD 2 billion quarterly revenue for the first time, propelled by AI networking demand and new cluster load-balancing features.
- April 2025: Google Cloud introduced Cloud WAN for the AI Era, delivering up to 40% faster performance than public internet paths while cutting TCO by the same margin.
- March 2025: Cisco and NVIDIA expanded their partnership to build a unified architecture for AI-ready data center networks that combine Cisco Silicon One with NVIDIA Spectrum-X.


Research Methodology Framework and Report Scope
Market Definitions and Key Coverage
Our study defines the multi-cloud networking market as the revenue generated from software-defined overlays, cloud transit gateways, virtual routers, and related orchestration services that interconnect two or more public or private clouds and present a unified network fabric to enterprise workloads.
Scope Exclusions: Stand-alone cloud management consoles, edge hardware, and generic WAN services are outside our purview.
Segmentation Overview
- By Component
- Solutions
- Services
- By Deployment Mode
- Public Cloud
- Private Cloud
- Hybrid Cloud
- By End-User Enterprise Size
- Large Enterprises
- Small and Medium Enterprises
- By End-User Industry
- BFSI
- IT and Telecom
- Retail and E-Commerce
- Healthcare
- Manufacturing
- Energy and Utilities
- Government and Public Sector
- Other Industries
- By Geography
- North America
- United States
- Canada
- Mexico
- South America
- Brazil
- Argentina
- Rest of South America
- Europe
- United Kingdom
- Germany
- France
- Italy
- Spain
- Nordics
- Rest of Europe
- Middle East and Africa
- Middle East
- Saudi Arabia
- United Arab Emirates
- Turkey
- Rest of Middle East
- Africa
- South Africa
- Egypt
- Nigeria
- Rest of Africa
- Middle East
- Asia-Pacific
- China
- India
- Japan
- South Korea
- ASEAN
- Australia
- New Zealand
- Rest of Asia-Pacific
- North America
Detailed Research Methodology and Data Validation
Primary Research
We conducted structured interviews with cloud network architects, procurement heads in BFSI, and leading managed service providers across North America, Europe, and Asia-Pacific. Respondents validated adoption hurdles, realistic per-VPC pricing, and regional latency thresholds that influence vendor selection, letting us fine-tune model assumptions and close data gaps.
Desk Research
Mordor analysts began by mapping the addressable install base through open databases such as the US Federal Communications Commission cloud interconnect filings, Eurostat ICT usage surveys, Australia's Digital Economy data sets, and patent families extracted from Questel that reference "multi-cloud transit gateway." Company 10-Ks, investor decks, and D&B Hoovers financials then provided spend ratios between connectivity, security, and management layers, which are critical for revenue apportioning. In addition, industry associations, such as the Cloud Native Computing Foundation, MEF, and the Asia Cloud Computing Association, offered adoption benchmarks, while press coverage captured pricing moves by hyperscalers that affect average selling prices.
These sources illustrate, rather than exhaust, the wider evidence pool we consulted during desk research.
Market-Sizing & Forecasting
A top-down construct starts with cloud workload counts and inter-cloud traffic volumes published by hyperscalers, which are then paired with regional penetration rates of multi-cloud strategies to size demand. Select bottom-up checks, such as supplier revenue roll-ups and sampled ASP × active gateway instances, calibrate totals. Key variables include cross-cloud egress pricing trends, share of containerized workloads, sovereign-cloud mandates, enterprise digital transformation budgets, and SD-WAN to MCN migration ratios. Forecasts rely on a multivariate regression that links these drivers to spending, with scenario analysis layered for currency swings. Gaps in vendor disclosures are bridged by applying median margins derived from disclosed managed networking deals.
Data Validation & Update Cycle
Outputs pass a three-step review: internal triangulation, variance checks against independent traffic indices, and senior analyst sign-off. The model refreshes annually, and interim updates are triggered when hyperscalers alter transit fees or major regulatory changes surface; a final walk-through occurs before every client delivery.
Why Mordor's Multi-Cloud Networking Baseline Commands Reliability
Published estimates often diverge because firms anchor on different component mixes, base years, and refresh cadences.
Key gap drivers include: some studies bundle broader management tools without isolating networking; others freeze exchange rates or apply uniform discount curves that ignore hyperscaler fee cuts; still others project from 2022 data and miss the post-AI workload spike we captured in 2024 interviews.
Benchmark comparison
| Market Size | Anonymized source | Primary gap driver |
|---|---|---|
| USD 5.02 B (2025) | Mordor Intelligence | - |
| USD 2.03 B (2024) | Global Consultancy A | Narrow component scope and omits hybrid-cloud gateways |
| USD 6.02 B (2024) | Industry Analyst B | Includes adjacent multi-cloud management revenue beyond networking |
Taken together, the comparison shows that Mordor's disciplined scope selection, annual refresh, and blended top-down plus bottom-up validation yield a balanced baseline that decision-makers can trace to transparent variables and repeatable steps.


Key Questions Answered in the Report
What is the current size of the multi-cloud networking market?
The market reached USD 6.13 billion in 2026 and is set to more than double to USD 16.7 billion by 2031.
Which region leads multi-cloud networking revenue?
North America holds 41.20% of global revenue, supported by mature data-center infrastructure and early enterprise cloud adoption.
Why is healthcare the fastest-growing end-user segment?
Hospitals and clinics need secure, low-latency links for electronic records and AI diagnostics, driving a 30.45% CAGR in sector spending.
How does hybrid cloud deployment affect networking demand?
Hybrid architectures demand unified policy control across on-premises and cloud resources, propelling a 26.6% CAGR for hybrid connectivity solutions.
What skills gap challenges the market?
About 62% of IT leaders struggle to hire professionals proficient in multi-cloud networking, spurring demand for managed services and automation.
Page last updated on:


