
United States Data Center Networking Market Size and Share
Market Overview
| Study Period | 2020 - 2031 |
|---|---|
| Forecast Data Period | 2026 - 2031 |
| Base Year Market Size (2025) | USD 8.18 Billion |
| Market Size (2026) | USD 8.52 Billion |
| Market Size (2031) | USD 10.43 Billion |
| Growth Rate (2026 - 2031) | 4.14 % |
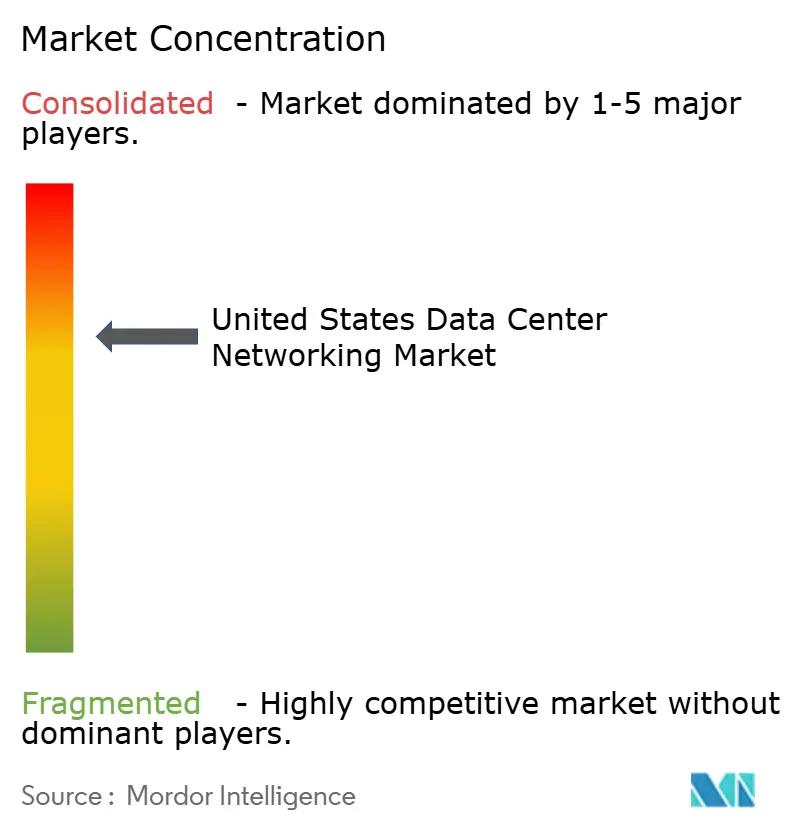
| Market Concentration | Medium |
Major Players *Disclaimer: Major Players sorted in no particular order Image © Mordor Intelligence. Reuse requires attribution under CC BY 4.0. | |
United States Data Center Networking Market Analysis by Mordor Intelligence
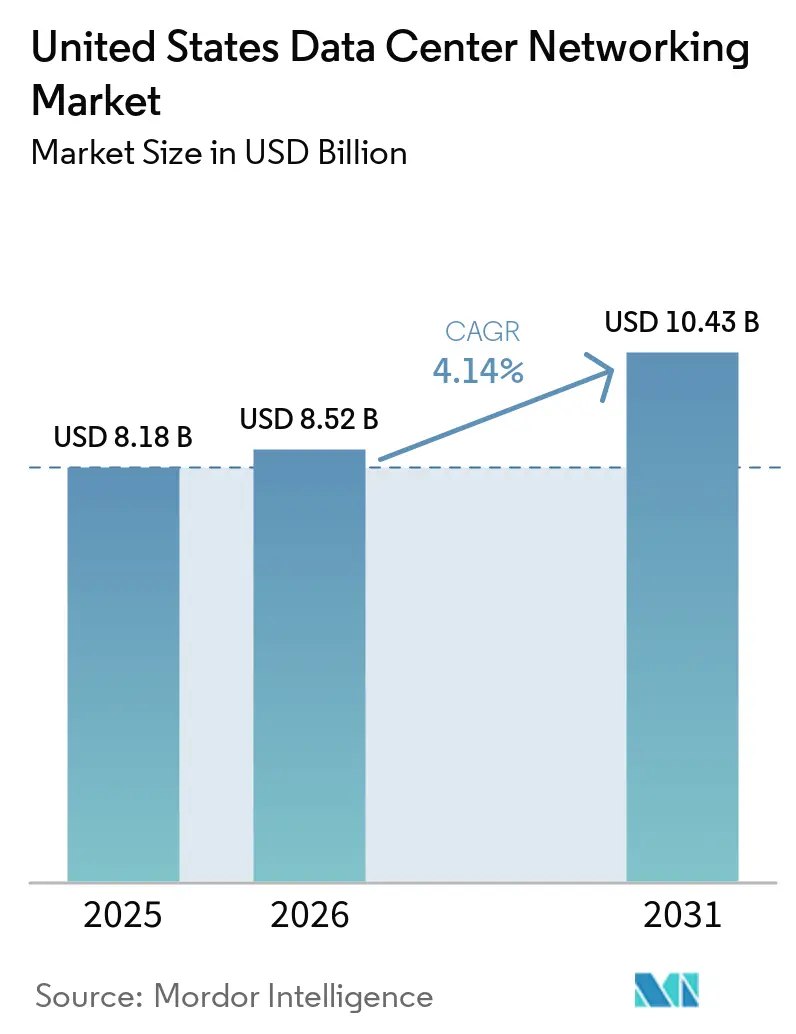
The United States data center networking market size is expected to grow from USD 8.18 billion in 2025 to USD 8.52 billion in 2026 and is forecast to reach USD 10.43 billion by 2031 at 4.14% CAGR over 2026-2031. Growth stems from hyperscale operators that continue to absorb high-density switching, 400G/800G optics, and AI-ready fabrics to support large language models demanding ultra-low latency. The manufacturing surge tied to Industry 4.0 projects, the continued rollout of 5G edge sites, and government support through Executive Order 14179 further intensify demand. Meanwhile, services revenue is rising because many enterprises lack the skills to manage complex optical migrations or zero-trust micro-segmentation. Supply chain bottlenecks, water-usage restrictions, and rising upgrade costs temper expansion but have not reversed the upward trajectory.
Key Report Takeaways
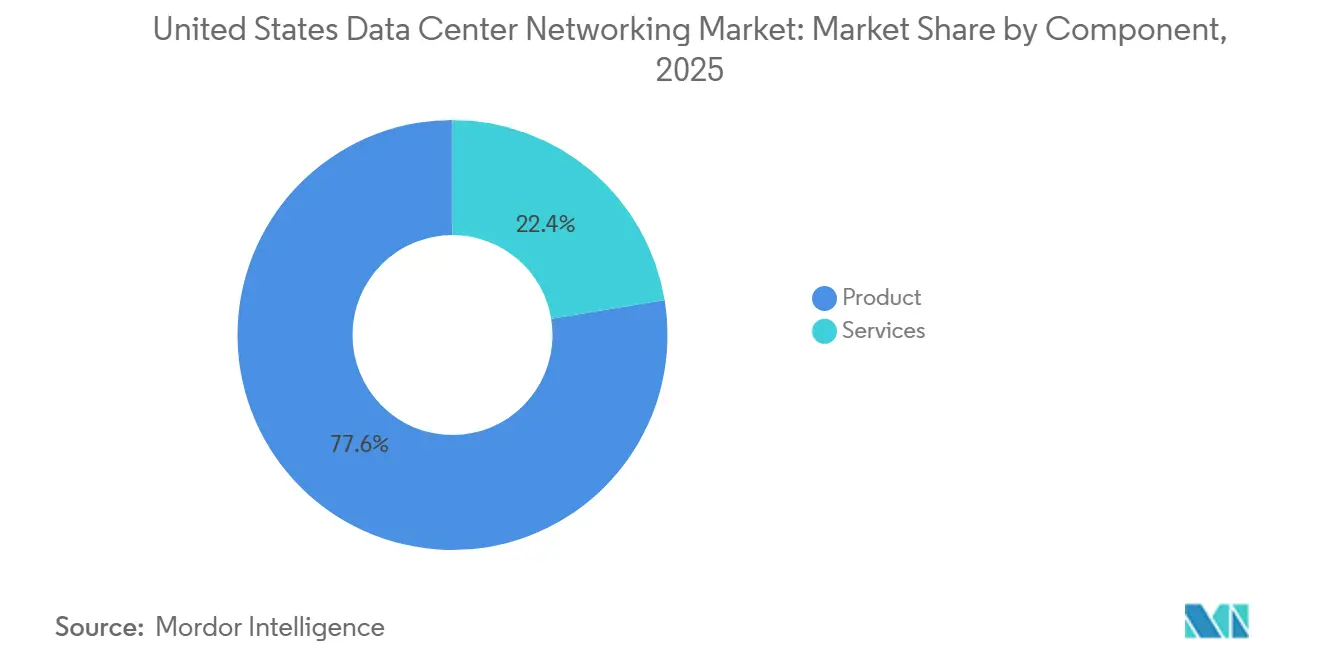
- By component, products led with 77.60% revenue share in 2025, while services are projected to expand at a 4.32% CAGR through 2031.
- By end-user, IT and telecom held 34.15% of the United States data center networking market share in 2025; manufacturing is poised for the fastest 5.08% CAGR to 2031.
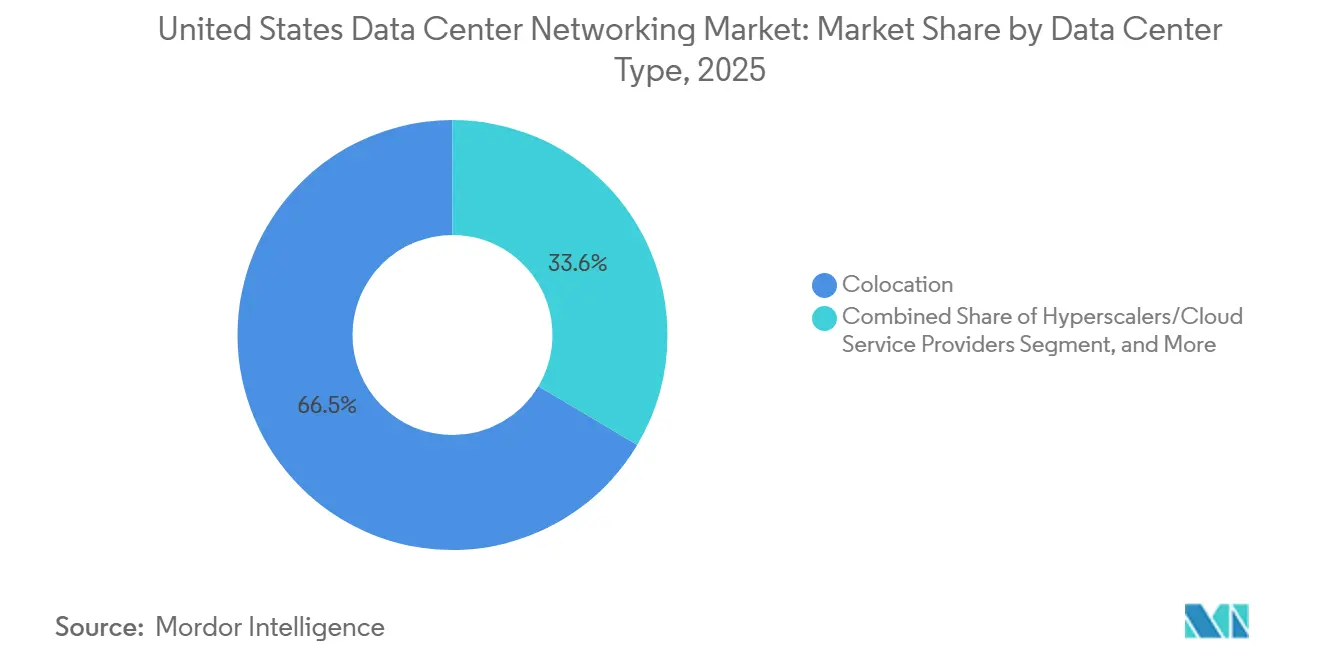
- By data-center type, colocation facilities accounted for 66.45% share in 2025, yet hyperscale deployments are forecast to grow at a 5.85% CAGR.
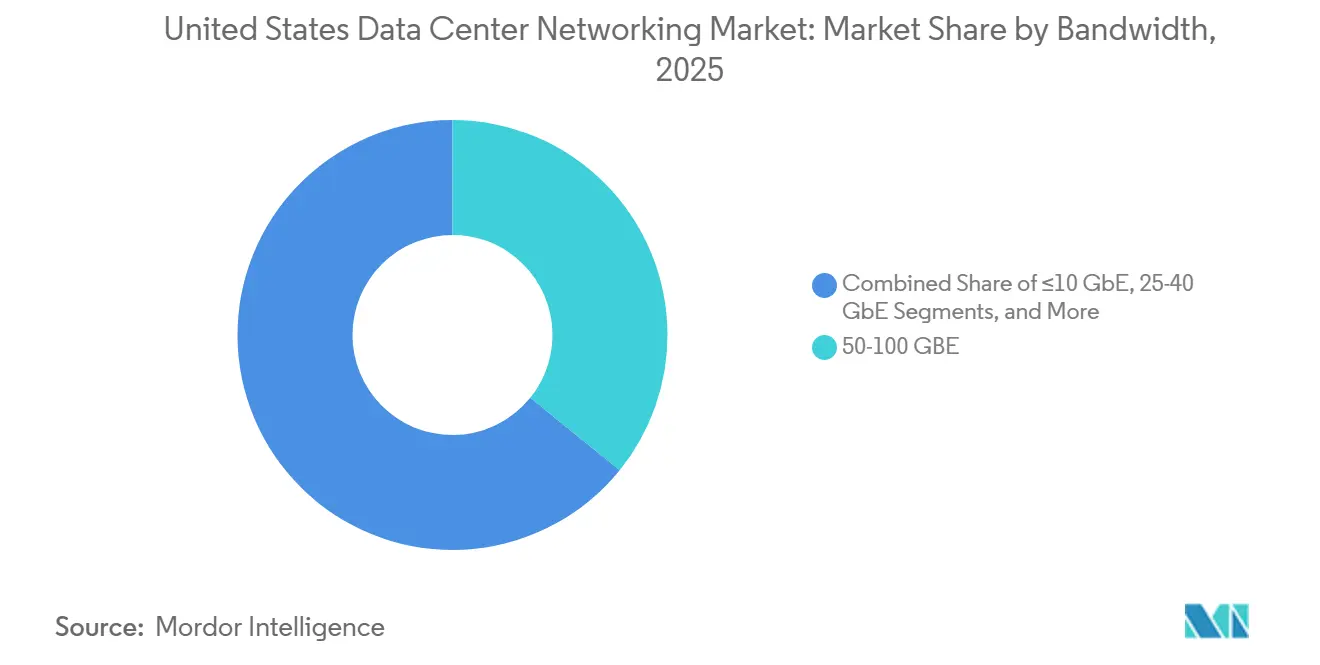
- By bandwidth, the 50-100 GbE category commanded 35.82% share of the United States data center networking market size in 2025, while the greater than 100 GbE segment is advancing at a 5.49% CAGR to 2031.
Note: Market size and forecast figures in this report are generated using Mordor Intelligence’s proprietary estimation framework, updated with the latest available data and insights as of 2026.
United States Data Center Networking Market Trends and Insights
Drivers Impact Analysis*
| Driver | (~ ) % Impact on CAGR Forecast | Geographic Relevance | Impact Timeline |
|---|---|---|---|
| Surge in hyperscale and AI-driven bandwidth demand | +0.6% | Northern Virginia, Silicon Valley, Phoenix | Medium term (2-4 years) |
| Migration to 400G/800G Ethernet fabrics | +0.5% | Major hyperscale regions | Short term (≤2 years) |
| Expansion of edge and 5G micro-data-centers | +0.4% | Metropolitan areas nationwide | Long term (≥4 years) |
| State energy-efficiency incentives | +0.3% | CA, NY, WA, TX | Medium term (2-4 years) |
| Adoption of CXL-enabled disaggregated designs | +0.3% | AI research hubs nationwide | Long term (≥4 years) |
| Zero-trust push for fabric micro-segmentation | +0.3% | Government and enterprise sites | Short term (≤2 years) |
| Source: Mordor Intelligence | |||
Surge in Hyperscale and AI-driven Bandwidth Demand
Hyperscale operators are rebuilding networks to serve AI workloads that move 10-100 times more data than legacy applications. Meta’s adoption of Arista 7700R4 platforms for training clusters highlights the spread of non-blocking, terabit-scale east-west fabrics that reduce latency for distributed GPUs. Microsoft’s USD 80 billion AI build-out and AWS’s USD 30 billion expansion reinforce the steep equipment pull for AI-specific switches, optics, and NICs. Custom silicon from NVIDIA and AMD underlines operators’ desire to bypass general-purpose devices in favor of tightly integrated 800G parts.[1]NVIDIA Corp., “800G Networking Roadmap,” nvidia.com
Migration to 400G/800G Ethernet Fabrics
The jump to 400G and 800G is the largest step since 10 GbE, driven by GPU clusters that saturate 100G links. Broadcom’s Tomahawk 6 supports 1.6 Tb/s ports, anticipating future headroom. The Ultra Ethernet Consortium ratified UEC 1.0 in June 2025, adding packet-spraying and in-network compute specifically for AI traffic. Rollouts face 18-month lead times for 800G optics, constraining some hyperscale buildouts until production ramps in 2026.
Expansion of Edge and 5G Micro-data-centers
Edge sites require compact, high-density switches that tolerate harsh environments yet deliver hyperscale speed. DE-CIX Dallas completed a 400 GE upgrade that showcases rising interconnection traffic at the metro edge. These edge nodes open new revenue for vendors able to pre-assemble automation and remote-management features that offset the shortage of on-site engineers. Industrial automation and connected vehicle pilots are driving much of the early traffic uplift.
State Energy-efficiency Incentives for Smart Fabrics
California’s Title 24 and companion rules in New York and Washington reward operators that cut network power draw with automated traffic engineering.[2]ACEEE, “Data Center Energy Code Analysis 2025,” aceee.org Networking gear consumes 10-15% of facility electricity; dynamic path optimization can trim that load by 20-30%. Healthcare systems such as RWJBarnabas Health reported double-digit power savings after deploying fabric-wide energy controls.
Restraints Impact Analysis*
| Restraint | (~ ) % Impact on CAGR Forecast | Geographic Relevance | Impact Timeline |
|---|---|---|---|
| Optical transceiver and ASIC supply bottlenecks | -0.3% | Hyperscale clusters nationwide | Short term (≤2 years) |
| High capex for 10/40 G greater than 400 G upgrades | -0.3% | Enterprise campuses nationwide | Medium term (2-4 years) |
| Water-usage limits curbing hyperscale growth | -0.2% | AZ, GA, VA, CO | Long term (≥4 years) |
| Scarcity of automation-skilled engineers | -0.1% | Secondary metro areas | Medium term (2-4 years) |
| Source: Mordor Intelligence | |||
Optical Transceiver and ASIC Supply Bottlenecks
Lead times on 800G modules have stretched to 18 months as manufacturers prioritize AI-grade optics with ultra-low jitter. Lumentum shifted its roadmap to serve this niche, demonstrating the squeeze on conventional transceiver lines.[3]Lumentum Holdings, “Q2 2025 Earnings Call Transcript,” lumentum.com Tariff impacts added 8-20% to equipment costs, prompting some enterprises to defer upgrades and sweat 100G assets longer than planned.
High Capex for Legacy 10/40 G above 400 G Upgrades
Upgrading a full fabric requires new switches, structured cabling, optics, power, and cooling. Deutsche Bank’s single-site refresh exceeded USD 50 million, underscoring the financial barrier for mid-market firms. Facility retrofits regularly double equipment spend, delaying projects unless clear ROI ties to latency-sensitive workloads exist.
*Our forecasts treat driver/restraint impacts as directional, not additive. The impact forecasts reflect baseline growth, mix effects, and variable interactions.
Segment Analysis
By Component: Products Dominance Amid Services Acceleration
Products continued to hold 77.60% of 2025 revenue as hyperscalers bought thousands of fixed-form-factor switches. Ethernet switches remained the anchor category, while software-defined controllers gained favor for policy automation. Storage-area networking equipment lost momentum as disaggregated architectures separated compute and storage across high-speed optics. Network security appliances regained focus because zero-trust designs require pervasive segmentation.
The services slice is climbing at a 4.32% CAGR as clients seek design, integration, and managed support for multi-vendor 400G/800G fabrics. Installation teams coordinate timing-sensitive optics, while managed services offset scarce in-house automation skills. Training and consulting firms address a widening talent gap around AI-specific network tuning. The United States data center networking market increasingly rewards providers that bundle hardware, optics, and expertise under outcome-based contracts.



By End-User: IT-Telecom Leadership Challenged by Manufacturing Surge
IT-telecom operators retained a 34.15% share in 2025, anchored by early 5G core deployments and public-cloud backbone refreshes. Financial institutions followed, upgrading latency paths for algorithmic trading. Manufacturing, however, is posting a 5.08% CAGR as Industry 4.0 plants retrofit with real-time analytics and robotic lines. Automotive giants are installing deterministic fabrics that blend industrial protocols with enterprise traffic.
Government and defense agencies are modernizing classified networks to enable secure AI model training. Healthcare providers expand bandwidth for diagnostic imaging and electronic records. Media firms push 4K/8K pipelines that need burst capacity and jitter control. The United States data center networking market is therefore becoming a patchwork of vertical use cases rather than a monolithic telecom-led domain.
By Data-Center Type: Colocation Stability Versus Hyperscale Innovation
Colocation sites supplied 66.45% of 2025 revenue as enterprises outsourced racks yet kept control of gear. Operators are upgrading meet-me rooms with 100G cross-connects and offering GPU clusters as a service. Hyperscalers, though smaller in count, are generating a 5.85% CAGR on massive AI clusters. EdgeCore’s USD 17 billion Virginia campus typifies investments that stack compute near renewable power and fiber hubs.
Edge and micro data centers emerge as a third pathway, inserting compact nodes in cell-tower shelters and factory floors. These locations need ruggedized switches and zero-touch provisioning. The United States data center networking market therefore splits between steady colocation revenue, hyper-growth cloud builds, and nascent edge nodes that could scale rapidly once automation matures.
By Bandwidth: 50-100 GbE Dominance Facing Greater Than 100 GbE Disruption
The 50-100 GbE tier held 35.82% share in 2025 because it balances cost and performance for most enterprise racks. Yet >100 GbE links are expanding at 5.49% CAGR as AI clusters adopt 400G spines and 800G trials. ≤10 GbE remains for legacy workloads and edge telemetry, while 25-40 GbE often gets skipped. Ciena’s WaveLogic 6 optics deliver 1.6 Tb/s line rates, foreshadowing terabit Ethernet backbones.
Multi-speed fabrics mixing 100G leafs with 400G spines create configuration complexity that drives demand for telemetry and AI-based traffic engineering. The United States data center networking market size tied to >100 GbE is expected to widen materially as hyperscalers absorb terabit uplinks by 2027.
Geography Analysis
Northern Virginia anchors the United States data center networking market with the world’s largest concentration of facilities serving both public cloud and federal workloads. Silicon Valley follows as the primary innovation lab where vendors trial optical ASICs and programmable DPUs. The West Coast, spanning California, Washington, and Oregon, offers renewable power and tax incentives, yet rising water-usage limits challenge expansion plans.
Texas and other Southern states lure operators with competitive land and power rates. However, grid reliability in ERCOT and storm exposure require resilient designs that include automated reroute paths and on-site generation. Executive Order 14179 opens federal land in the Midwest and Mountain regions, promising clean-energy campuses that will diversify build patterns.
Regulatory divergence matters. Arizona, Georgia, and Virginia now cap water draws, pushing liquid-cooling adoption. FERC reviews for co-located generation in the PJM market highlight how rising peak load from AI clusters, forecast to hit 184 GW by 2030, could strain transmission lines. The United States data center networking market therefore mirrors a patchwork of power, water, and tax considerations that influence fabric design and deployment timelines.
Regulatory Landscape
US data center networking deployments increasingly sit within energy-interconnection and reliability oversight that shapes where and how large AI clusters can be energized. On June 18, 2026, the Federal Energy Regulatory Commission (FERC) issued six tailored show cause orders to RTOs/ISOs to justify and refine rules for large-load interconnections. These steps can affect timelines for bringing new high-density networking fabrics online, since grid connection remains a key constraint.
Reliability and federal IT modernization requirements also influence network architecture and procurement. On July 16, 2026, FERC directed NERC to file mandatory reliability standards for computational loads by December 31, 2026, pushing operators toward more disciplined power and operational controls. That, in turn, feeds into network resiliency design. In parallel, OMB Memorandum M-25-03 provided implementation guidance for the Federal Data Center Enhancement Act of 2023, with provisions expiring on September 30, 2026. This reinforces modernization and consolidation activity across federal data centers, which supports refresh cycles for switching, security, and automation tooling.
Competitive Landscape
The United States data center networking market shows moderate concentration. Cisco, Arista, Juniper, and HPE still control the bulk of switch ports, yet their combined share leaves room for challengers. Arista surpassed USD 2 billion quarterly revenue in Q1 2025 by leaning into AI cluster fabrics. Cisco counters with Nexus platforms embedding Hypershield security for zero-trust enforcement.
Broadcom dominates merchant silicon with Tomahawk and Trident lines, while Marvell pushes PCIe Gen 6 over optics for disaggregated racks. Ultra Ethernet and UALink consortia open paths for start-ups to ship AI-centric fabrics that undercut proprietary NVLink. Traditional incumbents race to embed telemetry, programmable pipelines, and DPU-offload features to differentiate beyond port counts.
Edge networking remains fragmented. Vendors that ruggedize hardware and pre-load automation win early pilots with telcos and manufacturers. Optical module suppliers confront consolidation as AI-grade specs narrow approved vendor lists. The competitive field rewards firms that bundle silicon, optics, and software into turnkey fabric-as-a-service offerings.
United States Data Center Networking Industry Leaders
Cisco Systems, Inc.
Arista Networks, Inc.
Juniper Networks, Inc.
Dell Technologies, Inc.
Hewlett Packard Enterprise (HPE)
- *Disclaimer: Major Players sorted in no particular order

Market Opportunities and Future Outlook
AI-driven rack-scale architectures are creating white space for 800G and above switching, liquid-cooling-compatible platforms, and higher-density optics that improve deployment at scale. Vendor moves in 2026 reflect this shift: Cisco introduced Silicon One G300-based systems positioned for AI data centers, while Arista expanded 1.6T-capable platforms and promoted liquid-cooled pluggable optics concepts. This aligns with operator requirements around thermals, cabling reduction, and predictable performance in east-west-heavy GPU clusters. As networks move toward 100G/400G/800G mixes, the services layer also expands, since multi-vendor fabric design, automation, and optical migration complexity rises.
Power availability and interconnection process reform create a parallel opening for networking vendors and integrators that can package energy-aware design, telemetry, and operational controls into turnkey solutions. FERC activity in 2026, including work on large-load interconnection rules and mandatory reliability standards for computational loads, increases the value of architectures that improve utilization, support rapid reconfiguration, and sustain resilient operation under constrained power conditions. Separately, the FCC draft NPRM released April 9, 2026, targeting restrictions on certain Chinese carrier operations involving US data centers and PoPs, highlights the importance of compliant, trusted supply chains for interconnection-facing and backbone-adjacent networking deployments.
Recent Industry Developments
- June 2026: Arista Networks unveiled 7060XE7 Series, a 1.6T networking platform family built on Broadcom Tomahawk 6 silicon for rack-scale AI infrastructure. The company positioned the update for AI-ready data center fabrics and larger-scale AI deployments. This expands Arista’s presence in high-end AI data-center networking and adds competitive pressure in hyperscale segments.
- March 2026: Arista Networks announced a multi-source agreement for XPO, a 12.8 Tbps liquid-cooled pluggable optics module supporting 204.8 Tbps per rack unit. The capability is designed to raise density while improving thermal efficiency for AI-enabled fabrics. The agreement is intended to accelerate adoption of integrated optics and power-efficient solutions in hyperscale racks.
- February 2026: Cisco Systems announced Silicon One G300 switching silicon (102.4 Tbps) for AI cluster buildouts, with N9000 and 8000 systems supporting liquid cooling and 1.6T optics. The flagship silicon targets AI-scale data-center networking while aligning with cooling innovations. This reinforces Cisco’s competitive positioning in hyperscale deployments and integrated cooling-aware architectures.


Research Methodology Framework and Report Scope
Market Definition and Coverage
For this study, the market is the revenue generated in the United States from networking equipment and related services that are deployed inside data centers to connect servers, storage, and external networks, including upgrades and expansions.
Scope exclusions: We exclude general enterprise campus networking that is not installed for data center use, and we also exclude non-networking facility spend such as power, cooling, and real estate.
Segmentation Overview
- By Component
- Products
- Ethernet Switches
- Routers
- Storage Area Network (SAN)
- Application Delivery Controllers (ADC)
- Network Security Appliances
- Software-Defined Networking (SDN) Controllers
- Optical Interconnects
- Services
- Installation and Integration
- Training and Consulting
- Support and Maintenance
- Managed Network Services
- Products
- By End-User
- IT and Telecommunications
- Banking, Financial Services and Insurance (BFSI)
- Government and Defense
- Media and Entertainment
- Healthcare and Life Sciences
- Manufacturing and Industrial
- Other End-Users
- By Data-Center Type
- Colocation
- Hyperscalers/Cloud Service Providers
- Edge/Micro Data Centers
- By Bandwidth
- Less Than or Equal to 10 GbE
- 25-40 GbE
- 50-100 GbE
- Greater Than 100 GbE
Data Sources, Market Sizing, and Validation
Desk Research
Desk work started by mapping the demand backdrop for US data centers, then converting those signals into networking needs by workload type and upgrade cycles. Public sources were used to ground the model, such as Uptime Institute data center research, US Energy Information Administration electricity statistics, US Census Bureau economic data, Federal Communications Commission broadband reporting, and National Institute of Standards and Technology guidance that influences security and architecture choices.
We also reviewed company filings, earnings call transcripts, investor decks, reputable press coverage, and association publications to capture product cycles like 400G to 800G transitions and the shift toward leaf-spine fabrics. When helpful, subscribed datasets were used for company financials and intelligence, news and financials, and patent databases to cross-check product momentum and shipment proxy signals without relying on any single source. The desk sources listed here are illustrative only, and many other public references were also used for data collection, cross-checking, and clarification.
Primary Interviews and Surveys
Primary work focused on validating what gets deployed inside US data centers, how quickly refresh cycles are changing, and how pricing and service attach rates move when bandwidth requirements increase. Interviews covered equipment-focused and service-focused stakeholders, as well as operator and channel-side experts, so gaps from desk findings could be closed and assumptions stress-tested by data center type and geography.
Distribution of primary research fieldwork respondents
| Company type | Respondent position |
|---|---|
| Top tier: 39% | CXOs: 14% |
| Mid tier: 46% | Functional/Unit leaders: 41% |
| Smaller Players: 15% | Managers: 45% |
Market-Sizing & Forecasting
Sizing was built by first reconstructing the addressable US networking spend pool from data center expansion and upgrade activity, and then applying penetration and mix assumptions by component type and bandwidth. To keep the numbers realistic, we used a top-down and bottom-up approach, where the top-down view is anchored on data center build and refresh indicators, and then corroborated with selective supplier and channel roll-ups using sampled ASP x volume checks.
A few inputs were treated as key levers, including data center capacity additions and utilization direction, the share of workloads pushing east-west traffic, the pace of 100G to 400G and 800G upgrades, service attach rates for installation and managed support, and observed pricing movement as ports and optics evolve. Where bottom-up signals were incomplete, gaps were handled through conservative interpolation by data center type and bandwidth mix, then re-checked with interview feedback. Forecasts were created using scenario analysis, where base, conservative, and accelerated upgrade paths were tested, and then narrowed using primary consensus on refresh timing and capacity pipelines.
Data Validation & Update Cycle
Outputs were cross-checked against independent signals that should move in the same direction, such as US data center investment activity, power draw indicators, and visible shifts in high-speed port adoption. When a segment total looked out of pattern, the drivers were revisited, then assumptions were adjusted only after a second analyst review and targeted re-contacts where needed.
The report is refreshed annually, and interim updates are made when material events can change deployment pace, pricing, or technology mix. Before delivery, we do a final review pass to capture the latest public disclosures and to confirm the model still aligns with what practitioners are seeing on the ground.
Mordor Intelligence's United States Data Center Networking Market Size Compared Against Other Published Estimates
Published estimates for US data center networking often do not match because the market is defined differently, and the timing of currency, refresh cycles, and product boundaries can vary. Differences also show up when one publisher leans heavily on shipment proxies, while another uses demand-side capacity and upgrade signals.
The biggest gap drivers in this market usually come from whether adjacent networking spend is included, especially enterprise networking that is not tied to data centers, and whether optics, security software, and professional services are counted in the same pool. Some estimates also assume faster ASP declines for high-speed ports, or they apply aggressive adoption curves for AI-driven fabrics without cross-checking them against build pipelines and actual refresh intervals, which can widen the spread.
Benchmark comparison
| Source | Market Size | Gaps in Research Methodology |
|---|---|---|
| Mordor Intelligence | USD 8.18 B (2025) | |
| Trade Journal A | USD 6.90 B (2023) | Uses a global report excerpt for the US value and leans toward product-only tracking, which can undercount services and later-year high-speed upgrade waves when mapped forward. |
| Sector Report B | USD 26.45 B (2025) | Defines the market closer to broad networking equipment spend that touches data centers, and it appears to bundle adjacent enterprise networking categories and a wider set of components, which inflates the pool. |
The table shows that scope choices and upgrade pacing assumptions explain most of the dispersion, more than simple math differences. By keeping the counted spend tied to data center deployments, checking bandwidth transition timing, and re-validating service attach logic during updates, the estimate stays traceable to repeatable inputs, which is the approach used here by Mordor Intelligence.


Key Questions Answered in the Report
What is the current size of the United States data center networking market?
The market stands at USD 8.52 billion in 2026 and is projected to reach USD 10.43 billion by 2031.
Which segment is growing fastest within this market?
Hyperscale cloud deployments are expanding at a 5.85% CAGR due to massive AI cluster investments.
Why are 400G and 800G upgrades important now?
AI workloads and east-west traffic saturate 100G links, making 400G/800G fabrics essential for low-latency GPU communication.
What regions lead new data center builds in the United States?
Northern Virginia and Silicon Valley host the highest facility density, while Texas and select Midwest states are gaining share due to favorable power rates.
Page last updated on:
- Data Center Construction Market Construction across all regions, split by tier, facility size and facility type.
- Data Center Server Market Global servers demand, split by tier, facility size and facility type.
- Data Center Power Market Power systems across all regions, split by component, tier and facility size.
- United States Data Center Server Market The US servers, split by data-center tier, form factor and application / workload.
- United States Data Center Storage Market Storage in the US, split by storage technology, storage type and end user.
- North America Data Center Construction Market North America construction, split by tier, facility size and facility type.
- Data Center Immersion Cooling Market Global immersion cooling demand, split by type, cooling fluid and application.





