
Technology, Media and Telecom
5th MayPricing Strategy for Semiconductor Components
3 Min Read
Multi-Access Edge Computing Market Report is Segmented by Component (Hardware, Software, Services), Deployment Model (Public MEC, Private/On-prem MEC), Application (Smart Manufacturing and IIoT, Connected and Autonomous Vehicles, AR/VR and Metaverse, Smart Cities and Public Safety, and More), End-User Vertical (IT and Telecom, BFSI, Healthcare, and More), and by Geography. The Market Forecasts are Provided in Terms of Value (USD).
Market Overview
| Study Period | 2020 - 2031 |
|---|---|
| Market Size (2026) | USD 9.39 Billion |
| Market Size (2031) | USD 43.43 Billion |
| Growth Rate (2026 - 2031) | 35.84 % CAGR |
| Fastest Growing Market | Asia Pacific |
| Largest Market | North America |
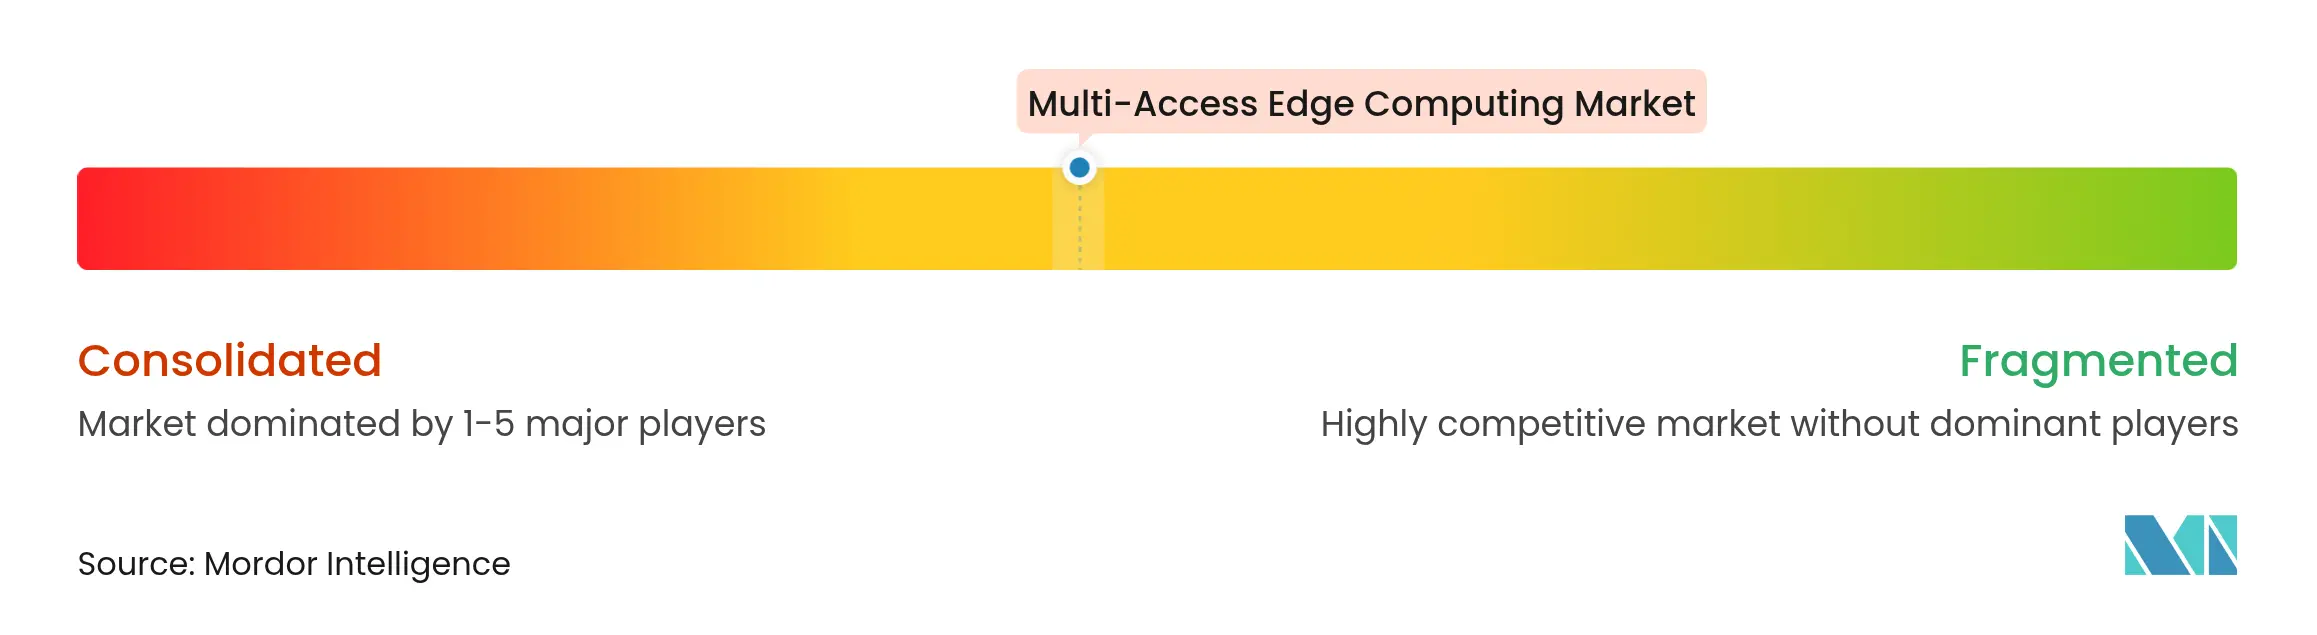
| Market Concentration | Medium |
Major Players *Disclaimer: Major Players sorted in no particular order. Image © Mordor Intelligence. Reuse requires attribution under CC BY 4.0. |
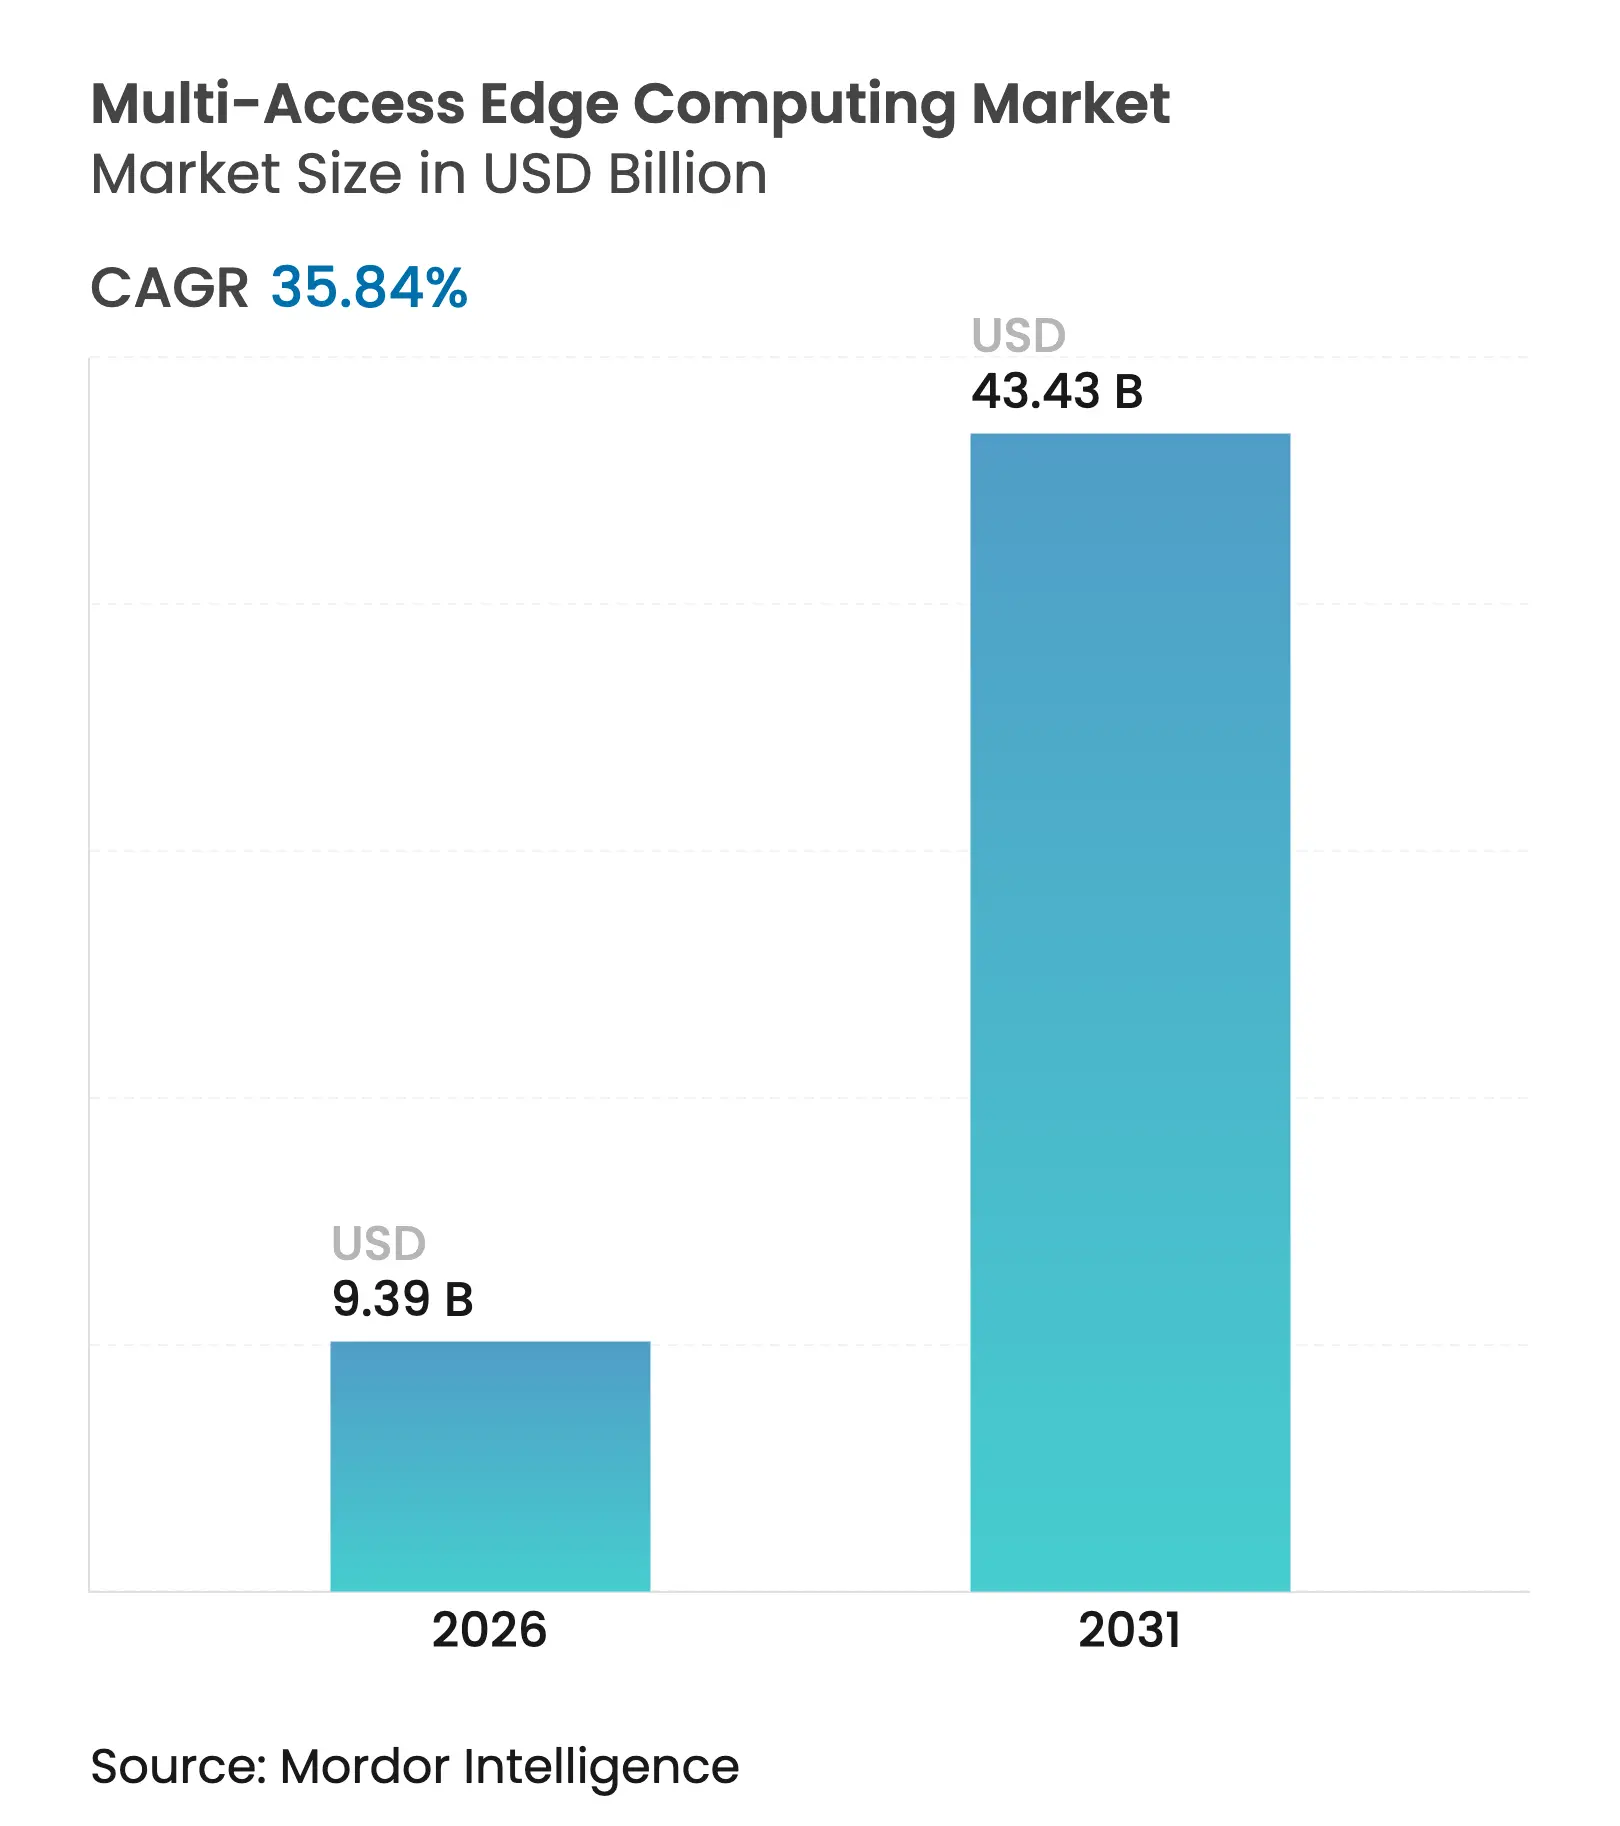
The Multi-Access Edge Computing market size is expected to grow from USD 6.91 billion in 2025 to USD 9.39 billion in 2026 and is forecast to reach USD 43.43 billion by 2031 at 35.84% CAGR over 2026-2031. This outlook reflects the structural pivot from centralized cloud models toward distributed architectures that process data within milliseconds of creation. Demand is fueled by nationwide 5G standalone roll-outs, the need to run artificial intelligence workloads closer to endpoints, and enterprise investments in deterministic applications that cannot tolerate more than 10 milliseconds of round-trip latency. Hardware remains pivotal because every new edge location requires purpose-built servers, radios, and ruggedized network devices. At the same time, managed edge services are scaling faster as enterprises shift complexity to vendors. Capital intensity, security uncertainty, and fragmented orchestration standards temper adoption but have not slowed venture funding or partnership activity that targets video analytics, industrial automation, and autonomous mobility use cases.
Key Report Takeaways
Note: Market size and forecast figures in this report are generated using Mordor Intelligence's proprietary estimation framework, updated with the latest available data and insights as of 2026.
Drivers Impact Analysis
| Driver | (≈) % Impact on CAGR Forecast | Geographic Relevance | Impact Timeline | |||
|---|---|---|---|---|---|---|
5G standalone roll-outs
accelerate MEC adoption
5G standalone roll-outs
accelerate MEC adoption
| +8.5% | Global; Asia-Pacific and North America lead | Medium term (2-4 years) |
(≈) % Impact on CAGR
Forecast
:
+8.5%
|
Geographic Relevance
:Global; Asia-Pacific and North America
lead |
Impact Timeline
:
Medium term (2-4 years)
|
Scaling IoT and data-intensive
endpoints demand ultra-low latency
Scaling IoT and data-intensive
endpoints demand ultra-low latency
| +7.2% | Global; industrial clusters | Long term (≥ 4 years) | |||
Edge-native AI inference
reduces cloud egress cost
Edge-native AI inference
reduces cloud egress cost
| +6.8% | North America and EU; Asia-Pacific ramping | Short term (≤ 2 years) | |||
Carrier “AI factories” and
sovereign micro-datacenters
Carrier “AI factories” and
sovereign micro-datacenters
| +5.1% | Primarily EU; North America secondary | Medium term (2-4 years) | |||
Location-intelligent MEC for
mmWave planning
Location-intelligent MEC for
mmWave planning
| +3.4% | Urban centers worldwide | Medium term (2-4 years) | |||
TSN-enabled Industry 4.0 drives
deterministic workloads
TSN-enabled Industry 4.0 drives
deterministic workloads
| +4.2% | Asia-Pacific, EU, North America | Long term (≥ 4 years) | |||
| Source: Mordor Intelligence | ||||||
5G Standalone Roll-outs Accelerate MEC Adoption
Stand-alone 5G cores remove 4G anchor constraints, letting operators position compute at the cell edge and slice bandwidth for specific tasks. Verizon’s collaboration with NVIDIA shows how spectrum-agnostic private MEC creates dedicated pipes for factory automation.[1]Monica Alleven, “Verizon expands private 5G edge with NVIDIA,” fiercewireless.com In India, Jio’s 5G SA network supports smart manufacturing programs that need guaranteed latency, while Nokia added 55 new private 5G customers in 2024, signaling the link between SA investment and edge uptake. Enterprises see direct performance gains because localized packet routing cuts round-trip times to single-digit milliseconds, making predictive maintenance and collaborative robots viable at scale.
Scaling IoT and Data-Intensive Endpoints Demand Ultra-Low Latency
Industrial sites generate terabytes of sensor data daily. Offloading every packet to hyperscale clouds strains bandwidth budgets and erodes determinism. Research estimating the Industrial IoT economy at USD 3.3 trillion by 2030 underscores the scale of the challenge.[2]Ericsson, “Edge Computing Opportunities,” ericsson.com Time-Sensitive Networking ensures predictable frames, yet only localized compute clears the last-mile latency hurdle. Connected vehicle pilots require lidar and camera fusion in under 10 milliseconds, which centralized cores cannot deliver. Operators, therefore, deploy hardened edge nodes inside manufacturing parks and along highways to meet safety requirements without saturating backhaul links.
Edge-Native AI Inference Reduces Cloud Egress Cost
AI workloads that once ran exclusively in region-wide data centers are moving to micro-datacenters. Microsoft’s USD 40 million investment in Armada demonstrates cost avoidance: inferencing 4K video on-site eliminates gigabytes of daily cloud egress fees Qualcomm’s push for low-power system-on-chips reflects the need for efficient thermal envelopes in retail kiosks and roadside cabinets. When models execute locally, decisions are returned within single-digit milliseconds, enabling real-time quality inspection and dynamic pricing engines that lose value when delayed by long WAN paths.
Carrier “AI Factories” and Sovereign Micro-Datacenters
European policy makers fund sovereign edge clusters to keep sensitive workloads within national borders. The EUR 3 billion virt8ra project plans 10,000 climate-neutral micro-datacenters across six countries. Operators now tout networks as compute fabrics rather than commodity pipes, pursuing subscription revenues tied to analytics and model hosting. The model helps enterprises meet GDPR while accessing elastic compute far from centralized hyperscale regions.
Restraints Impact Analysis
| Restraint | (≈) % Impact on CAGR Forecast | Geographic Relevance | Impact Timeline | |||
|---|---|---|---|---|---|---|
High capex and opex for
distributed edge nodes
High capex and opex for
distributed edge nodes
| -4.8% | Global; smaller operators hardest hit | Short term (≤ 2 years) |
(≈) % Impact on CAGR
Forecast
:
-4.8%
|
Geographic Relevance
:
Global; smaller operators
hardest hit
|
Impact Timeline
:
Short term (≤ 2 years)
|
Persistent security and
data-sovereignty concerns
Persistent security and
data-sovereignty concerns
| -3.2% | EU and regulated industries | Medium term (2-4 years) | |||
Fragmented MEC API and
orchestration standards
Fragmented MEC API and
orchestration standards
| -2.1% | Global cross-vendor projects | Long term (≥ 4 years) | |||
Shortage of edge-native
engineering talent
Shortage of edge-native
engineering talent
| -1.9% | Developed markets | Medium term (2-4 years) | |||
| Source: Mordor Intelligence | ||||||
High Capex and Opex for Distributed Edge Nodes
Edge hardware costs 3–5 times more per compute unit than hyperscale racks because each site needs dedicated power, cooling, and hardened enclosures. The European Commission notes that achieving 10,000 carbon-neutral nodes demands sustained infrastructure outlays many midsize carriers cannot justify without usage guarantees.[3]European Commission, “Digital Sovereignty Strategy,” digital-strategy.ec.europa.eu Operations teams must service hundreds of remote cabinets, eroding the economies of scale that data hubs enjoy. As a result, several regional operators are deferring expansion until revenue models mature.
Persistent Security and Data-Sovereignty Concerns
Distributing workloads multiplies attack surfaces. Enterprises must defend firmware, hypervisors, and application layers across thousands of unmanned sites. Regulators in Europe mandate that personal data remain within national boundaries, yet multi-tenant edge zones often span borders. A lack of unified security baselines complicates audits, leading some healthcare providers to postpone latency-sensitive deployments despite clinical demand.
By Component: Hardware Dominance Faces Services Disruption
Hardware commanded 58.61% of the Multi-Access Edge Computing market in 2025 because each new edge location needs purpose-built servers, radios, and storage systems. Vendors embed accelerators for AI inference and offer ruggedized chassis suitable for curb-side or factory-floor placement. Over the forecast period, services are scaling faster at 38.27% CAGR as enterprises outsource deployment and lifecycle tasks they cannot staff internally. Managed offerings from hyperscalers bundle zero-touch provisioning, automated patch management, and consumption-based billing that mask underlying hardware complexity.
The shift toward as-a-service models shows how value migrates up the stack. Professional services wrap advisory, site design, and integration with on-premises operational technology, removing friction for manufacturers and hospitals. Open-source orchestration frameworks have also moderated hardware price premiums, allowing buyers to weigh vendors on total solution economics rather than proprietary silicon alone.
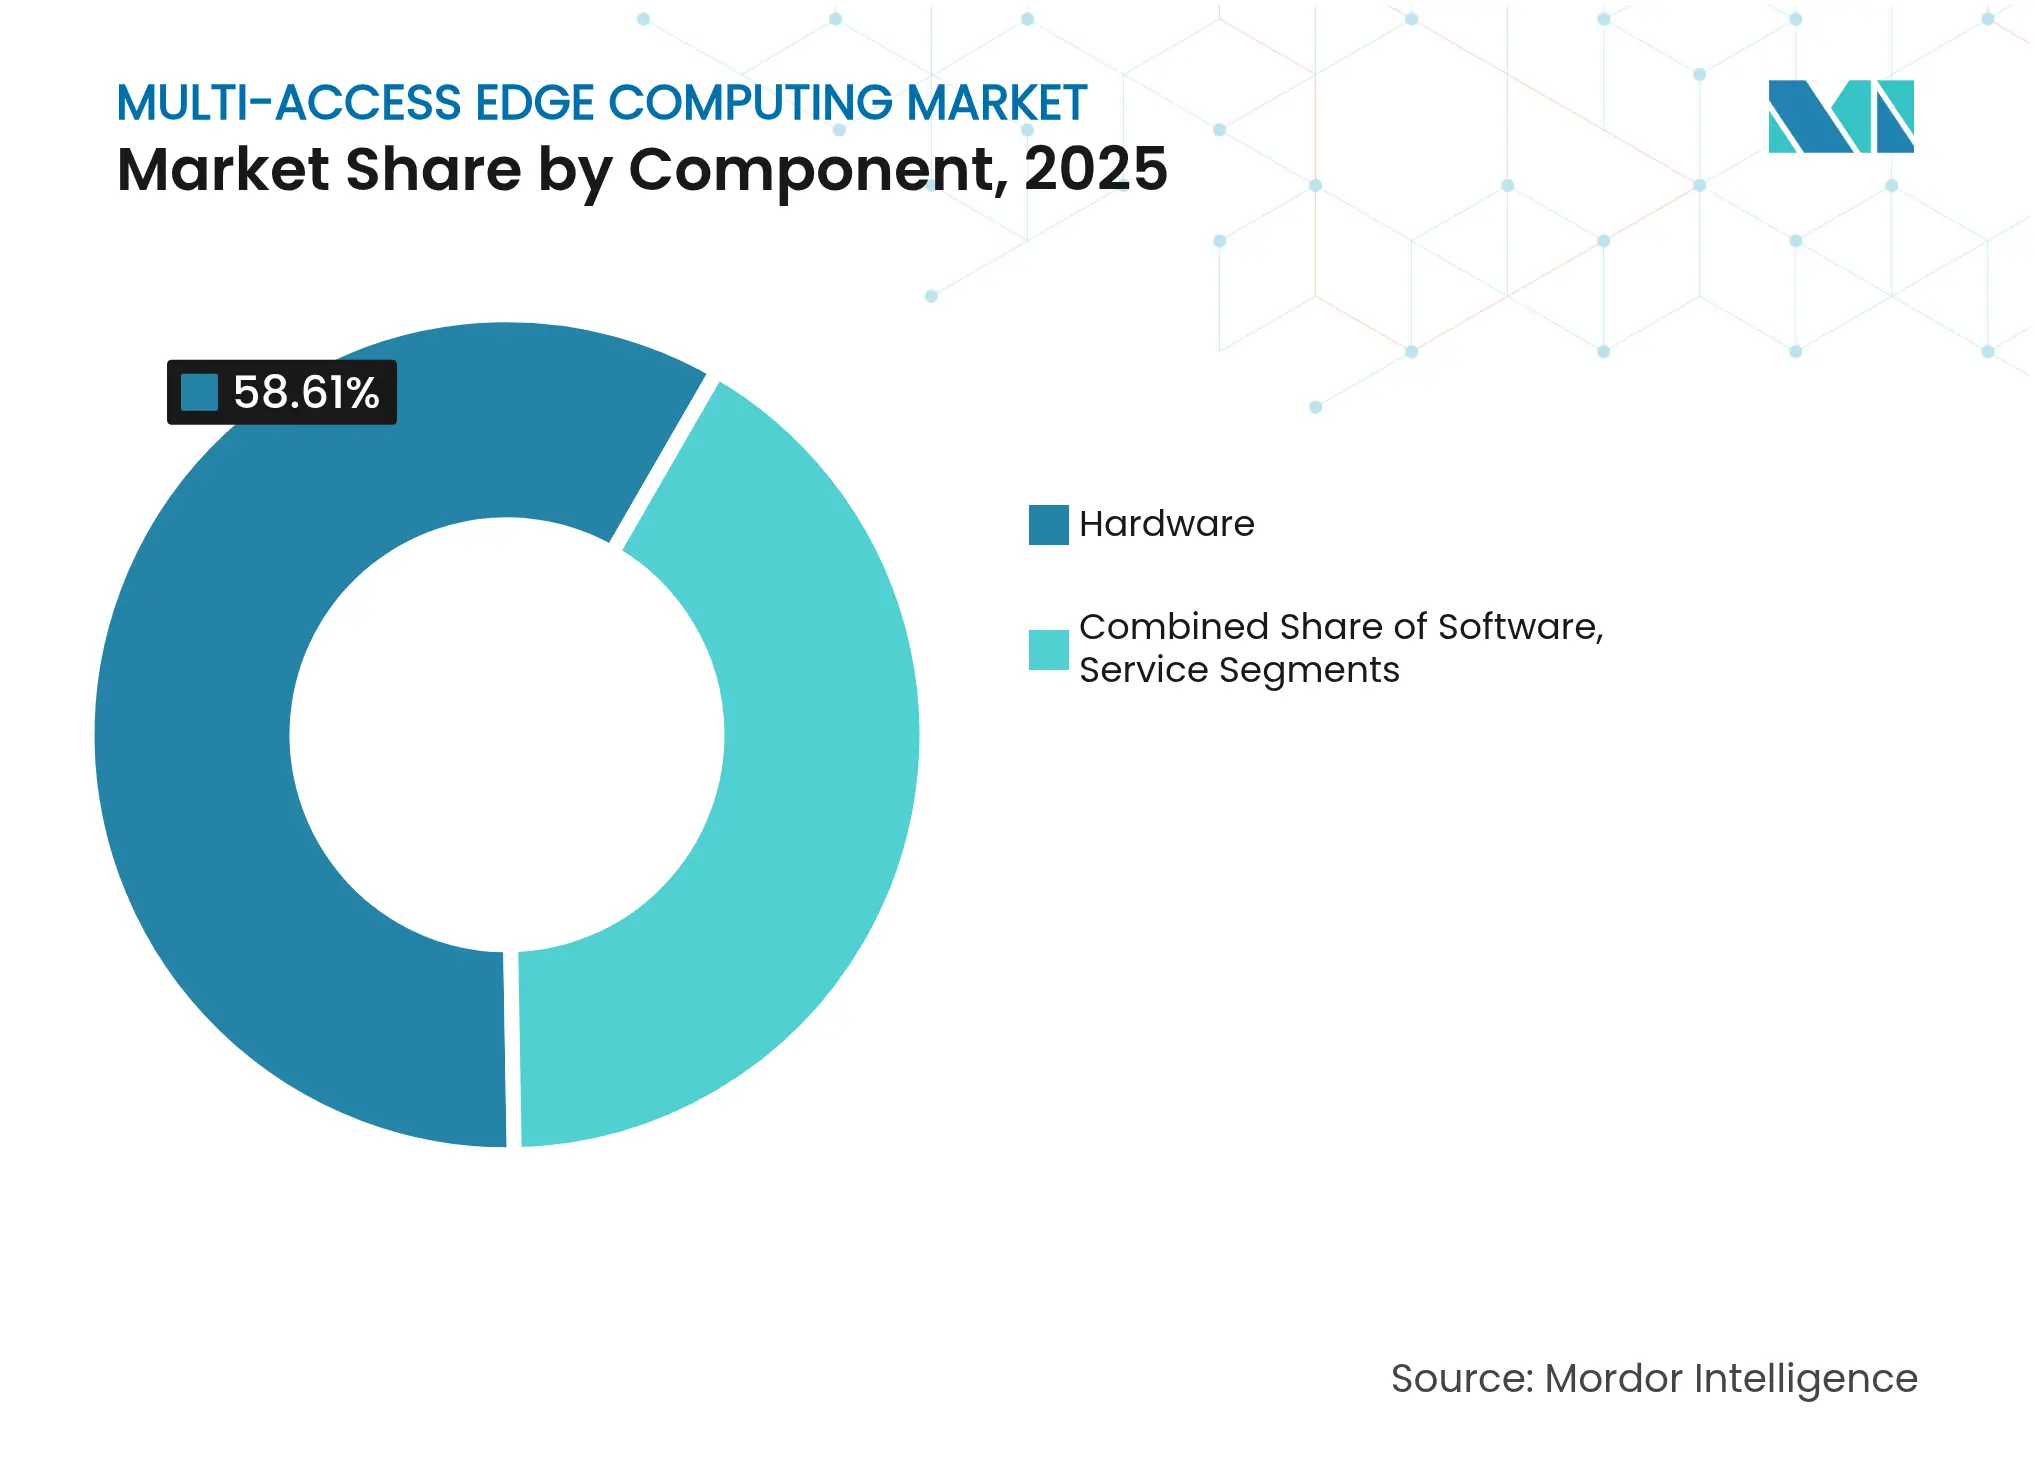
Note: Segment shares of all individual segments available upon report purchase
By Deployment Model: Private Leadership Challenged by Public Growth
Private installations held 51.98% share in 2025 because manufacturers, airports, and energy operators needed deterministic bandwidth and strict data isolation. Enterprises installed on-site compute clusters linked to private 5G radios, securing operational technology networks while lowering backhaul costs. Public MEC, however, is set for a 39.1% CAGR as carriers productize excess tower space and fiber routes. Shorter payback periods and consumption pricing appeal to retailers and logistics firms that lack capital budgets for dedicated gear.
Interoperability is improving as standards mature, easing migration between private and public nodes. Operators now guarantee latency and throughput via network slicing, eroding one of the private model’s historical advantages. As performance parity emerges, cost efficiency and elastic scaling could tip more workloads toward shared platforms, especially for seasonal demand such as sports streaming or pop-up events.
By Application: Smart Cities Dominance Threatened by Autonomous Vehicle Surge
Surveillance, traffic management, and public-safety analytics gave smart-city programs 63.92% of 2025 revenues, but connected and autonomous vehicles will grow the fastest at 40.45% CAGR. Vehicles generate multi-gigabit sensor feeds that demand sub-10 millisecond processing for collision avoidance. Municipalities are integrating roadside units with cellular V2X modules that forward data to curb-side compute pods instead of distant data centers.
Emerging use cases extend beyond mobility. Metaverse entertainment and real-time translation rely on edge-enhanced graphics rendering and speech models. Remote surgery also gains traction as hospitals validate latency budgets that keep haptic feedback within 10 milliseconds. Each domain illustrates how deterministic response reshapes design choices across software stacks and hardware footprints.
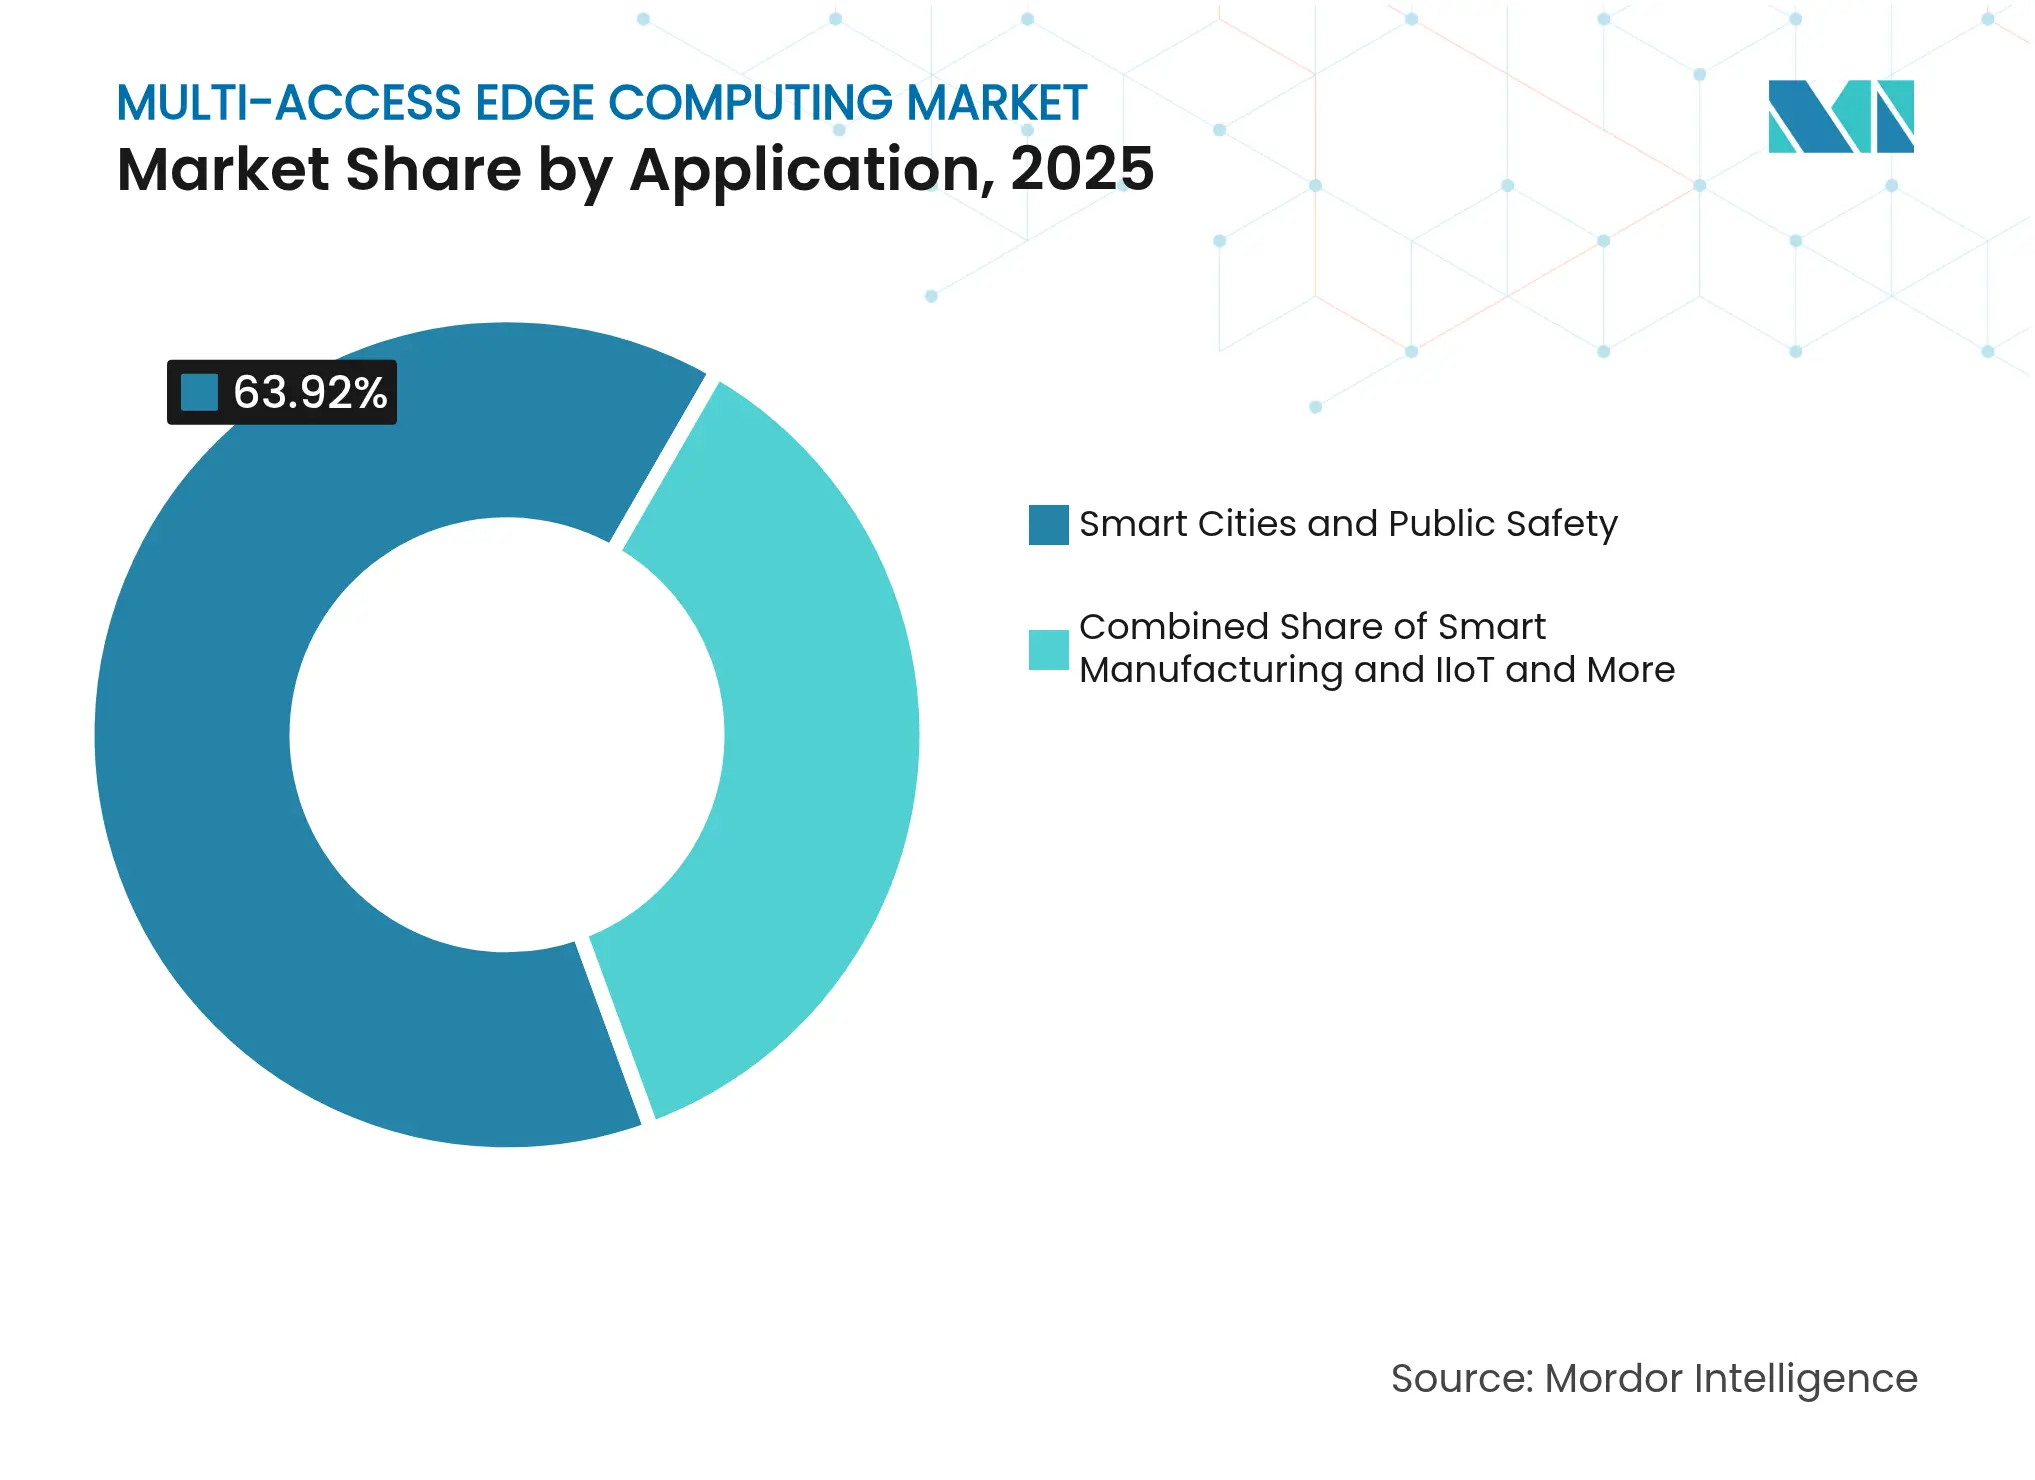
Note: Segment shares of all individual segments available upon report purchase
By End-User Vertical: IT and Telecom Leadership Faces Healthcare Disruption
IT and telecom firms own 43.05% of current demand because they control infrastructure, spectrum, and developer ecosystems. They deploy edge sites to optimize their own services, then monetize spare capacity. Healthcare, however, is on pace for a 41.2% CAGR. Tele-ICU monitoring, robotic surgery, and imaging diagnostics all need predictable latency and local data residency. Clinics lacking specialized surgeons can tap remote expertise when edges host inference models and real-time video stitching.
Manufacturing, automotive, and energy sectors follow closely, adopting predictive maintenance, digital twins, and grid balancing. Banking uses edge fraud detection to flag anomalies within the authorization window, while retail chains push tailored promotions to in-store displays after analyzing shopper movement locally.
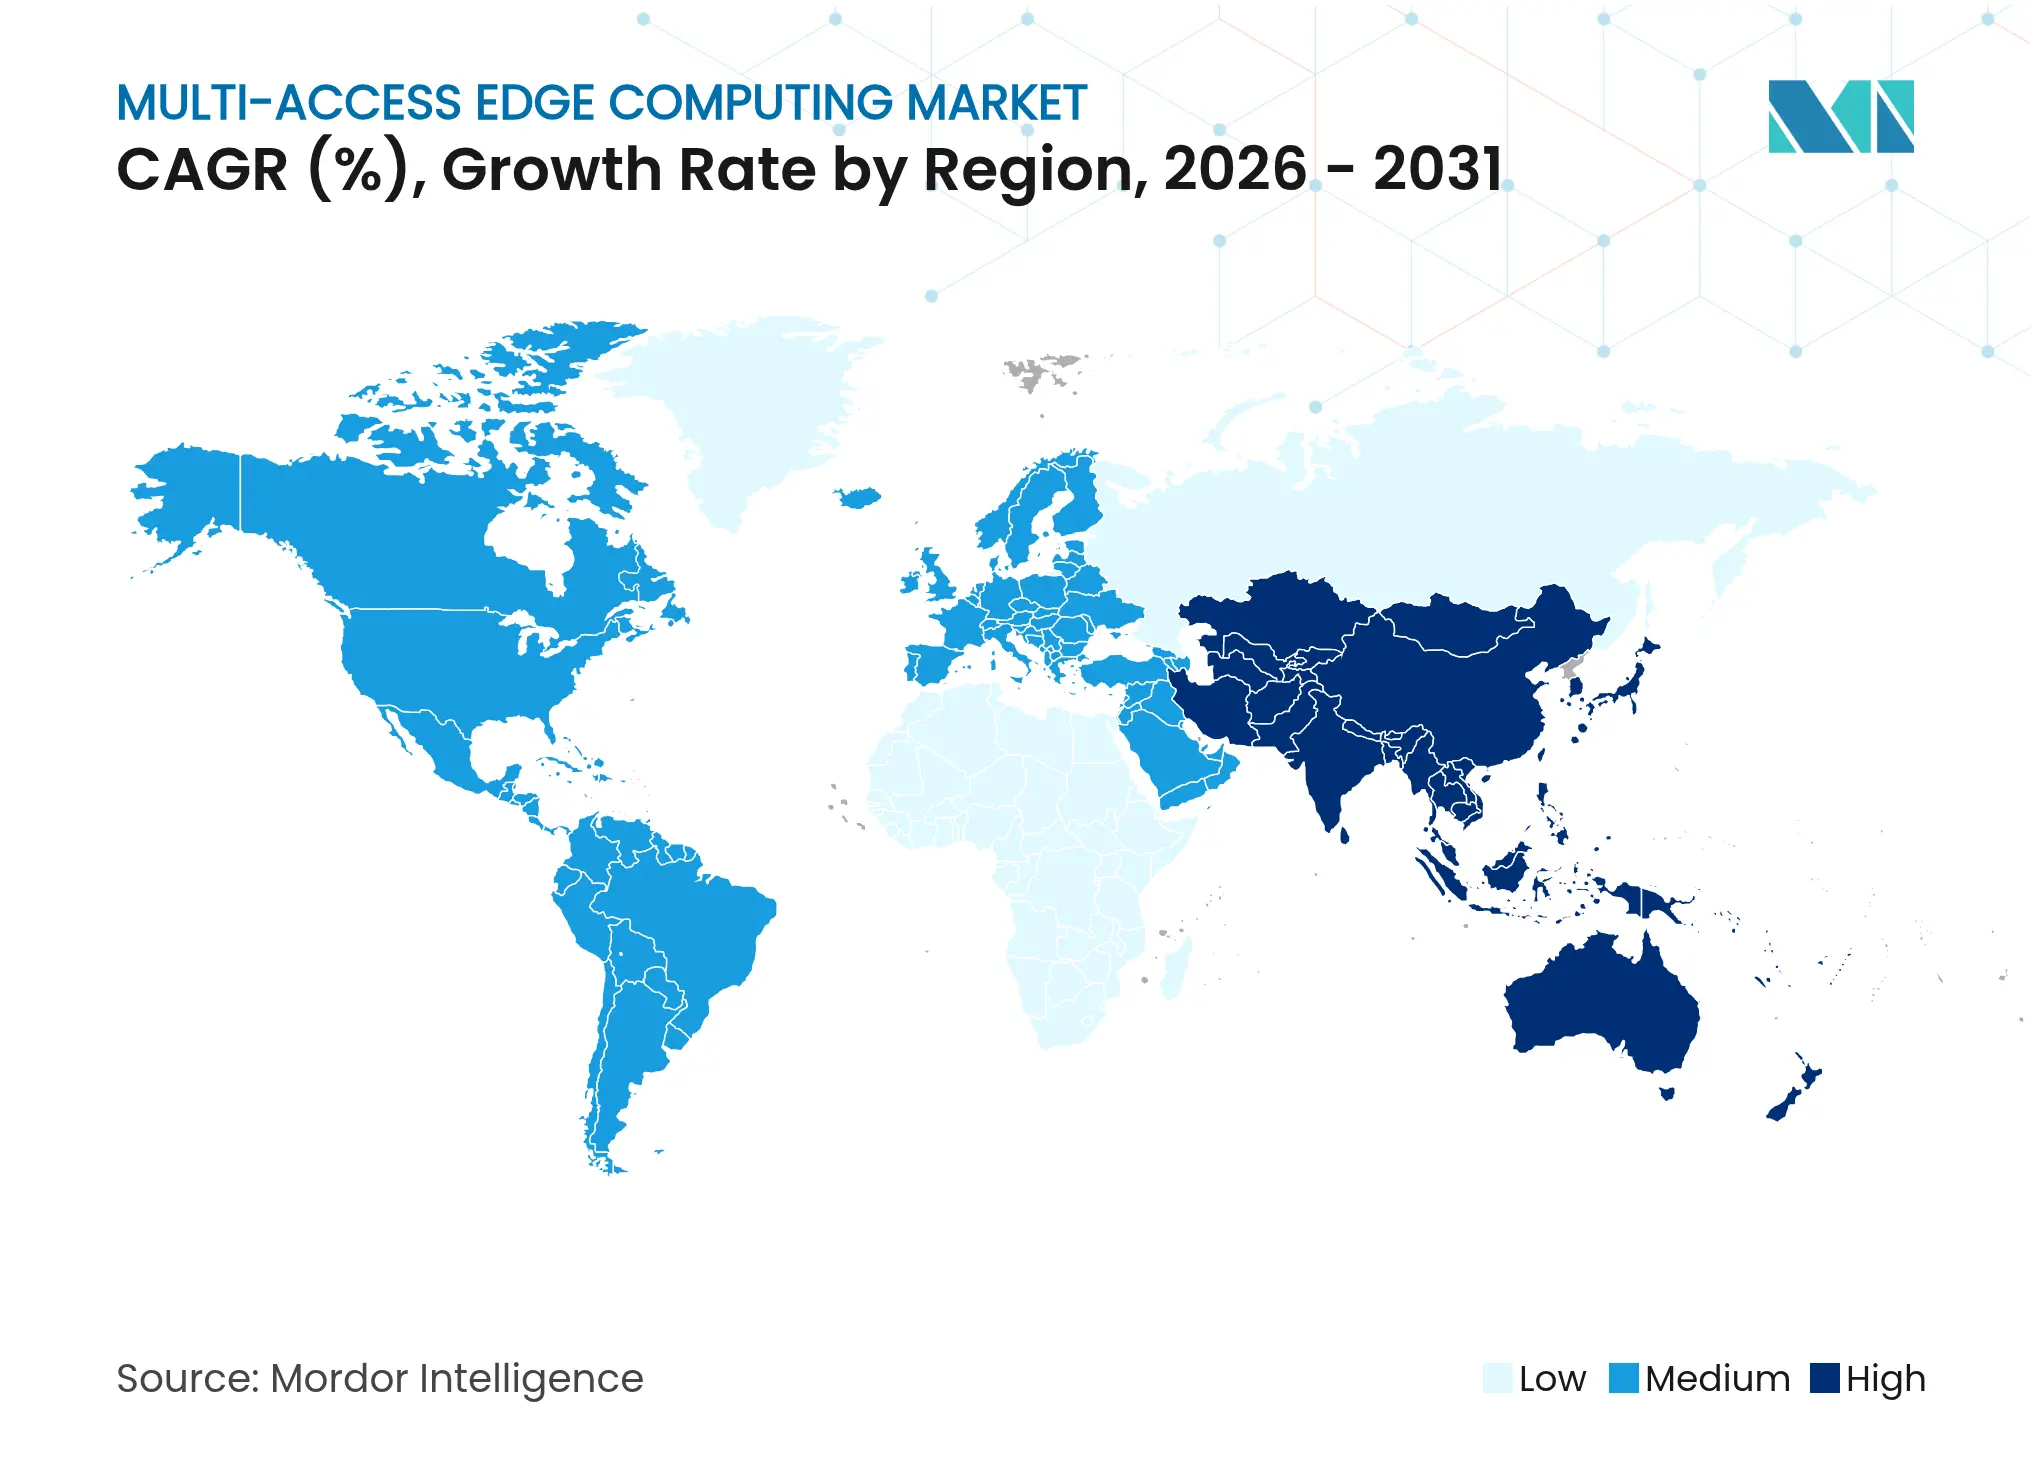
North America captured 38.84% of 2025 spending, anchored by hyperscale cloud headquarters, early 5G standalone roll-outs, and venture funding worth USD 2.63 billion for domestic edge start-ups. Federal programs streamline private spectrum licensing, letting manufacturers deploy on-site cores quickly. Labor costs and planning approvals remain hurdles that lengthen deployment timelines, yet the ecosystem benefits from lead-user enterprises willing to validate new service constructs and consumption models.
APAC exhibits the highest growth momentum at 42.8% CAGR to 2031. China’s vehicle-road-cloud corridors and India’s 100-city smart program are seeding hundreds of pilot zones that need distributed compute. Regional data center capacity topped 12,206 MW in 2024, with another 14,338 MW under construction, giving operators room to extend metro sites into micro-edge footprints. Government stimulus funds support 5G base-station densification, which in turn lowers hop counts between cellular users and nearby compute nodes.
Market Concentration
Competition spans three overlapping strata. Hyperscale clouds (AWS, Microsoft, IBM) leverage global developer reach and mature orchestration to win usage-based workloads. Telecommunications equipment makers (Ericsson, Nokia, Huawei) bundle radios, transport, and MEC software, easing procurement for operators that prefer single-stack solutions. Specialized platforms such as Vapor IO, EdgeConneX, and StackPath focus on colocation, neutral-host towers, and bare-metal APIs that attract cloud-native developers seeking location diversity.
Strategic alliances blur traditional lines. Ericsson and Dell integrate open RAN radios with factory edge servers, offering turnkey Industry 4.0 kits. NVIDIA partners with carriers to host AI inference engines on GPU-rich cards that slot into base-band units, challenging proprietary silicon from incumbent network vendors. Start-ups like Code Metal raise early-stage capital to deliver lightweight orchestration aimed at space-constrained roadside cabinets, chipping away at legacy containers designed for ample data-center racks.

*Disclaimer: Major Players sorted in no particular order
1. INTRODUCTION
2. RESEARCH METHODOLOGY
3. EXECUTIVE SUMMARY
4. MARKET LANDSCAPE
5. MARKET SIZE AND GROWTH FORECASTS (VALUE)
6. COMPETITIVE LANDSCAPE
7. MARKET OPPORTUNITIES AND FUTURE OUTLOOK
Multi-access edge computing (MEC) is a type of network architecture that provides cloud computing capabilities and an IT service environment at the edge of the network. It brings technology resources closer to the end user. Data is processed and stored at the network's edge, not at some distant data center, significantly reducing latency.
The multi-access edge computing market is segmented by component (hardware, software, services), by end-user (BFSI, IT and telecom, healthcare, retail and e-commerce, manufacturing, automotive, other end-users), by geography (North America, Europe, Asia-Pacific, Latin America, Middle East and Africa). The market sizes and forecasts are provided in terms of value (USD) for all the above segments.
Pricing Strategy for Semiconductor Components
3 Min Read
Accelerating Additive Manufacturing Adoption in India
3 Min Read
Unlocking Saudi Arabia’s Regional Tourism Growth Potential
5 Min Read
When decisions matter, industry leaders turn to our analysts. Let’s talk.