Motor Vehicle Sensor Market Size and Share
Market Overview
| Study Period | 2019 - 2030 |
|---|---|
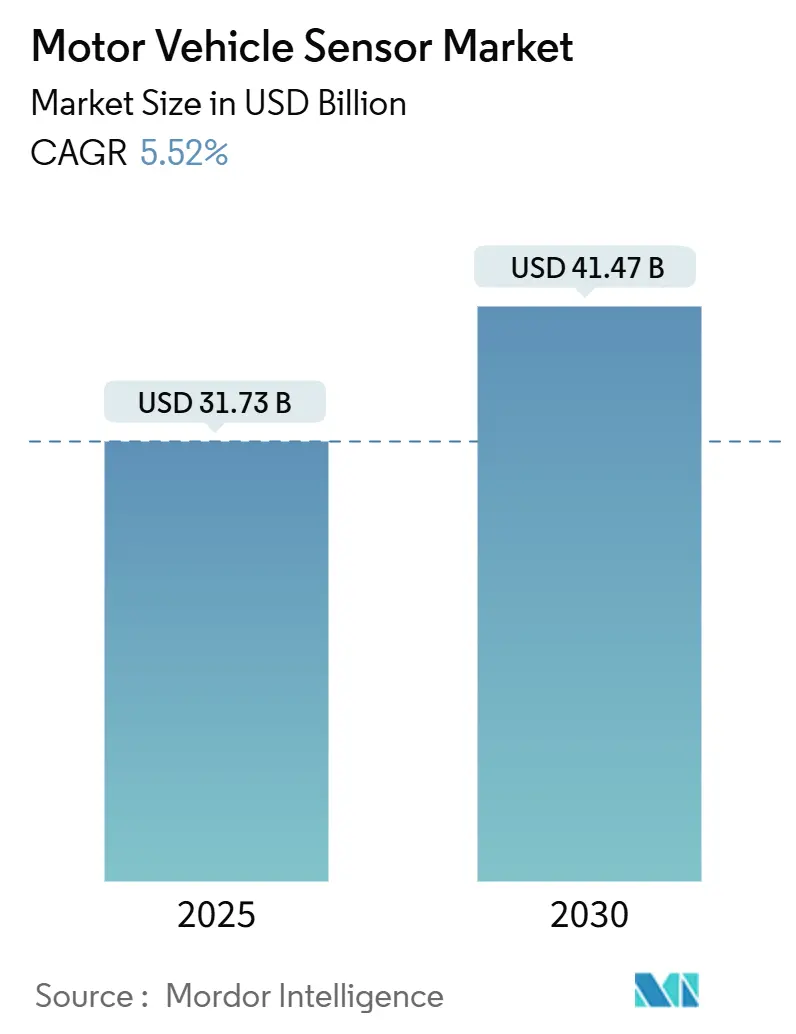
| Market Size (2025) | USD 31.73 Billion |
| Market Size (2030) | USD 41.47 Billion |
| Growth Rate (2025 - 2030) | 5.52% CAGR |
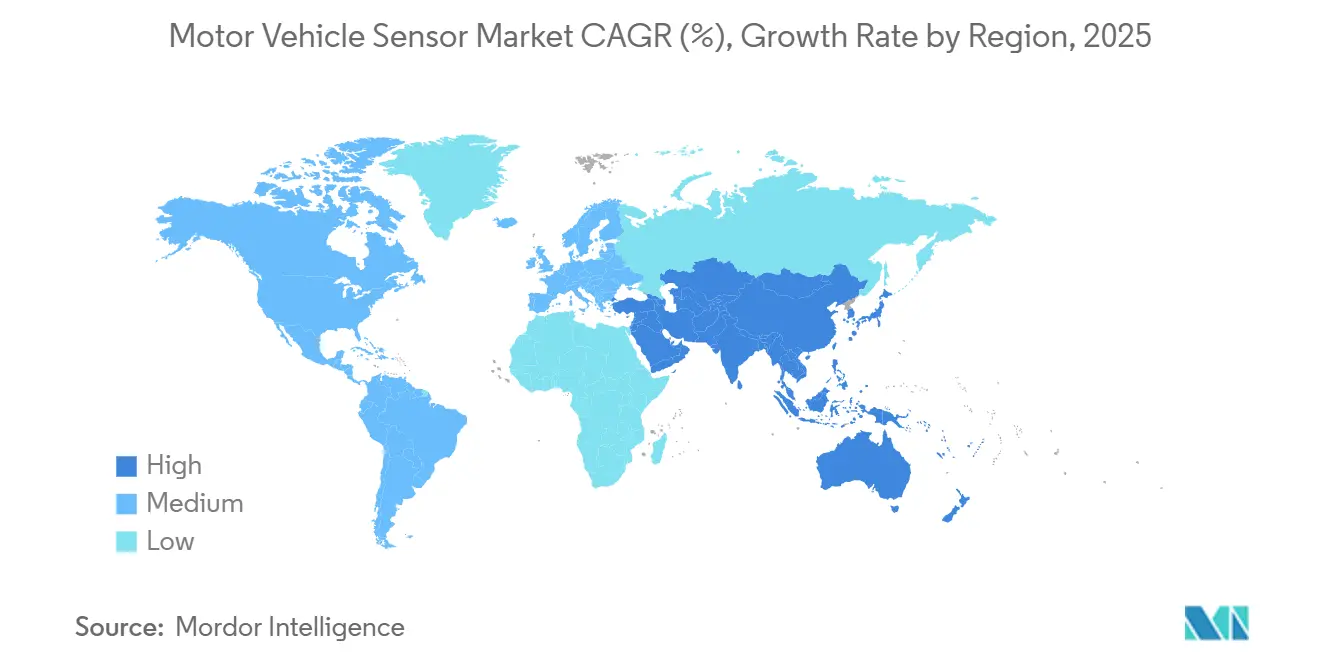
| Fastest Growing Market | South America |
| Largest Market | Asia Pacific |
| Market Concentration | Medium |
Major Players *Disclaimer: Major Players sorted in no particular order Image © Mordor Intelligence. Reuse requires attribution under CC BY 4.0. | |
Motor Vehicle Sensor Market Analysis by Mordor Intelligence
The motor vehicle sensor market size stands at USD 31.73 billion in 2025 and is forecast to reach USD 41.47 billion by 2030, registering a 5.52% CAGR during the period. Sustained regulatory pressure for Advanced Driver Assistance Systems (ADAS), accelerating electrification, and the transition toward software-defined vehicles keep sensor demand on a robust growth path even as mature pressure- and temperature-sensing categories plateau. Platform consolidation around centralized domain controllers favors suppliers with broad portfolios who can deliver complete sensing suites, while the proliferation of edge-AI and 4D LiDAR creates premium niches. Regional re-shoring strategies in China, India, and ASEAN rebalance production footprints and intensify price competition, but they also shorten supply chains and spur local content incentives that lift overall volumes. At the same time, semiconductor capacity constraints and OEM cost-down programs temper pricing power, forcing vendors to pursue scale, process innovation, and software monetization.
Key Report Takeaways
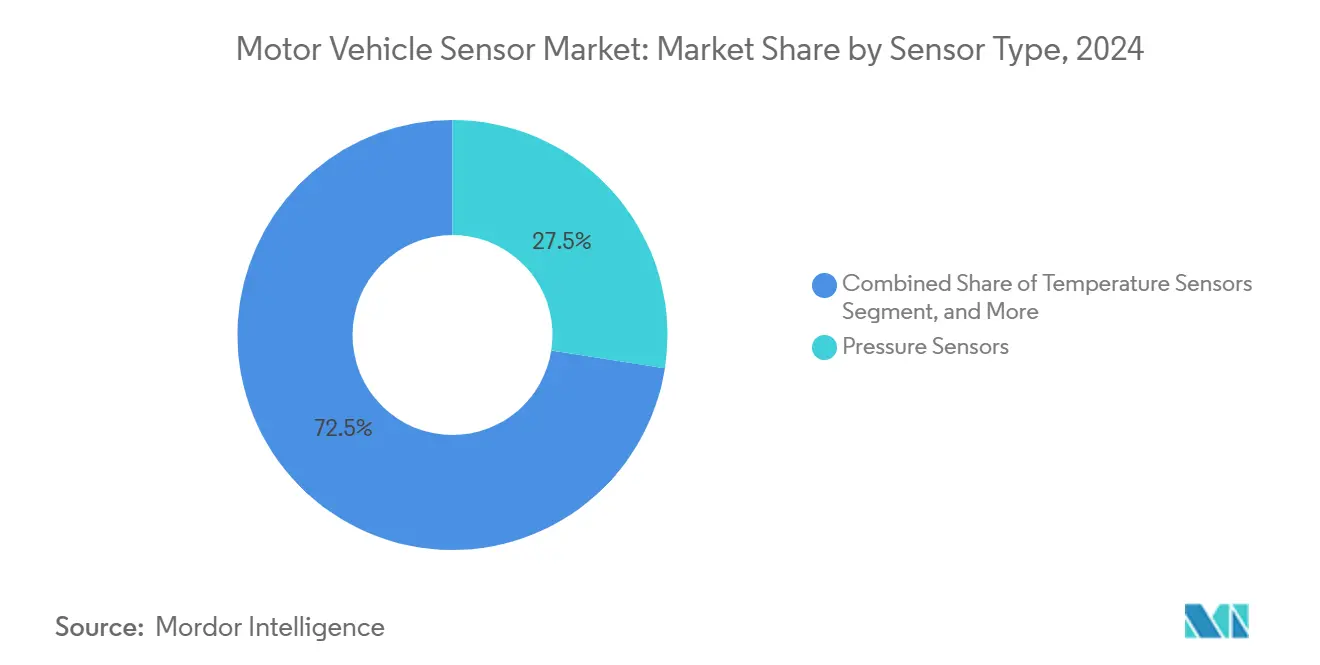
- By sensor type, pressure sensors commanded 27.47% of the motor vehicle sensor market share in 2024, whereas gas and particulate sensors are forecast to expand at a 5.93% CAGR through 2030.
- By vehicle type, passenger cars maintained 53.42% revenue share in 2024, while hybrid electric vehicles are projected to post the fastest 6.12% CAGR to 2030.
- By application, ADAS held 26.93% of the motor vehicle sensor market size in 2024 and powertrain and emission control applications are slated to grow at a 6.14% CAGR over the forecast horizon.
- By propulsion type, battery electric vehicles accounted for 42.98% share of the motor vehicle sensor market size in 2024, whereas fuel-efficient HEV architectures lead growth at 6.12% CAGR.
- By geography, Asia-Pacific led with 44.32% revenue share in 2024; South America is set to record the quickest 6.84% CAGR through 2030.
Global Motor Vehicle Sensor Market Trends and Insights
Drivers Impact Analysis*
| Driver | (~) % Impact on CAGR Forecast | Geographic Relevance | Impact Timeline |
|---|---|---|---|
| Rising ADAS and autonomous driving adoption | +1.8% | Global; North America and EU lead | Medium term (2–4 years) |
| Stringent global safety regulations | +1.2% | Global; regulatory spill-over from EU to Asia-Pacific | Short term (≤ 2 years) |
| Electrification of powertrains | +1.4% | Global; China and EU core | Medium term (2–4 years) |
| Cost decline in MEMS and CMOS sensor technologies | +0.8% | Global; manufacturing centered in Asia-Pacific | Long term (≥ 4 years) |
| Edge-AI–enabled predictive-maintenance sensors | +0.6% | North America and EU early adopters | Long term (≥ 4 years) |
| Supply-chain localization incentives in ASEAN and India | +0.4% | ASEAN core; spill-over to India | Medium term (2–4 years) |
| Source: Mordor Intelligence | |||
Rising ADAS and Autonomous Driving Adoption
Automakers moving from Level 2 to Level 3 autonomy roughly double sensor content per vehicle, because redundant perception architectures that combine cameras, imaging radar, and 4D LiDAR are now required for functional safety. This unified sensing suite is most attractive when delivered by vendors that can pre-integrate hardware, firmware, and perception algorithms into turnkey modules; the result is a clear shift in OEM sourcing toward full-stack suppliers. Aeva’s USD 50 million joint program with LG Innotek to commercialize frequency-modulated continuous-wave (FMCW) 4D LiDAR units in 2025 underscores how partnerships speed up qualification cycles and reduce cost barriers. OEM experimentation with centralized “sensor-behind-windshield” concepts further tilts demand toward high-resolution sensors that tolerate thermal stress while offering over-the-air calibration. Because ADAS features such as automated lane keeping and traffic-jam pilots are becoming standard in upper-mid trims, annual sensor attach rates scale rapidly even in cost-sensitive segments.
Stringent Global Safety Regulations
The European Union’s General Safety Regulation has set a compliance floor that mandates autonomous emergency braking, driver monitoring, and lane-keeping assist on every passenger car registered after July 2025. Similar rules are being adopted in South Korea, Japan, and several ASEAN nations, creating global homogeneity that enables sensor platform reuse across markets. Compliance to ISO 26262 functional-safety targets and the new ISO/SAE 21434 cyber-security norm, however, raises non-recurring engineering costs, making it progressively harder for small vendors to clear qualification hurdles. Tier-1 suppliers equipped with in-house test tracks and certified safety culture are therefore able to amortize standards-driven costs across hundreds of programs, widening competitive moats.[1]TÜV SÜD, “Functional Safety Automotive Standard ISO 26262,” tuvsud.com
Electrification of Powertrains
Battery packs in 800 V architectures can contain more than 200 temperature points, six current bars, and multiple cell-level voltage taps, so electrification can increase sensor bill-of-materials value by 40% versus ICE platforms. Continental’s e-Motor Rotor Temperature Sensor improves accuracy from ±15 °C to ±3 °C and helps OEMs reduce rare-earth magnet loading, directly lowering traction-motor costs. Beyond traction, silicon-carbide inverter modules add new pressure on current-sensing precision, while hydrogen-ready powertrains require integrated gas-leak detection systems. Vendors who already have galvanic-isolation know-how and high-voltage experience command premium design-win fees, especially in China where 800 V platforms dominate premium EV launches.
Cost Decline in MEMS and CMOS Sensor Technologies
Smartphone volumes have driven monumental capital investment in 8-inch MEMS fabs and 12-inch CIS lines, pushing down unit costs for accelerometers, gyros, barometric sensors, and image sensors by 15–20% per year. Samsung Electro-Mechanics’ 2.2 µF MLCC designed specifically for LiDAR subsystems showcases how component miniaturization is unlocking compact sensor assemblies with almost no cost penalty. [2]Samsung Electro-Mechanics, “Samsung Electro-Mechanics Unveils World’s First MLCC for LiDAR Applications,” samsungsem.com While lower ASPs squeeze gross margins, OEMs reinvest the savings into additional sensing roles such as cabin occupancy detection and road-noise cancelation microphones. Scale economies therefore extend total addressable market volume even though unit revenues moderate.
Restraints Impact Analysis*
| Restraint | (~) % Impact on CAGR Forecast | Geographic Relevance | Impact Timeline |
|---|---|---|---|
| Pricing pressure from Tier-1 OEMs | –1.1% | Global; acute in cost-sensitive models | Short term (≤ 2 years) |
| Shortage of automotive-grade chip-foundry capacity | –0.9% | Global; Asia-Pacific nodes most constrained | Medium term (2–4 years) |
| Functional-safety (ISO 26262) compliance costs | –0.5% | Global; emerging markets hit harder | Long term (≥ 4 years) |
| Cyber-security certification bottlenecks | –0.3% | North America and EU regulations first | Medium term (2–4 years) |
| Source: Mordor Intelligence | |||
Pricing Pressure from Tier-1 OEMs
Platform modularization lets automakers leverage the same sensor reference design across dozens of models and therefore negotiate rock-bottom pricing. Chinese component makers frequently undercut established brands by 20–30%, forcing incumbents either to slash margins or bundle software-enhanced diagnostics to justify premiums. When 2023 semiconductor shortages briefly flipped bargaining power toward suppliers, OEMs responded by signing long-term sourcing contracts that claw back volume discounts the moment capacity normalized. Consequently, successful vendors hedge margin risk by diversifying into data-analytics subscriptions that transform a USD 2 hardware ASP into recurring revenue.
Shortage of Automotive-Grade Chip Foundry Capacity
Mature 90 nm and 130 nm nodes remain critical for safety-certified micro-controllers and mixed-signal sensor ASICs, yet most capital expenditure funnels into sub-10 nm smartphone logic. Automotive now commands 8% of global wafer starts, projected to reach 14% by 2030, but absolute volume still pales against consumer electronics. Vendors without multiyear wafer agreements find themselves queueing behind higher-volume buyers whenever a sudden demand spike occurs. The result is a chronic allocation risk that lengthens design cycles, prompts costly re-spins around alternative silicon, and caps the overall motor vehicle sensor market growth trajectory despite robust end-customer demand.
*Our forecasts treat driver/restraint impacts as directional, not additive. The impact forecasts reflect baseline growth, mix effects, and variable interactions.
Segment Analysis
By Sensor Type: Emissions Control Accelerates Gas and Particulate Adoption
The segment generated USD 8.72 billion in 2024, equal to 27.47% of the motor vehicle sensor market size, largely on the back of ubiquitous pressure sensors deployed in brake, HVAC, and engine subsystems. New emissions mandates now propel gas and particulate devices, the fastest-growing sub-category at a 5.93% CAGR through 2030. [3]Bosch Mobility, “Particulate Matter Sensor,” bosch-mobility.com As OEMs race to meet Euro VII and China VII deadlines, diesel particulate filters and selective catalytic-reduction systems require continuous soot-load and NOx feedback, magnifying value per vehicle.
Mature pressure and temperature sensors continue to post volume gains in emerging markets, but their revenue contribution flattens as ASPs erode. Meanwhile, inertial MEMS and miniature magnetometers proliferate inside wire-bondless solid-state battery packs and autonomous drive controllers, opening higher-margin niches for qualified suppliers. Because particulate and NOx sensing involves high-temperature exhaust streams, entry barriers ceramic packaging, platinum catalysts, and high-temperature ASICs protect incumbents from low-cost competitors. Over the forecast horizon, integrated modules that merge pressure, temperature, and soot sensing in a single housing gain traction, delivering wiring-harness savings that OEMs prize in platform cost-reduction roadmaps.


By Vehicle Type: Hybrid Powertrains Expand Sensor Count
Passenger cars represented 53.42% of the 2024 motor vehicle sensor market share thanks to their sheer build volume and rapid ADAS penetration. Although global light-duty sales grow only modestly, sensor content per vehicle rises from an average of 60 units in 2020 to nearly 90 in 2025, cushioning revenue. In contrast, hybrid electric vehicles record a 6.12% CAGR, topping all other drive lines as carmakers pursue pragmatic emissions compliance without the charging-infrastructure constraints of BEVs.
Commercial-vehicle adoption patterns diverge: light vans electrify quickly under urban-delivery decarbonization mandates, whereas heavy trucks focus on telematics and predictive-maintenance sensors that maximize uptime rather than adding comfort features. In the two-wheeler arena, Chinese and Indian e-scooter makers adopt battery-management, connectivity, and traction sensors that were unheard of five years ago, opening green-field demand. Vendors therefore tailor robust, wide-temperature solutions for commercial chassis while emphasizing miniaturization and cost for motorcycles, creating a portfolio balancing act between durability and affordability.
By Application: ADAS Integration Multiplies Per-Unit Value
ADAS accounted for 26.93% of 2024 revenue, translating into nearly USD 8.55 billion, and continues to outpace the broader motor vehicle sensor market at an expected 6.3% CAGR. The motor vehicle sensor market size allocated to powertrain and emission control grows comparably—6.14% CAGR—on the strength of high-voltage, high-temperature opportunities in electrified powertrains.
Body-electronics modules, once satisfied with resistive position sensors, now incorporate capacitive and inductive technologies that enable smart seating, powered tailgates, and noise-canceling headliners. Telematics and over-the-air capabilities generate demand for secure inertial-measurement units and GNSS dead-reckoning clusters. Ultimately, cross-domain fusion drives incremental value: for example, suspension-mounted accelerometers feed both ride-control algorithms and ADAS pothole-avoidance maps, allowing OEMs to repurpose a single sensor’s data for multiple functions and justify its inclusion even in entry trims.

By Propulsion Type: Battery Monitoring Dominates High-Voltage Platforms
Battery electric vehicles captured 42.98% of segment turnover in 2024, translating into USD 13.65 billion within the motor vehicle sensor market. Despite BEVs’ scale, hybrid electric vehicles are the fastest-growing propulsion class; their dual powertrains elevate sensor density because both ICE and battery subsystems coexist. Fuel-cell vehicles remain a niche but command premium hydrogen-leak detection solutions that cost up to 3× standard gas sensors.
State-of-charge algorithms rely on precision coulomb-counting current sensors, while state-of-health metrics depend on distributed temperature probes and impedance spectroscopy. LEM’s coreless Hall sensors designed for 800 V packs exemplify how suppliers monetized the safety imperative for galvanic isolation. As energy-dense solid-state cells reach pilot lines after 2027, new pressure-relief and gas-detection sensors will be required to manage runaway scenarios unique to lithium-metal chemistries, sustaining long-term growth.
Geography Analysis
Asia-Pacific anchored 44.32% of 2024 value, bolstered by China’s localization push that targets more than 70 indigenous automotive semiconductor types by 2030. Beijing’s subsidies accelerate domestic sourcing, yet Japanese sensor specialists remain entrenched at premium OEMs where quality traceability trumps lowest cost. South Korea’s ascendancy as a battery powerhouse draws thermal-management and current-sensing manufacturers, often in joint ventures adjoining gigafactories. India, leveraging its Production Linked Incentive program, lures global Tier-1s to set up wafer-level packaging plants that mitigate global supply-chain shocks.
Southeast Asian nations such as Thailand and Indonesia entice Chinese EV makers to localize assembly through tariff-free export corridors into Europe, which in turn draws sensor ecosystems into green-field industrial parks. Governments sweeten the deal with localized content rules that can slash import tariffs by 30%, and specify that safety-critical sensors must be produced domestically within five years of SOP. This policy architecture shifts a portion of global output from China to ASEAN yet still keeps value in the broader Asia-Pacific bloc.
South America, although accounting for only 6.2% of 2024 revenue, books the highest 6.84% CAGR as Brazil and Argentina capture USD 19 billion in committed Chinese EV investment. Local Tier-2s ramp up plastic over-molding, wire harnesses, and calibration-fixture production to create vertically integrated supply bases. Currency volatility and port constraints remain risks, but OEMs accept them to hedge against geopolitical trade friction elsewhere.
North America and Europe maintain steady, high-value demand anchored in regulatory mandates, over-the-air upgrade capability, and autonomous test corridors. U.S. factories increasingly design sensors around “chiplet” architectures that enable supply flexibility, while European vendors pioneer ISO/SAE 21434-certified sensor gateways that comply with GDPR-style data-protection laws. Although both regions cede volume share to Asia, their share of global sensor R&D spending exceeds 45%, sustaining leadership in next-generation architectures.

Competitive Landscape
The market’s moderate concentration stems from Bosch, Continental, Infineon, Sensata, TE Connectivity, and Denso holding long-standing AEC-Q-100 pedigrees, global footprints, and decades of PPAP know-how. These players use integrated portfolios to cross-sell: a braking-pressure win often secures wheel-speed, inertial, and temperature sockets in the same platform. Infineon’s 2025 creation of the Sensor and RF (SURF) business unit illustrates renewed strategic focus on pairing silicon leadership with system-level software.
At the same time, semiconductor fabs such as NXP push deeper into application-specific modules that integrate radar front-ends with micro-controllers and machine-learning accelerators, enabling Tier-2s to skip discrete integration layers. Start-ups focus on edge-AI predictive-maintenance sensors that combine piezo-electric elements with neural-network inference, licensing data-fusion IP to legacy suppliers who lack software talent. Cyber-security requirements provide another wedge for differentiation; Kyocera’s camera-LiDAR fusion unit sports hardware-root-of-trust encryptors that satisfy UNECE R155 mandates.
Competitive tension centers on balancing vertical integration against ecosystem partnerships. Bosch invests in in-house ASICs to guarantee supply but still licenses algorithms from independent ML firms to accelerate feature updates. Conversely, electronics contract manufacturers in Taiwan and Thailand court Tier-1s with low-cost assembly but lack test-track validation, constraining their access to safety-critical programs. Overall, the landscape rewards players able to synchronize silicon roadmaps with OEM software lifecycles, compress PPAP lead times, and secure decade-long foundry capacity at mature nodes.
Motor Vehicle Sensor Industry Leaders
Sensata Technologies Holding plc
TE Connectivity Ltd.
Infineon Technologies AG
Continental AG
Robert Bosch GmbH
- *Disclaimer: Major Players sorted in no particular order

Recent Industry Developments
- February 2025: NXP Semiconductors reported USD 12.61 billion Q4 2024 revenue and acquired Aviva Links and TTTech Auto to enhance in-vehicle connectivity and safety-critical networking
- February 2025: Samsung Electro-Mechanics introduced a 2.2 µF, 10 V MLCC for LiDAR modules, targeting an automotive MLCC market poised to exceed KRW 10 trillion by 2028.
- February 2025: Transense Technologies’ SAWsense platform was selected for an £11 million U.K. EV drivetrain R&D project led by Protean Electric, aiming to lift in-wheel motor efficiency.
- January 2025: Kyocera unveiled the first camera–LiDAR fusion sensor with perfect optical alignment, eliminating parallax errors in autonomous perception stacks.


Global Motor Vehicle Sensor Market Report Scope
| Pressure Sensors |
| Temperature Sensors |
| Position Sensors |
| Speed and RPM Sensors |
| Inertial Sensors (Accelerometer and Gyroscope) |
| Gas and Particulate Sensors |
| Image and LiDAR Sensors |
| Passenger Cars |
| Light Commercial Vehicles (LCV) |
| Heavy Commercial Vehicles (HCV) |
| Two-Wheelers |
| Off-Highway and Agricultural Vehicles |
| Powertrain and Emission Control |
| Safety and Crash Detection |
| Body Electronics and Comfort |
| Telematics and Infotainment |
| Advanced Driver Assistance Systems (ADAS) |
| Internal Combustion Engine (ICE) |
| Battery Electric Vehicle (BEV) |
| Hybrid Electric Vehicle (HEV) |
| Fuel-Cell Electric Vehicle (FCEV) |
| North America | United States | |
| Canada | ||
| Mexico | ||
| Europe | Germany | |
| United Kingdom | ||
| France | ||
| Russia | ||
| Rest of Europe | ||
| Asia-Pacific | China | |
| Japan | ||
| India | ||
| South Korea | ||
| Australia | ||
| Rest of Asia-Pacific | ||
| Middle East and Africa | Middle East | Saudi Arabia |
| United Arab Emirates | ||
| Rest of Middle East | ||
| Africa | South Africa | |
| Egypt | ||
| Rest of Africa | ||
| South America | Brazil | |
| Argentina | ||
| Rest of South America | ||
| By Sensor Type | Pressure Sensors | ||
| Temperature Sensors | |||
| Position Sensors | |||
| Speed and RPM Sensors | |||
| Inertial Sensors (Accelerometer and Gyroscope) | |||
| Gas and Particulate Sensors | |||
| Image and LiDAR Sensors | |||
| By Vehicle Type | Passenger Cars | ||
| Light Commercial Vehicles (LCV) | |||
| Heavy Commercial Vehicles (HCV) | |||
| Two-Wheelers | |||
| Off-Highway and Agricultural Vehicles | |||
| By Application | Powertrain and Emission Control | ||
| Safety and Crash Detection | |||
| Body Electronics and Comfort | |||
| Telematics and Infotainment | |||
| Advanced Driver Assistance Systems (ADAS) | |||
| By Propulsion Type | Internal Combustion Engine (ICE) | ||
| Battery Electric Vehicle (BEV) | |||
| Hybrid Electric Vehicle (HEV) | |||
| Fuel-Cell Electric Vehicle (FCEV) | |||
| By Geography | North America | United States | |
| Canada | |||
| Mexico | |||
| Europe | Germany | ||
| United Kingdom | |||
| France | |||
| Russia | |||
| Rest of Europe | |||
| Asia-Pacific | China | ||
| Japan | |||
| India | |||
| South Korea | |||
| Australia | |||
| Rest of Asia-Pacific | |||
| Middle East and Africa | Middle East | Saudi Arabia | |
| United Arab Emirates | |||
| Rest of Middle East | |||
| Africa | South Africa | ||
| Egypt | |||
| Rest of Africa | |||
| South America | Brazil | ||
| Argentina | |||
| Rest of South America | |||


Key Questions Answered in the Report
What is the projected value of the motor vehicle sensor market by 2030?
It is forecast to reach USD 41.47 billion by 2030, expanding at a 5.52% CAGR.
Which sensor category is growing the fastest?
Gas and particulate sensors lead growth at a 5.93% CAGR through 2030 as tougher emissions rules take effect.
Which vehicle propulsion type generates the highest sensor revenue today?
Battery electric vehicles hold 42.98% of segment revenue, reflecting intensive battery-management requirements.
Which region will log the quickest growth?
South America is set to post the fastest 6.84% CAGR thanks to new Chinese EV manufacturing investments.
What competitive strategy are leading suppliers using to protect margins?
They bundle hardware with edge-AI software and long-term functional-safety certifications to justify premium pricing and lock in OEM design wins.
How are semiconductor shortages influencing sensor design?
Vendors adopt mature-node “chiplet” architectures and long-term wafer agreements to mitigate foundry-capacity risks that could delay vehicle programs.
Page last updated on:


