Market Overview
| Study Period | 2020 - 2031 |
|---|---|
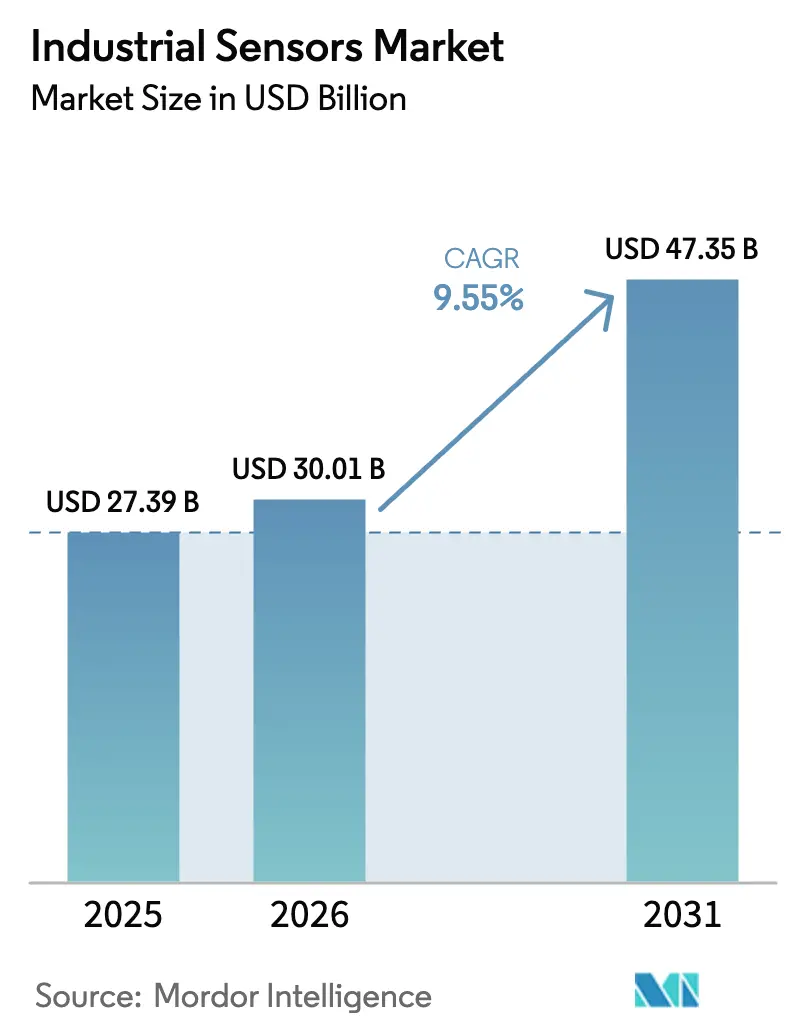
| Market Size (2026) | USD 30.01 Billion |
| Market Size (2031) | USD 47.35 Billion |
| Growth Rate (2026 - 2031) | 9.55% CAGR |
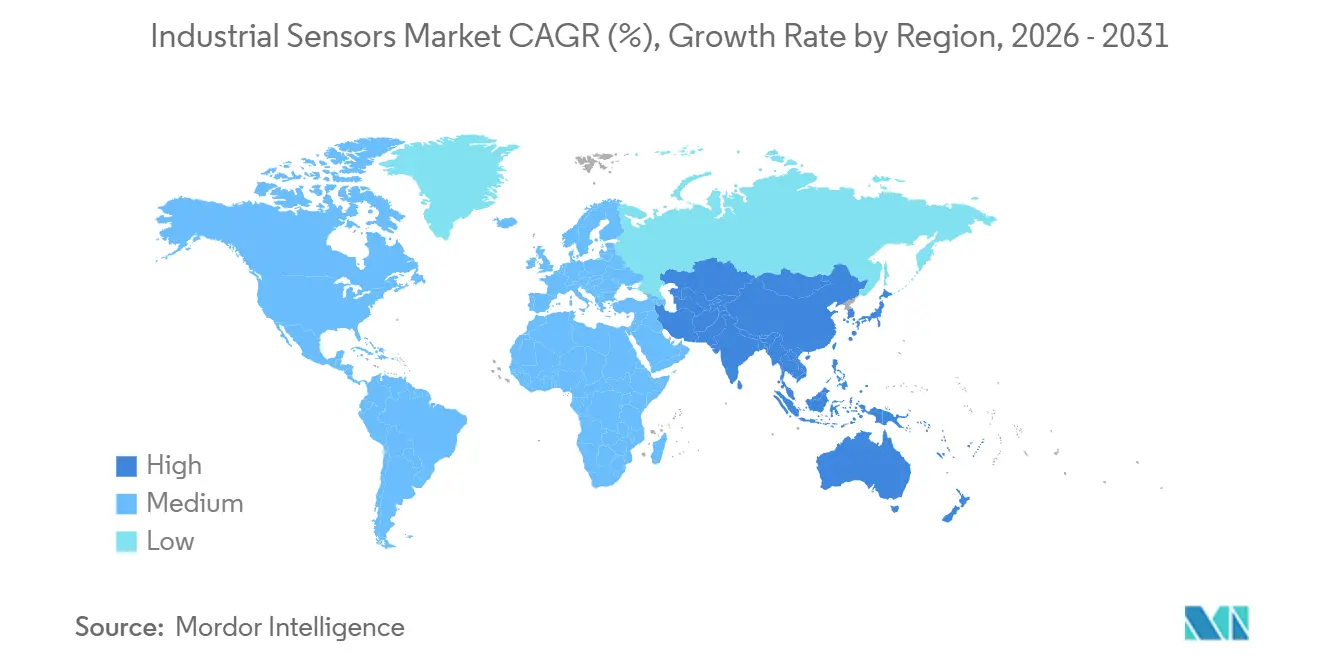
| Fastest Growing Market | Asia Pacific |
| Largest Market | North America |
| Market Concentration | Medium |
Major Players *Disclaimer: Major Players sorted in no particular order Image © Mordor Intelligence. Reuse requires attribution under CC BY 4.0. | |
Industrial Sensors Market Analysis by Mordor Intelligence
The Industrial Sensors Market size is projected to be USD 27.39 billion in 2025, USD 30.01 billion in 2026, and reach USD 47.35 billion by 2031, growing at a CAGR of 9.55% from 2026 to 2031.
Growing demand for autonomous, real-time decision making at the production line, rapid robotization, and stringent sustainability rules are reinforcing the business case for dense sensing networks. Manufacturers are shifting budgets from cloud backhaul to edge-AI sensor nodes that cut latency below 10 milliseconds, lower cloud-egress fees, and maintain data sovereignty. Market leaders bundle sensors with proprietary control software to lock customers into long lifecycle contracts, yet IO-Link and OPC UA are eroding these moats by making vendor-agnostic retrofits economically feasible. Cybersecurity has started to shape capital-spending priorities, as insurance exclusions on operational-technology breaches obligate factories to segment networks and harden gateways before expanding sensor fleets.[1]United States Cybersecurity and Infrastructure Security Agency, “ICS Advisories 2023-2024,” CISA.GOV
Key Report Takeaways
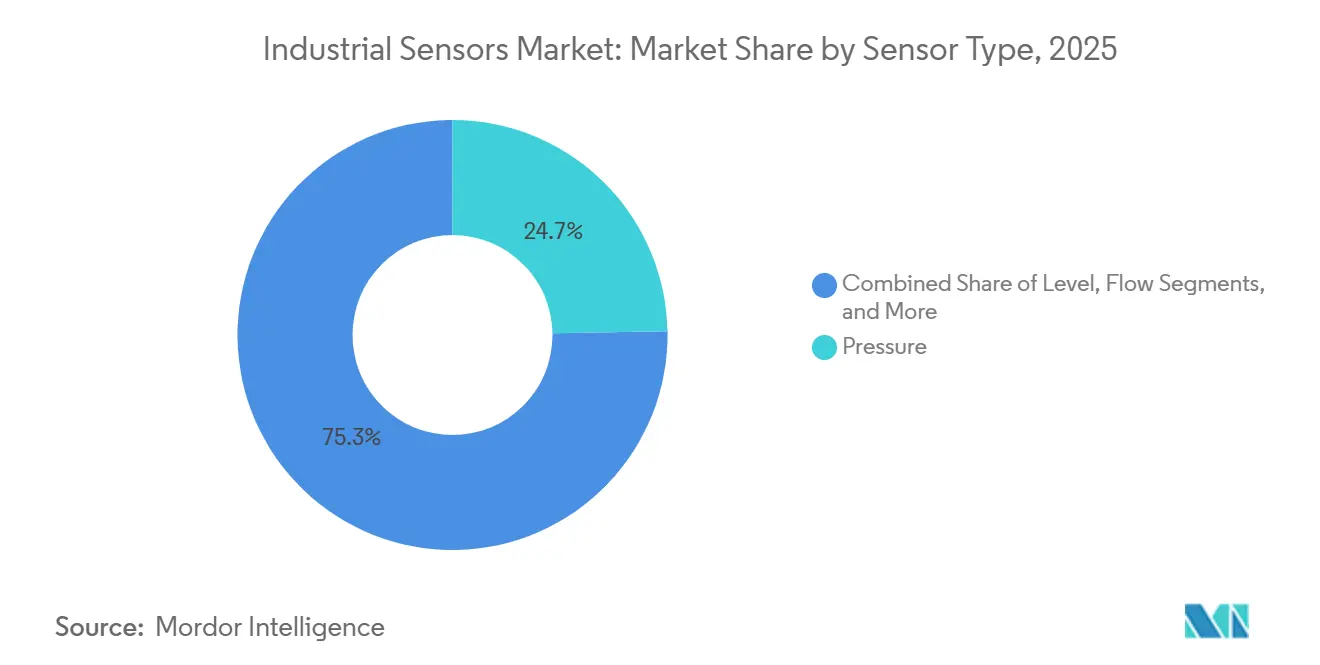
- By sensor type, pressure sensors led with a 24.73% industrial sensors market share in 2025. Image and vision sensors are forecast to expand at a 10.34% CAGR through 2031, the fastest among all categories.
- By end-user industry, power and energy held 23.72% industrial sensors market share in 2025, while the life sciences and pharmaceuticals segment is projected to grow at a 10.11% CAGR to 2031.
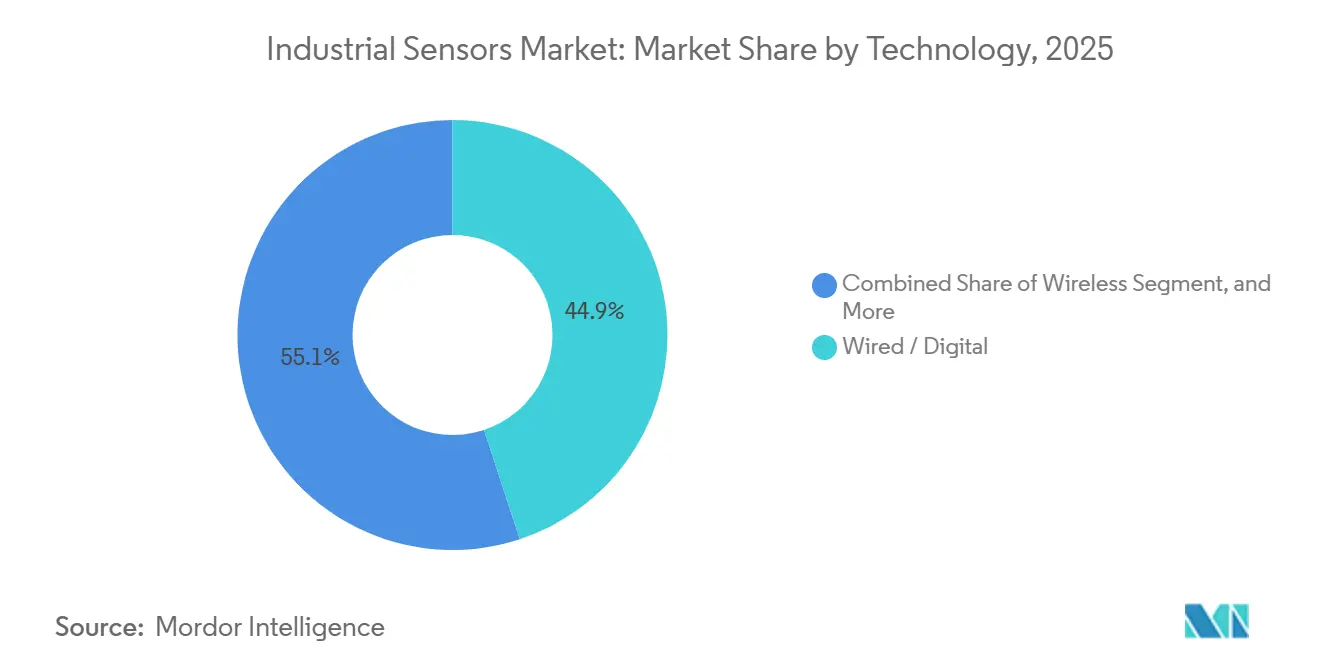
- By technology, wired digital smart sensors commanded 44.92% of the industrial sensors market size in 2025, whereas edge-AI and virtual-sensor architectures are set to rise at an 11.78% CAGR between 2026 and 2031.
- By communication protocol, industrial Ethernet accounted for 47.83% of 2025 revenue of the industrial sensors market; IO-Link is the fastest-growing protocol at an 11.66% CAGR to 2031.
- By geography, North America captured 38.73% of 2025 revenue of the industrial sensors market; Asia-Pacific is advancing at an 11.74% CAGR through 2031.
Note: Market size and forecast figures in this report are generated using Mordor Intelligence’s proprietary estimation framework, updated with the latest available data and insights as of January 2026.
Global Industrial Sensors Market Trends and Insights
Drivers Impact Analysis*
| Driver | (~) % Impact on CAGR Forecast | Geographic Relevance | Impact Timeline |
|---|---|---|---|
| Industry 4.0 and IIoT adoption surge | +2.1% | Global, with concentration in Germany, United States, China, Japan, South Korea | Medium term (2-4 years) |
| Predictive-maintenance and remote-monitoring demand | +1.8% | North America and Europe lead, Asia-Pacific accelerating | Short term (≤ 2 years) |
| Robot-centric smart-factory expansion | +1.5% | Asia-Pacific core (China, Japan, South Korea), spill-over to North America | Medium term (2-4 years) |
| Rising compliance with net-zero and energy-efficiency mandates | +1.3% | Europe (EU Energy Efficiency Directive), North America (EPA regulations), expanding to Asia-Pacific | Long term (≥ 4 years) |
| Edge-AI sensor nodes cut cloud latency | +1.1% | Global, early adoption in automotive and electronics manufacturing | Medium term (2-4 years) |
| IO-Link retrofit wave in brownfield plants | +0.9% | Europe and North America brownfield sites, emerging in Asia-Pacific | Short term (≤ 2 years) |
| Source: Mordor Intelligence | |||


Industry 4.0 And IIoT Adoption Surge
Private-5G networks, OPC UA interoperability, and the IEC 63278-1 digital-twin standard are dissolving legacy data islands, letting factories stream sensor telemetry into unified analytics stacks.[2]International Electrotechnical Commission, “IEC 63278-1,” IEC.CH Siemens recorded an 18% uptick in Xcelerator subscriptions during 2024 as firms phased out standalone SCADA deployments in favor of cloud-native platforms that scale across multi-plant footprints.[3]Siemens AG, “Annual Report 2024,” SIEMENS.COM The shift from deterministic control loops to probabilistic inference allows early fault prediction, typically 7-14 days ahead, slashing emergency downtime. Still, small and medium manufacturers in ASEAN report capability gaps, with only 22% having in-house IIoT skills, which is driving turnkey “sensor-in-a-box” offerings.
Predictive-Maintenance And Remote-Monitoring Demand
Unplanned downtime costs G7 factories roughly USD 50 billion each year, prompting aggressive deployment of vibration, temperature, and acoustic sensors able to flag anomalies minutes after they appear. In pharmaceuticals, 68% of plants integrated predictive-maintenance sensors in 2024, up from 41% in 2022, delivering median productivity gains of 32%. Platforms such as Honeywell Forge grew connected assets by 23% in 2024 as remote technicians used augmented-reality headsets and live dashboards to troubleshoot equipment without traveling. Dragos, however, notes that 34% of 2024 ransomware incidents exploited vulnerable remote-access gateways, keeping cybersecurity front-of-mind.
Robot-Centric Smart-Factory Expansion
Collaborative and mobile robots depend on proximity, vision, and force-torque sensors to work safely alongside humans in accordance with ISO/TS 15066. Global installations reached 553,000 units in 2023, each cell embedding 12-18 sensors. Keyence posted JPY 1.02 trillion (USD 6.8 billion) in 2024 sales on the back of sub-micron vision systems that guide battery assembly lines, capturing a 55.8% operating margin. As edge-AI chips migrate onto vision sensors, robots dynamically adapt to part variations, cutting changeover time from hours to minutes, a critical advantage in electronics where product cycles last 18 months.
Rising Compliance With Net-Zero and Energy-Efficiency Mandates
The EU Energy Efficiency Directive 2023/1791 requires an 11.7% cut in final energy use by 2030, pushing factories to deploy sub-metering sensors on every major load. ISO 50001 certifications topped 20,000 in 2024, with compliant sites averaging 140 energy sensors that feed real-time analytics. Participants in the United States EPA Better Buildings Initiative trimmed energy intensity 18% over five years by pairing sensor data with machine-learning algorithms. With carbon prices at EUR 80 per tonne (USD 90), granular energy data has become essential for preserving margins.
Restraints Impact Analysis*
| Restraint | (~) % Impact on CAGR Forecast | Geographic Relevance | Impact Timeline |
|---|---|---|---|
| High CAPEX and integration complexity | -0.8% | Global, particularly acute for SMEs in Asia-Pacific and South America | Short term (≤ 2 years) |
| Cybersecurity vulnerabilities of networked sensors | -0.6% | North America and Europe (high regulatory scrutiny), expanding to Asia-Pacific | Medium term (2-4 years) |
| Global semiconductor-supply disruption risk | -0.5% | Global, with acute impact on automotive and electronics manufacturing | Short term (≤ 2 years) |
| Data-sovereignty rules limit cross-border analytics | -0.4% | Europe (GDPR), China (Cybersecurity Law), India (draft Data Protection Act) | Long term (≥ 4 years) |
| Source: Mordor Intelligence | |||
High CAPEX And Integration Complexity
Total project costs extend well beyond sensor hardware to gateways, field infrastructure, middleware licenses, and system-integration labor. Even with Rockwell’s auto-generated control code, a typical greenfield smart factory still demands 18-24 months and up to USD 1.3 billion, discouraging small and medium enterprises. Protocol heterogeneity inflates engineering hours, prompting higher uptake of vendor platforms such as Schneider’s EcoStruxure that abstract multiple networks behind a single API.
Cybersecurity Vulnerabilities of Networked Sensors
CISA catalogued 885 vulnerabilities across 74 industrial control vendors in 2H 2023, with credential attacks accounting for 42% of incidents. Malware targeting ARM- and MIPS-based devices surged 78% in 2024, expanding the threat surface of smart factories. NIST SP 800-82 recommends segmentation, multi-factor authentication, and anomaly monitoring, yet only 38% of manufacturing CISOs implement all three controls, often hampered by fears of production shutdowns. Insurers have begun excluding OT cyber losses from standard policies, compelling boards to earmark 8-12% of automation CAPEX for security.
*Our forecasts treat driver/restraint impacts as directional, not additive. The impact forecasts reflect baseline growth, mix effects, and variable interactions.
Segment Analysis
By Sensor Type: Vision-Led Automation Outpaces Legacy Categories
Image and vision sensors are advancing at a 10.34% CAGR through 2031. The industrial sensors market size for this category was bolstered in 2025 by quality-inspection lines replacing human operators with convolutional networks that sustain line speeds above 1,000 parts per minute. Sony’s 24.5-megapixel global-shutter CMOS chips, launched in 2024, give inspection systems the resolution needed to catch microscopic defects. Cognex reported that 37% of surveyed manufacturers intend to expand vision deployments within two years, citing accelerating zero-defect mandates.
Pressure sensors retained a 24.73% industrial sensors market share in 2025 thanks to their entrenched role in process-control loops across chemicals and petrochemicals. However, revenue growth is slowing as saturation in mature plants caps fresh installations. Flow meters built on Coriolis and ultrasonic principles are penetrating custody-transfer metering, edging out turbine designs. Proximity and area sensors ride the robotization wave, serving as safety interlocks and workpiece detectors, while specialized vibration and gas-leak sensors command premium price points in niche risk-mitigation roles.


By End-User Industry: Pharma Achieves Highest Growth Velocity
The life sciences and pharmaceuticals segment is projected to record a 10.11% CAGR through 2031, the top growth trajectory among verticals. Process-analytical-technology sensors are essential for continuous manufacturing lines endorsed by the FDA’s Emerging Technology Program. ISPE survey data show that predictive-maintenance adoption jumped to 68% in 2024, reflecting zero-tolerance for unplanned outages.
Power and energy, while slower growing, still represented 23.72% of 2025 revenue as grid-modernization efforts embed phasor measurement units synchronized via GPS under IEEE C37.118 to stabilize renewable intermittency. Chemical plants, metals operations, and food manufacturers remain sensor-dense due to safety, traceability, and yield-control requirements, whereas aerospace, water treatment, and mining continue to procure ruggedized transducers that survive extreme environments.
By Technology: Edge-AI And Virtual Sensors Shift Cost Curves
Wired digital smart devices held 44.92% of 2025 revenue, reflecting the enormous installed base of HART, PROFIBUS PA, and Foundation Fieldbus loops. The industrial sensors market size for edge-AI and virtual-sensor deployments is expanding at an 11.78% CAGR, driven by physics-based digital twins that infer unmeasured variables and by lower hardware spend of 30-40%.
Wireless sensors, WirelessHART, ISA100.11a, Wi-SUN, and BLE Mesh, unlock monitoring for rotating or mobile assets but face latency and battery constraints. Hybrid architectures are therefore common, with gateways translating analog, digital, and wireless inputs into unified time-series repositories where local AI models run before concise datasets flow to historians.
By Communication Protocol: Ethernet Dominant, IO-Link Climbing
Industrial Ethernet secured 47.83% of protocol revenue in 2025, led by PROFINET’s 65 million installed nodes and EtherNet/IP’s 35 million. EtherCAT Technology Group membership exceeded 7,500 companies in 2024, with the protocol favored in motion-control applications requiring sub-microsecond synchronization, such as semiconductor wafer handling and packaging machinery. The convergence of OPC UA and Time-Sensitive Networking, standardized in IEC 62541 and IEEE 802.1, is enabling deterministic communication over standard Ethernet infrastructure, reducing the need for proprietary fieldbus hardware and accelerating protocol consolidation.
IO-Link, growing at an 11.66% CAGR, simplifies brownfield retrofits by reusing existing three-wire cables, auto-detecting devices via IODD files, and trimming commissioning labor 40-60%. Fieldbus protocols continue to decline in new projects but still drive replacement sales for legacy plants. Wireless adoption remains sub-10% but is indispensable for remote wells, pipelines, and mobile robots that cannot tolerate cabling.
Geography Analysis
North America controlled 38.73% of 2025 revenue, lifted by decades of PROFINET and EtherNet/IP deployments in automotive and aerospace. The CHIPS and Science Act is catalyzing domestic analog-sensor fabrication in Arizona and Texas, which shortens lead times and mitigates geopolitical risk. Utilities such as Duke Energy earmarked USD 8 billion in 2024 for PMUs and smart meters, reflecting grid-stability mandates. Canada’s CAD 80 per-tonne (USD 60) carbon price drives energy-metering retrofits, while Mexico’s nearshoring boom in EVs and electronics creates fresh demand under USMCA provisions.
Asia-Pacific is the fastest-growing region at an 11.74% CAGR. China’s Made in China 2025 plan aims for 70% digitalization of large enterprises, fueling steep sensor uptake. India channeled USD 26 billion of Production-Linked Incentives into electronics and pharma manufacturing, lifting demand for process and vision sensors. Japan’s strength in robotics, despite lagging data-sharing, sustains high-accuracy encoder orders, and South Korea’s semiconductor fabs procure environmental sensors that maintain class 1 cleanrooms. ASEAN economies absorb turnkey sensor kits as labor costs rise and local skill shortages persist.
Europe follows closely, propelled by Germany’s Industrie 4.0 investments and the EU’s Energy Efficiency Directive, which predicates funding on metered energy baselines. Vendors such as Siemens, ABB, and Schneider leverage integrated portfolios to cross-sell sensors and control software, while niche players Sick AG and Pepperl+Fuchs dominate safety-critical and explosion-proof niches. Regulatory divergence post-Brexit raises compliance costs for U.K. exporters shipping into the EU. South America and the Middle East and Africa trail in adoption, though Brazil’s mining and the Gulf’s upstream oil and gas projects increasingly specify wireless vibration sensors to monitor remote assets where rewiring is impractical.

Competitive Landscape
The market is moderately fragmented as the top five suppliers, Siemens, Honeywell, ABB, Rockwell Automation, and Schneider Electric, hold roughly the majority of the combined share. These firms fortify moats by bundling sensors with proprietary controllers and lifecycle software, raising customer switching costs. Open-protocol adoption, however, empowers buyers to select best-in-class transducers without wholesale PLC replacement. Keyence’s direct-sales model launched 200 new SKUs in 2024, securing a 55.8% operating margin and underscoring the premium customers are willing to pay for out-of-the-box vision solutions.
Emerging disruptors include semiconductor companies such as Texas Instruments, STMicroelectronics, and Infineon Technologies, which integrate sensing elements, signal conditioning, and digital communication on single chips, compressing sensor size and cost while enabling edge-AI inference. Texas Instruments' Sitara AM6x processors, which combine real-time control and AI inference, shipped in volume to industrial customers in 2024 for motor-current signature analysis and vision-based defect classification. Analog Devices' Voyager4 platform, which embeds MEMS accelerometers and a Cortex-M33 core in a coin-cell-powered package, enables predictive-maintenance deployments in locations where wired power is unavailable.
Strategic moves center on vertical integration, as Rockwell Automation's USD 206 million acquisition of Verve Industrial in 2024 added OT cybersecurity capabilities that complement its sensor and control portfolio, while Schneider Electric's integration of AVEVA's industrial software creates a unified platform spanning sensors, edge gateways, and cloud analytics. Patent filings reveal intensifying competition in edge-AI sensor architectures, with Siemens, Bosch, and Honeywell collectively holding over 3,000 patents related to neural-network inference on resource-constrained devices, a capability that will determine which vendors capture margin as sensors evolve from passive transducers to autonomous decision nodes.
Industrial Sensors Industry Leaders
Siemens AG
Honeywell International Inc.
Rockwell Automation Inc.
Bosch Sensortec GmbH
Texas Instruments Incorporated
- *Disclaimer: Major Players sorted in no particular order


Recent Industry Developments
- January 2026: ABB announced a USD 1.4 billion investment to expand its Ability 3 sensor-analytics platform into predictive-quality modules for discrete manufacturing.
- October 2025: Siemens committed USD 2.2 billion to a Singapore automation hub that will build IO-Link sensors and edge-AI gateways for Asia-Pacific markets.
- September 2025: Honeywell completed its USD 300 million purchase of Rebellion Defense, integrating AI-based sensor fusion into Honeywell Forge.
- August 2025: ABB released Ability 3, a cloud-native engine that unifies data from PROFIBUS, Modbus, and EtherNet/IP devices and predicts failures 10-14 days ahead.


Research Methodology Framework and Report Scope
Market Definitions and Key Coverage
Our study defines the industrial sensors market as all newly sold, stand-alone or modular devices deployed in factory and process settings to measure or control parameters such as pressure, temperature, level, flow, position, proximity, and vision. According to Mordor Intelligence, values capture hardware plus embedded firmware revenues booked through OEM, distributor, or direct channels, reported in USD at average 2024 exchange rates.
Scope exclusion: Sensors embedded solely in consumer electronics, passenger vehicles, or residential smart-home devices are not covered.
Segmentation Overview
- By Sensor Type
- Flow
- Pressure
- Proximity / Area
- Level
- Temperature
- Image / Vision
- Photo-electric
- Other Sensor Types
- By End-user Industry
- Chemical and Petrochemicals
- Mining and Metals
- Power and Energy
- Food and Beverage
- Life Sciences and Pharmaceuticals
- Aerospace and Defense
- Water and Waste-water
- Other End-user Industries
- By Technology
- Wired / Analog
- Wired / Digital (Smart)
- Wireless
- Edge-AI / Virtual Sensors
- By Communication Protocol
- Fieldbus (PROFIBUS, Modbus)
- Industrial Ethernet (PROFINET, EtherNet/IP, EtherCAT)
- IO-Link
- Wireless ICPs (Wi-Sun, 6LoWPAN, BLE-Mesh)
- By Geography
- North America
- United States
- Canada
- Mexico
- South America
- Brazil
- Argentina
- Rest of South America
- Europe
- Germany
- United Kingdom
- France
- Italy
- Spain
- Rest of Europe
- Asia-Pacific
- China
- Japan
- India
- South Korea
- ASEAN
- Rest of Asia-Pacific
- Middle East and Africa
- Middle East
- Saudi Arabia
- United Arab Emirates
- Rest of Middle East
- Africa
- South Africa
- Nigeria
- Rest of Africa
- Middle East
- North America
Detailed Research Methodology and Data Validation
Primary Research
Interviews with automation OEM product managers, plant maintenance engineers, and high-volume distributors across Asia-Pacific, North America, and Europe helped us test secondary findings, refine average selling prices, and confirm early moves toward wireless IO-Link and edge-AI virtual sensors.
Desk Research
We started with open sources that map the installed asset base, including UNIDO's industrial statistics, World Bank manufacturing value-added data, Eurostat Prodcom, and U.S. Census import codes. Standards from IEC 60947 and ISO 2852 clarified certification pathways that influence demand timing.
Company 10-Ks, investor decks, and procurement notices were mined with D&B Hoovers and Dow Jones Factiva to isolate sensor revenue splits, while trade bodies such as the German VDMA and the International Society of Automation provided retrofit rates and protocol adoption clues. The sources cited are illustrative; many additional publications supported data gathering and validation.
Market-Sizing & Forecasting
Our model begins with a top-down rebuild of global industrial-automation capex, then applies industry-specific sensor penetration ratios before adjusting for average device ASP trends. Supplier roll-ups and sampled shipment checks supply a bottom-up reasonableness test. Key variables like manufacturing PMI, robot density, IIoT spending, ASP erosion, energy price index, and safety-citation frequency feed a multivariate regression blended with scenario analysis; coefficient ranges were vetted in primary calls and tuned where data gaps arose.
Data Validation & Update Cycle
Mordor analysts run variance screens against historical trade data and external benchmarks; any anomaly triggers a rerun. Reports refresh annually, with interim updates for material events, and a final audit ensures clients receive our latest vetted view.
Why Mordor's Industrial Sensors Baseline Earns Client Trust
Published estimates often diverge because firms pick different sensor sets, pricing ladders, and refresh cadences.
Many studies merge adjacent smart-sensor segments or roll forward older trade tables, whereas Mordor keeps definitions tight, tracks quarterly ASP moves, and locks currency conversions to IMF averages.
Benchmark comparison
| Market Size | Anonymized source | Primary gap driver |
|---|---|---|
| $27.5 B (2025) | Mordor Intelligence | |
| $30.49 B (2025) | Global Consultancy A | Bundles automotive and smart-home sensors; static ASP assumption |
| $25.68 B (2025) | Industry Publisher B | Excludes image and virtual sensors; relies on 2023 shipment survey only |
The comparison shows that when scope creep, dated inputs, or one-dimensional assumptions slip in, totals swing widely. By anchoring estimates to clearly defined variables and repeatable steps, Mordor Intelligence delivers a balanced, transparent baseline decision-makers can trust.


Key Questions Answered in the Report
What is the industrial sensors market growth outlook to 2031?
The industrial sensors market is forecast to expand from USD 30.01 billion in 2026 to USD 47.35 billion by 2031, reflecting a 9.55% CAGR driven by edge-AI deployments and stricter energy-efficiency rules.
Which sensor category is growing the fastest?
Image and vision sensors post the highest expected CAGR at 10.34% as factories automate defect detection and robot guidance.
Which end-user sector will see the strongest sensor demand?
The Life sciences and pharmaceuticals leads with a projected 10.11% CAGR, fueled by continuous manufacturing and predictive-maintenance mandates.
Why are manufacturers adopting IO-Link?
IO-Link allows point-to-point digital communication on existing three-wire cables, cutting brownfield retrofit costs by up to 60% and reducing commissioning time.
How is cybersecurity influencing sensor investment?
Insurers are excluding OT cyber losses from standard coverage, prompting factories to budget 8-12% of automation CAPEX for segmentation and anomaly detection before scaling sensor fleets.
Page last updated on:


