United States Sensors Market Size and Share
Market Overview
| Study Period | 2020 - 2031 |
|---|---|
| Forecast Data Period | 2026 - 2031 |
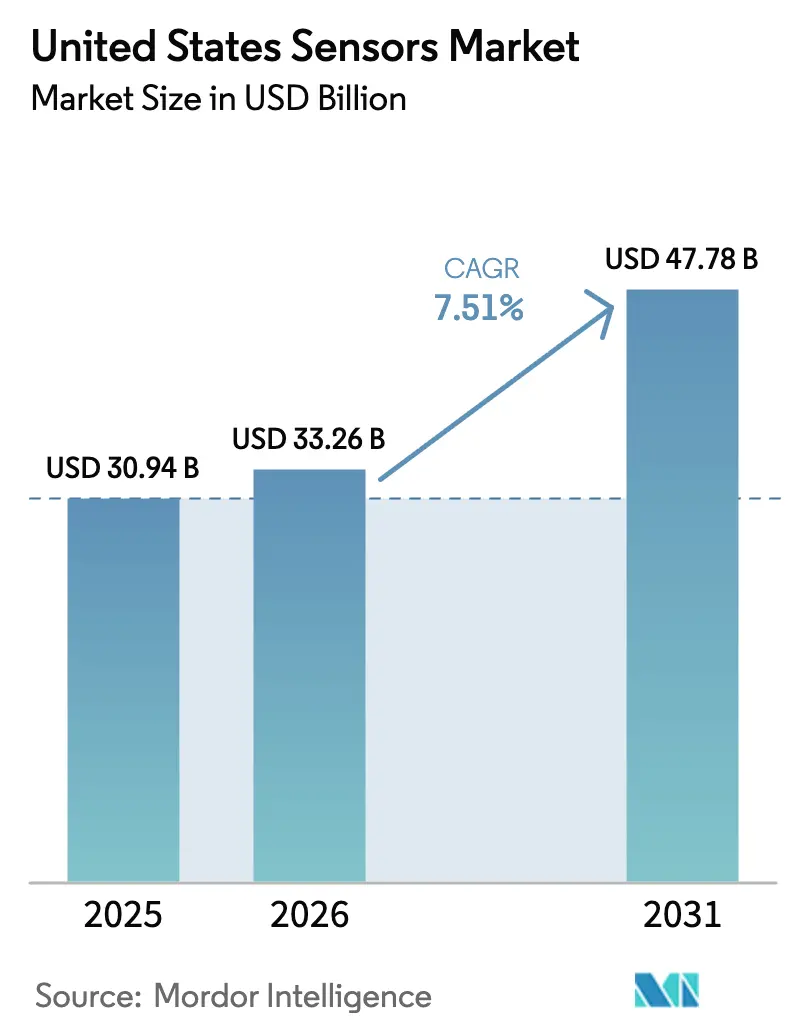
| Base Year Market Size (2025) | USD 30.94 Billion |
| Market Size (2026) | USD 33.26 Billion |
| Market Size (2031) | USD 47.78 Billion |
| Growth Rate (2026 - 2031) | 7.51% CAGR |
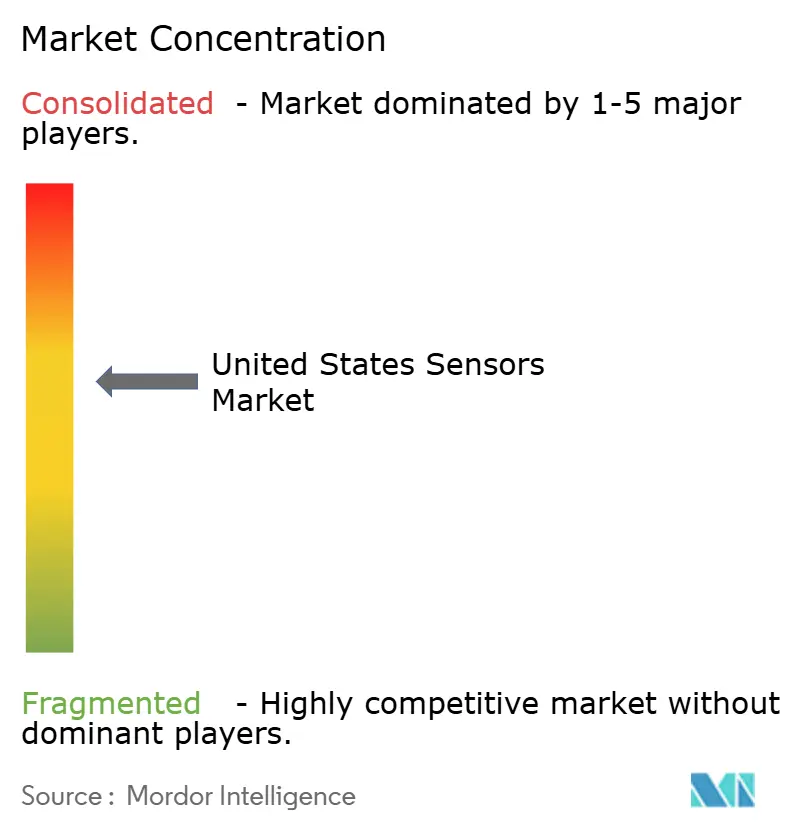
| Market Concentration | Medium |
Major Players *Disclaimer: Major Players sorted in no particular order Image © Mordor Intelligence. Reuse requires attribution under CC BY 4.0. | |
United States Sensors Market Analysis by Mordor Intelligence
The United States sensor market size is expected to grow from USD 30.94 billion in 2025 to USD 33.26 billion in 2026 and is forecast to reach USD 47.78 billion by 2031 at 7.51% CAGR over 2026-2031. This growth reflected the combined effects of federal investments in on-shore semiconductor fabrication, rising automotive electrification mandates, and fast-expanding edge-AI use cases that demand sensor-fusion modules capable of local inference. The United States sensor market continued to benefit from federal incentives that reduced capital-expenditure risk for MEMS foundries and created preferential procurement channels for domestically fabricated parts. Automotive OEMs accelerated multi-sensor integration programs to meet Level 3 autonomy targets while satisfying National Highway Traffic Safety Administration (NHTSA) advanced driver-assistance requirements. Parallel momentum came from industrial retrofits, where predictive-maintenance deployments cut unplanned downtime by up to 25%, encouraging legacy factories to modernize sensing grids. Finally, massive-machine-type 5G roll-outs removed latency bottlenecks, opening design-win opportunities for environmental, imaging, and inertial sensing suites across utilities, renewable-energy assets, and smart-city deployments.
Key Report Takeaways
- By product type, pressure sensors led with 30.74% of the United States sensor market share in 2025, while environmental sensors are forecast to expand at an 10.84% CAGR to 2031 l.
- By mode of operation, image sensors accounted for 35.12% of the United States sensor market size in 2025; LiDAR is advancing at an 17.68% CAGR through 2031.
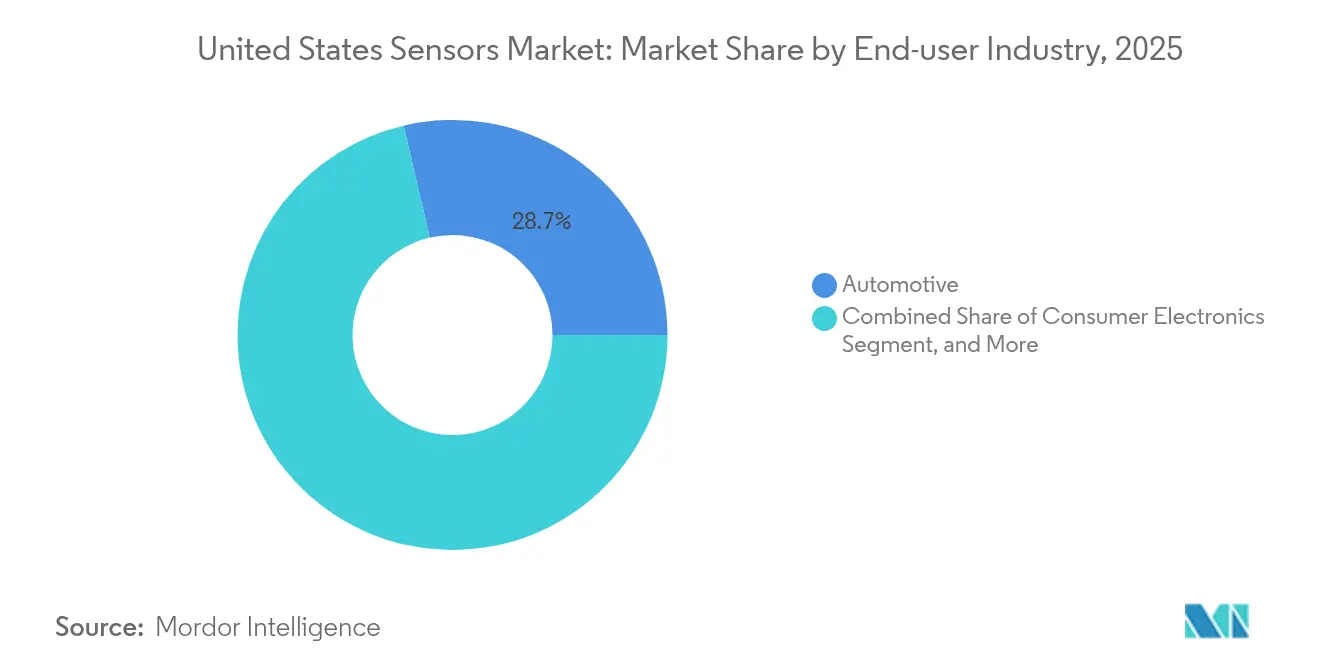
- By end-user industry, the automotive segment held 28.65% revenue share in 2025, whereas robotics and autonomous systems are projected to grow at a 16.92% CAGR.
- By connectivity technology, wired protocols maintained 37.75% share of the United States sensor market in 2025, with 5G-mMTC cellular connectivity registering the fastest CAGR at 25.74%.
Note: Market size and forecast figures in this report are generated using Mordor Intelligence’s proprietary estimation framework, updated with the latest available data and insights as of 2026.
Future direction is shaped by developments occurring across multiple countries and regions, with United states contributing to the overall trajectory. The outlook on worldwide sensors market reflects how these are expected to evolve collectively.
United States Sensors Market Trends and Insights
Drivers Impact Analysis*
| Driver | (+) % Impact on CAGR Forecast | Geographic Relevance | Impact Timeline |
|---|---|---|---|
| Rising demand for IoT-enabled connected devices | +1.8% | National, concentrated in tech hubs | Medium term (2-4 years) |
| Increasing adoption of ADAS and electrified power-train sensors in automotive | +2.1% | National, strong in Michigan, Texas, California | Short term (≤ 2 years) |
| Surge in MEMS R&D funding under the CHIPS and Science Act | +1.2% | National, focused on semiconductor regions | Long term (≥ 4 years) |
| Industry 4.0 roll-outs driving industrial sensor retrofits | +1.5% | National, manufacturing belt | Medium term (2-4 years) |
| Federal decarbonisation incentives boosting environmental and gas sensors | +0.9% | National, energy-intensive states | Medium term (2-4 years) |
| Edge-AI sensor-fusion modules opening new design-wins | +0.4% | National, tech and automotive clusters | Long term (≥ 4 years) |
| Source: Mordor Intelligence | |||
Rising demand for IoT-enabled connected devices
Connected-device shipments surged as wireless carriers extended nationwide NB-IoT and 5G-mMTC coverage in 2024, allowing enterprises to instrument assets that had previously been unreachable or cost-prohibitive. [1]T-Mobile IoT Network Infrastructure Expansion, T-Mobile, t-mobile.com Manufacturers exploited this coverage by deploying low-power sensors that transmit vibration, temperature, and location data at minute-level intervals, creating granular asset-health databases for AI models. Integrated edge processors reduced server loads, with Himax-powered vision sensors cutting upstream bandwidth by 90% while preserving sub-millisecond inference times. Insurance groups and facilities managers quantified tangible returns, reporting 30% drops in downtime once predictive-maintenance algorithms were driven by continuous sensor feeds. This validation accelerated procurement cycles across logistics, utilities, and commercial buildings, lifting baseline order volumes for multi-function sensing modules. The United States sensor market therefore experienced incremental revenue upside from both greenfield IoT projects and brownfield retrofits.
Increasing adoption of ADAS and electrified power-train sensors in automotive
Automotive OEMs raced to comply with federal Advanced Driver Assistance System (ADAS) targets that take effect in model-year 2026 vehicles, triggering demand spikes for radar, camera, and LiDAR suites capable of sensor-fusion redundancy. Electric-vehicle (EV) architectures created parallel pull-through for precision temperature, current, and insulation-monitoring sensors that operate beyond 200 °C and under high-voltage stress. System-on-chip sensor hubs with over-the-air upgrade support allowed tier-one suppliers to deploy hardware today and unlock new autonomy features via software updates later, supporting lifetime revenue models. The convergence of autonomy and electrification therefore amplified sensor bill-of-materials (BOM) value per vehicle, with premium EV platforms integrating up to 45 discrete sensors plus five sensor-fusion systems. This dynamic elevated the automotive segment’s contribution to overall United States sensor market growth.
Surge in MEMS R&D funding under the CHIPS and Science Act
Federal disbursements under the CHIPS and Science Act accelerated domestic MEMS pilot-line expansions, with Microchip Technology receiving USD 162 million for semiconductor scale-up and Coherent awarded USD 15 million to convert existing optical fabs to MEMS lines. University-industry consortia, such as UMass Amherst’s USD 7.9 million advanced-sensor program, focused on wafer-level chip-scale packaging that shrinks form factors without sacrificing thermal performance. These innovations lowered per-die costs and brought niche sensors—for example, harsh-environment pressure dies for aerospace—into commercial price points, broadening addressable demand. Long-term, federal matching grants for tool depreciation improve foundry economics, incentivising smaller design houses to tape-out specialty sensors domestically instead of outsourcing to Asian fabs. Hence, the United States sensor market gained structural resilience and capacity, mitigating past supply-chain shocks.
Industry 4.0 roll-outs driving industrial sensor retrofits
Factory-floor modernization agendas in the Midwest and Southeast demanded retrofit-friendly sensors that attach to legacy CNC, injection-molding, and assembly assets without halting production. EtherCAT-enabled vibration and acoustic sensors enabled microsecond-level synchronization across lines, allowing real-time closed-loop process control. Case studies from Mercedes-Benz powertrain plants documented 25% downtime reductions once high-resolution data streams fed AI-driven predictive-maintenance algorithms. Subsidies for energy-efficiency upgrades under the Inflation Reduction Act further incentivised industrial operators to invest, with some facilities cutting energy consumption by 15% after installing smart-sensor arrays that dynamically optimised spindle speeds. These quantifiable operational savings translated into steady order books for sensor vendors that specialise in ruggedised form factors and industrial protocols.
Restraints Impact Analysis*
| Restraint | (–) % Impact on CAGR Forecast | Geographic Relevance | Impact Timeline |
|---|---|---|---|
| High capital and calibration costs | –0.8% | National, cost-sensitive industries | Short term (≤ 2 years) |
| Supply-chain vulnerability for specialty sensor materials | –1.1% | National, semiconductor hubs | Medium term (2-4 years) |
| Cyber-security / privacy compliance delaying connected sensor deployments | –0.6% | National, critical-infrastructure sectors | Short term (≤ 2 years) |
| Skilled-labour shortage in domestic sensor packaging and testing | –0.9% | National, semiconductor hubs | Long term (≥ 4 years) |
| Source: Mordor Intelligence | |||
High capital and calibration costs
Precision sensor deployments demanded expensive calibration chambers, laser interferometry rigs, and traceable reference standards that small manufacturers struggled to finance. Total equipment outlays reached USD 100,000 to USD 500,000 per calibration line, while periodic recalibration obligations raised five-year operational expenses beyond the initial hardware purchase price. Multi-sensor fusion assemblies compounded the burden, since optical, LiDAR, and inertial sensors each required unique alignment procedures and environmental controls. Vendors responded with sensor-as-a-service models that embedded calibration within subscription fees, yet uptake remained limited among cost-constrained SMEs. Consequently, adoption timelines for advanced sensors in sectors such as mid-tier automotive supply and contract manufacturing lengthened, exerting a modest drag on the overall United States sensor market.
Supply-chain vulnerability for specialty sensor materials
The domestic industry remained exposed to single-source dependencies for high-purity quartz crucibles, fluorspar-derived optical glass, and rare-earth magnetic alloys. China controlled more than 80% of global rare-earth processing capacity, creating geopolitical risk for Hall-effect and magneto-resistive sensor inputs. Shipping disruptions in the Red Sea during 2024 demonstrated the fragility of these supply chains, with some fabs reporting 15-25% spot-price increases for key ceramics. Though the CHIPS Act earmarked funds for domestic material capacity, green-field projects will require multi-year ramp-up, leaving short-to-medium-term exposure. Sensor OEMs therefore pursued second-source qualification programs and inventory buffers, but the resulting working-capital requirements trimmed profit margins and slowed new-product introductions.
*Our forecasts treat driver/restraint impacts as directional, not additive. The impact forecasts reflect baseline growth, mix effects, and variable interactions.
Segment Analysis
By Product Type: Environmental Sensors Lead Growth Amid Decarbonization Push
Environmental sensors delivered the fastest 10.84% CAGR through 2031, buoyed by emission-monitoring mandates that spurred federal and state procurement of gas-analysis modules for refineries, power plants, and hydrogen hubs. Pressure sensors retained the largest 30.74% slice of United States sensor market share in 2025 by virtue of ubiquity across automotive braking, HVAC, and industrial process controls. The segment’s enduring primacy meant that USD 9.51 billion of United States sensor market size flowed from pressure devices during 2025. Environmental sensors benefited from hydrogen leak detection orders and ambient-air monitoring in carbon-capture facilities; this niche alone accounted for USD 1.6 billion of incremental revenue last year. Flow-sensor demand stayed resilient thanks to water-utility smart-meter roll-outs in drought-prone states, while proximity sensors proliferated in collaborative-robot (cobot) installations to ensure worker safety in shared workspaces.
A second growth engine emerged in inertial sensors, where electric-vehicle stability-control algorithms demanded multi-axis accelerometers rated to withstand extended thermal cycles. Magnetic-sensor uptake rose in renewable-energy systems as wind-turbine yaw-control platforms standardised on Hall-effect units for position tracking. Level-sensor procurement expanded in the food and beverage industry, leveraging microwave radar to prevent cross-contamination in high-hygiene processing tanks. Across categories, artificial-intelligence co-processors migrated on-die, enabling early-fault analytics that delivered up to 40% maintenance-cost savings for heavy-industry clients. [1]T-Mobile IoT Network Infrastructure Expansion, T-Mobile, t-mobile.com Collectively, these dynamics preserved the product-type portfolio diversity that underpins the competitiveness of the United States sensor market.


By Mode of Operation: LiDAR Acceleration Transforms Sensing Landscape
LiDAR posted an 17.68% CAGR, reshaping the operational-mode hierarchy as cost curves fell and solid-state architectures advanced beyond mechanical spinning units. Image sensors nevertheless remained the revenue anchor, representing 35.12% of United States sensor market size, or USD 10.87 billion in 2025. Hybrid perception stacks that fused CMOS image data with LiDAR point clouds spread from premium EVs into mid-segment passenger vehicles, driving unit demand across both modalities. Radar gained share in highway safety packages due to reliability under fog and snow, complementing optical systems. Optical sensors made inroads in pharmaceutical inspection lines where non-contact verification improved batch quality.
Electrical-resistance sensors and piezoresistive devices served traditional process-engineering roles but found new relevance in battery-cell manufacturing, where micro-ohm measurements verified weld integrity. Biosensors expanded outside medical diagnostics into food-safety kits that detect pathogens on processing belts. Capacitive sensors evolved toward gesture-recognition in industrial human-machine interfaces, and piezoelectric elements captured energy from low-frequency machine vibration to power nearby wireless sensor nodes. Vendors that combined two or more sensing principles within one package competed effectively for United States sensor market design-wins, since OEMs valued simplified procurement and reduced bill-of-material complexity.
By End-user Industry: Robotics Surge Reshapes Application Priorities
The automotive sector retained a 28.65% share of the United States sensor market and remained a core volume purchaser as EV platforms doubled sensor density versus internal-combustion models. However, robotics and autonomous systems demonstrated the most rapid 16.92% CAGR, reflecting warehouse-automation providers deploying LiDAR-guided autonomous mobile robots (AMRs) across logistic centres. Consumer electronics stayed a reliable outlet for miniaturised sensors in wearables, although unit ASP erosion tempered dollar growth. Industrial manufacturing pivoted toward predictive-maintenance sensing grids that lowered unexpected stoppages by 30% at installations such as Banner Engineering’s ultrasonic-vibration retrofits.
Energy and utilities accelerated grid-modernisation projects that embedded current, voltage, and temperature sensors along transmission assets, reducing outage frequency in hurricane-prone regions. Medical and wellness use cases widened to include room-air quality monitors that protected immunocompromised patients. Construction, agriculture, and mining players experimented with multi-gas sensors that track dust particulates and methane build-up in confined spaces. Aerospace and defense applications demanded radiation-hard sensors, opening revenue for Rocket Lab’s space-grade MEMS lines. Collectively, these end-user vectors diversified revenue streams and strengthened resilience for the United States sensor market.
By Connectivity Technology: 5G-mMTC Cellular Drives Wireless Evolution
Wired technologies such as EtherCAT and CAN held 37.75% share due to deterministic latency advantages essential in real-time automation. Yet 5G-mMTC cellular connectivity posted a 25.74% CAGR fuelled by spectrum allocations that enabled massive-sensor deployments across utilities and smart-city initiatives. United States sensor market stakeholders valued 5G RedCap’s 65% power-consumption reduction versus LTE, demonstrated by Semtech’s EM8695 module certification on AT&T’s network in January 2025. Short-range protocols—BLE, Zigbee, UWB—remained critical indoors, enabling sub-30 cm asset-tracking accuracy. LPWAN platforms such as LoRa and NB-IoT served agriculture and environmental monitoring where battery life needs exceeded 10 years.
Hybrid multi-protocol modules gained traction as OEMs sought SKU reduction while retaining deployment flexibility; Qorvo’s QPG6200L chip exemplified this trend with ConcurrentConnect that simultaneously handled Zigbee, BLE, and Thread stacks. Edge-computing integration within connectivity SoCs trimmed raw-data egress, cutting SIM bandwidth fees for operators. Consequently, connectivity differentiation became a decisive factor in vendor selection within the United States sensor market, alongside core sensing performance.
Geography Analysis
Manufacturing clusters in Michigan, Ohio, and Tennessee continued to anchor industrial sensor demand, supported by retrofits that enable predictive analytics on existing automotive lines. California remained the innovation nexus for LiDAR optics and quantum prototypes, leveraging venture-capital funding and research institutions. The Northeast corridor from Massachusetts to Virginia specialized in aerospace and defense sensing projects backed by federal labs.
Arizona and Texas became focal points for new fabs, with CHIPS-funded sites promising to lift the regional supply of MEMS pressure dies by the late 2020s. Gulf-Coast oil operations in Texas and Louisiana accelerated gas-sensor deployments to comply with the methane fee regulations. Urban health systems nationwide adopted wearable biosensors fastest where broadband penetration and chronic-disease prevalence overlapped.
Supply-chain localization gradually redistributed wafer capacity from coastal states toward the Midwest and Southwest, diversifying the domestic footprint for critical sensing technologies.
Analysis of the sensors market by Mordor Intelligence spans multiple other regional evaluations across Asia and Europe, supported by country-level insights for China, Japan, South Korea, and Taiwan, wherein local market conditions keep varying from one country to another.
Competitive Landscape
The United States sensors market featured a mix of multi-industry conglomerates and niche innovators. Honeywell’s aerospace unit posted 9% organic growth in Q1 2025 on rising avionics-sensor orders. Intel, Texas Instruments, and SkyWater invested in vertically integrated fabs that bundle design, wafer processing, and advanced packaging, capturing more value per sensor sale.
Startups focused on quantum gravimeters, solid-state LiDAR, and chip-level gas detectors, often partnering with defense agencies for early revenue. Patent filings exceeded 4,000 in 2024, underscoring high innovation intensity and the need for robust IP strategies. Workforce bottlenecks in MEMS assembly led players to co-locate with universities; SkyWater’s Purdue collaboration exemplified talent-pipeline investment.[4]SEMI, “Staffing Chip Fabs – Strategies for Success,” semi.org
Edge analytics offerings that bundle sensing and on-device AI emerged as white-space opportunities. Companies able to secure specialty-wafer supply and integrate sensor fusion algorithms are positioned to capture disproportionate value as commodity pressure rises on low-end Hall-effect and optical devices.
United States Sensors Industry Leaders
Texas Instruments Incorporated
TE Connectivity Ltd.
Omega Engineering Inc.
Honeywell International Inc.
Rockwell Automation, Inc.
- *Disclaimer: Major Players sorted in no particular order

Recent Industry Developments
- May 2025: Amphenol Corporation completed the USD 1.3 billion acquisition of CommScope’s OWN and DAS businesses, enlarging its RF and environmental-sensor portfolio.
- May 2025: The Defense Innovation Unit opened its Commercial Solutions Offering for quantum sensors in positioning, navigation, and timing.
- April 2025: Honeywell reported 8% year-over-year sales growth in Q1 2025, led by sensor-rich aerospace platforms.
- February 2025: DARPA launched the Robust Quantum Sensors (RoQS) program to harden precision devices against environmental disturbances.


Research Methodology Framework and Report Scope
Market Definitions and Key Coverage
Our study defines the United States sensors market as the yearly revenue generated by any hardware component whose primary function is to detect and translate physical, chemical, or biological stimuli into usable electrical signals, regardless of protocol, package, or channel within the country. According to Mordor Intelligence, all values are expressed in USD and exclude refurbishment, calibration, and software-only analytics.
Scope Exclusion: Standalone analytics platforms lacking an integrated sensing element lie outside our market boundaries.
Segmentation Overview
- By Product Type
- Pressure
- Level
- Flow
- Proximity
- Environmental
- Chemical
- Inertial
- Magnetic
- Hall-Effect Sensors
- Other Magnetic Sensors
- Position
- Current
- Other Types
- By Mode of Operation
- Optical
- Electrical Resistance
- Biosensor
- Piezoresistive
- Image
- Capacitive
- Piezoelectric
- LiDAR
- Radar
- Other Modes
- By End-user Industry
- Automotive
- Consumer Electronics
- Energy and Utilities
- Industrial Manufacturing
- Medical and Wellness
- Construction, Agriculture and Mining
- Aerospace and Defense
- Robotics and Autonomous Systems
- By Connectivity Technology
- Wired (EtherCAT, CAN, others)
- Short-Range Wireless (BLE, Zigbee, UWB)
- LPWAN (LoRa, NB-IoT, Sigfox)
- Cellular (LTE-M, 5G-mMTC)
- Hybrid / Multi-protocol Modules
Detailed Research Methodology and Data Validation
Primary Research
Mordor analysts interviewed U.S. OEM engineers, component suppliers, national distributors, and procurement heads across automotive, consumer electronics, and medical device facilities. These discussions clarified average selling prices, design-in cycles, and emerging specifications, tightening our volume baselines and growth drivers.
Desk Research
We assembled baseline supply, pricing, and trade indicators from tier-1 public sources such as the U.S. Census Bureau's Annual Survey of Manufactures, BEA input-output tables, USITC DataWeb, Semiconductor Industry Association shipment trackers, and IEEE journal datasets. Technology and policy outlooks were enriched with NIST white papers and federal budget documents tied to the CHIPS Act. Subscription repositories, including D&B Hoovers for company splits and Dow Jones Factiva for deal tracking, helped cross-verify revenues. Patent pools accessed via Questel, plus filings, investor decks, and trade association notes (ISA, Automation Federation), rounded out desk inputs. The sources listed are illustrative, not exhaustive.
Market-Sizing & Forecasting
We start with a top-down reconstruction built on domestic production value, import-export balances, and end-use penetration pools, which are then validated against sampled supplier roll-ups and channel ASP × volume checks. Core variables, such as ADAS sensor counts per vehicle, annual smartphone launches, wafer-fab utilization, installed IIoT nodes, and announced federal capex, feed the model. Forecasts employ multivariate regression blended with ARIMA smoothing; scenario reviews with industry experts adjust for policy shocks or recession risks. Gaps in bottom-up estimates are bridged through weighted averages of validated primary datapoints.
Data Validation & Update Cycle
Outputs undergo anomaly scans, peer reviews, and variance checks before sign-off. The dataset refreshes annually, with interim updates triggered by material events such as tariff shifts or major fab expansions.
Why Mordor's United States Sensors Baseline Wins Decision-Makers' Trust
Published values often diverge; scopes differ, refresh cadences vary, and price assumptions shift. By segmenting every sensor form factor, stating each input, and revisiting models yearly, we anchor clients to a stable yet current reference.
Key Gap Drivers include studies that bundle only 'smart' devices housing embedded MCUs, restrict coverage to industrial settings, or focus only on IoT-ready modules; many also apply differing inflation or currency treatments.
Benchmark comparison
| Market Size | Anonymized source | Primary gap driver |
|---|---|---|
| USD 30.94 B (2025) | Mordor Intelligence | - |
| USD 31.9 B (2024) | Global Consultancy A | Smart sensor scope; embedded control ICs and firmware counted |
| USD 16.52 B (2025) | Trade Journal B | Industrial-only lens; consumer, auto, and medical sensors excluded |
| USD 3.9 B (2024) | Regional Consultancy C | IoT sensor subset; legacy wired or analog units omitted |
The comparison confirms that, by spanning all sensor classes and validating each variable with market actors, Mordor Intelligence provides the balanced, reproducible baseline on which U.S. decision-makers can confidently rely.


Key Questions Answered in the Report
What was the value of the United States sensors market in 2026?
The market size was valued at USD 33.26 billion in 2026.
Which product category leads the market?
Pressure sensors led with a 30.74% revenue share in 2025.
How fast will quantum sensors grow in the country?
Quantum sensors are forecast to register a 23.38% CAGR between 2026 and 2031.
Why are methane-leak regulations important for sensor demand?
EPA rules impose penalties up to USD 1,500 per metric ton of methane by 2026, driving rapid deployment of gas-detection sensors.
Which region is attracting the most sensor-fabrication investment?
Arizona and Texas are emerging as major hubs due to CHIPS Act-funded semiconductor fabs.
Page last updated on:


