
Torque Sensor Market Size and Share
Market Overview
| Study Period | 2020 - 2031 |
|---|---|
| Market Size (2026) | USD 11.59 Billion |
| Market Size (2031) | USD 18.62 Billion |
| Growth Rate (2026 - 2031) | 9.93 % |
| Fastest Growing Market | South America |
| Largest Market | Asia Pacific |
| Market Concentration | Medium |
Major Players *Disclaimer: Major Players sorted in no particular order Image © Mordor Intelligence. Reuse requires attribution under CC BY 4.0. | |
Torque Sensor Market Analysis by Mordor Intelligence
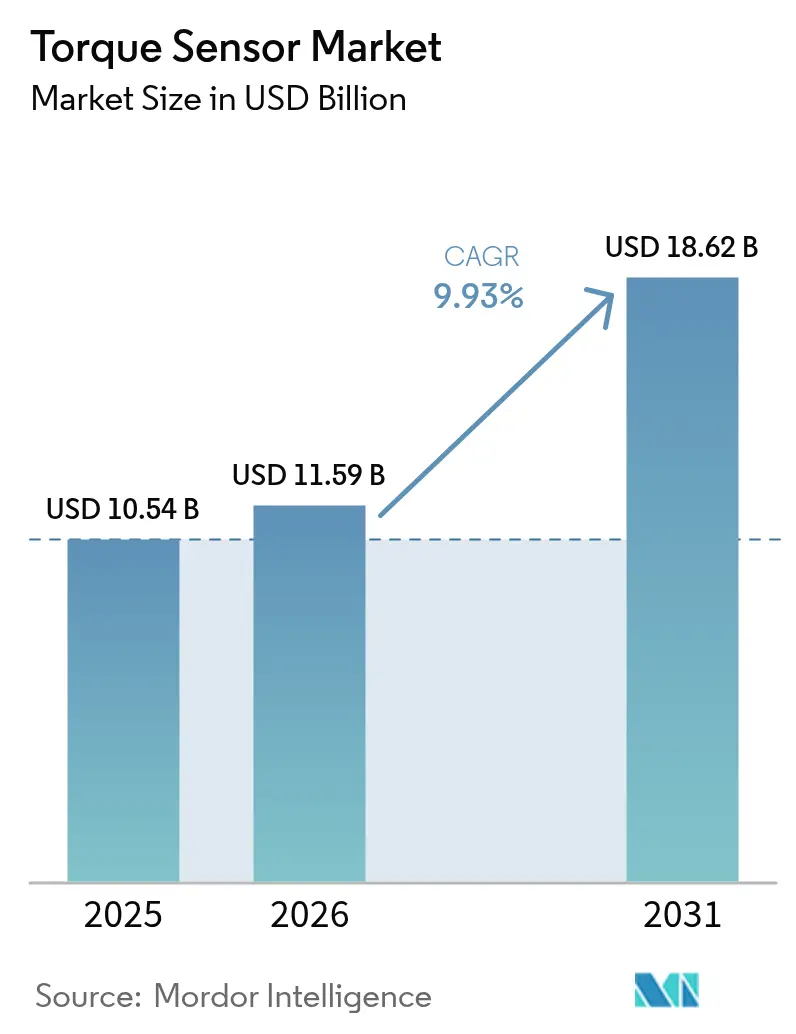
The global torque sensor market size in 2026 is estimated at USD 11.59 billion, growing from 2025 value of USD 10.54 billion with 2031 projections showing USD 18.62 billion, growing at 9.93% CAGR over 2026-2031. Momentum has been underpinned by the rapid electrification of vehicle powertrains, deepening industrial automation, and stricter precision-measurement requirements in infrastructure, energy and medical equipment. Automotive electrification continued to anchor demand as torque feedback became integral to electric power-steering, drivetrain control and advanced driver-assistance functions. Parallel growth in collaborative robots increased the sensor content per machine, while e-bike and other micromobility platforms multiplied high-volume, low-cost opportunities. Vendors shifted differentiation away from raw accuracy toward electromagnetic-interference resilience, wireless telemetry, and integration with predictive-analytics platforms. Supply chain exposure to high-grade magnetoelastic alloys remained a limiting factor, although regional sourcing initiatives in India and South America sought to ease dependence on Chinese rare-earth metals.
Key Report Takeaways
- By product type, rotational sensors held 64.78% of torque sensor market share in 2025, while reaction sensors posted the fastest 11.32% CAGR to 2031
- By technology, strain-gauge devices led with 47.85% revenue share in 2025; surface acoustic wave sensors are on track for a 12.74% CAGR through 2031
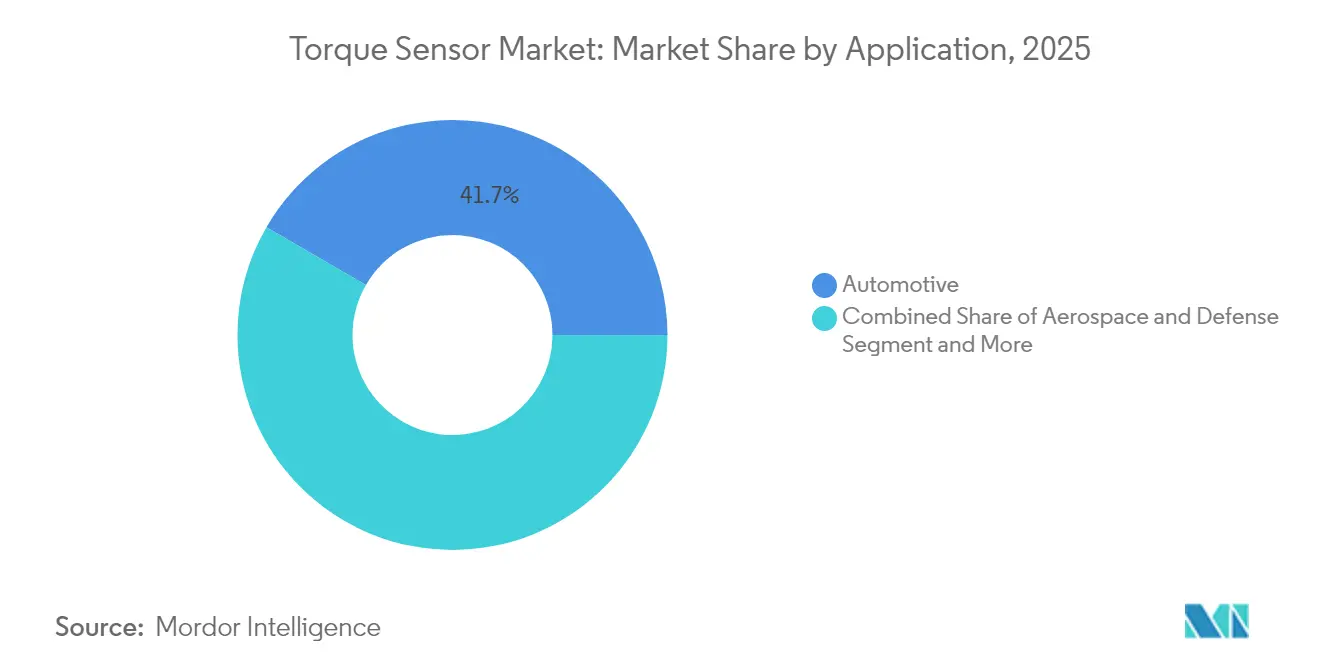
- By application, automotive accounted for 41.65% of the torque sensor market size in 2025; medical and healthcare robotics are set to expand at a 13.52% CAGR to 2031
- By end-user industry, OEM test-stand and QA dominated with 43.76% share of the torque sensor market size in 2025, while in-process monitoring is growing at 11.65% CAGR
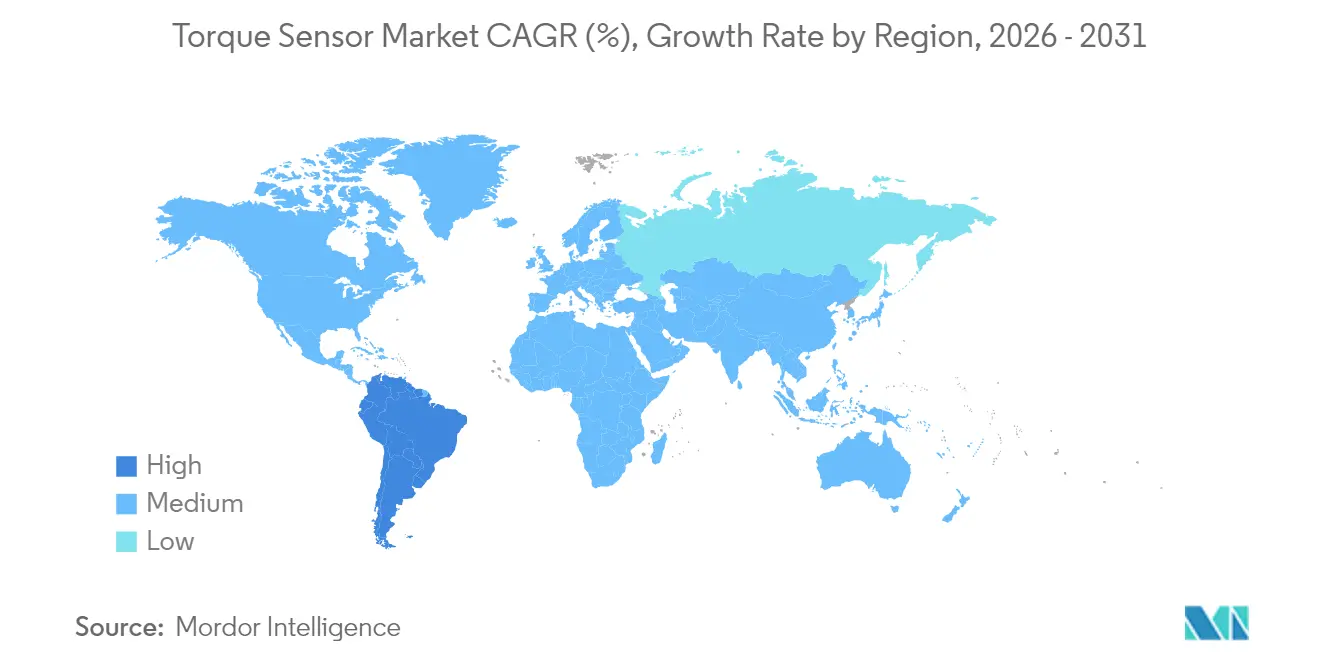
- By geography, Asia-Pacific led with 35.92% of torque sensor market share in 2025; South America is projected to record the quickest 10.98% CAGR through 2031
Note: Market size and forecast figures in this report are generated using Mordor Intelligence’s proprietary estimation framework, updated with the latest available data and insights as of 2026.
Market Trends and Insights
Drivers Impact Analysis of Torque Sensor Market*
| Driver | (~) % Impact on CAGR Forecast | Geographic Relevance | Impact Timeline |
|---|---|---|---|
| Electrification of power-steering systems | +2.8% | North America, Europe, China | Medium term (2-4 years) |
| Rising automation and cobots in manufacturing | +2.1% | Asia-Pacific core; spill-over to North America, Europe | Long term (≥ 4 years) |
| Surge in e-bike and micromobility production | +1.9% | Europe, Asia-Pacific; emerging North America | Short term (≤ 2 years) |
| Growing use in axial-flux EV motors | +1.4% | Global; early adoption in premium EVs | Medium term (2-4 years) |
| On-board monitoring in smart wind turbines | +0.7% | Europe, North America, global offshore | Long term (≥ 4 years) |
| Source: Mordor Intelligence | |||
Electrification of Power-Steering (EPS) Systems
Mandated torque monitoring for electric power-steering hardened demand even during economic slow-downs. European regulations issued in 2024 required continuous steering-torque feedback for autonomous-readiness, obligating every EPS unit to embed at least one sensor. OEMs adopted dual-redundant designs to satisfy functional-safety targets, effectively doubling sensor volumes per vehicle. Suppliers such as Vitesco cited EPS torque sensing as a core enabler for semi-autonomous lane-keeping and driver-intention prediction. [1] The same data channel is reused in over-the-air analytics, increasing lifetime service revenue for integrators. As legacy hydraulic steering platforms sunset, the addressable automotive base shifted irreversibly toward EPS architectures.
Rising Automation and Cobots in Manufacturing
Collaborative robots required instantaneous torque detection to comply with ISO 10218 safety limits, creating a one-to-one relationship between cobot shipments and sensor units. Global cobot sales outpaced conventional industrial robots in 2024, inducing a steep ramp in EMI-resistant, multi-axis torque sensors destined for electronics, food and light-assembly lines. Certification guidelines enforced redundant sensing, effectively raising bill-of-materials value for each robot. Penetration remained only 26% among Polish SMEs in 2024, illustrating vast latent upside across European manufacturing. Long-term impact spans beyond discrete automation as smart work-cells propagate into textile and agri-processing plants.
Surge in E-Bike and Micromobility Production
Torque-based pedal-assist systems achieved regulatory preference in European markets, obligating accurate measurement of rider effort for legal speed cut-offs. Magnetic position sensors have begun replacing strain-gauges on entry-level models to ease calibration and assembly costs. Producer volumes rose sharply as urban congestion policies pushed commuters toward e-bikes and lightweight cargo trikes. Each vehicle integrates at least one crank or rear-hub torque unit, ensuring proportional growth between unit shipments and sensor demand. Rapid iteration cycles in consumer mobility encouraged module-level standardization, supporting scalable supply for Asia-based contract manufacturers.
Growing Use in Axial-Flux Motors for EV Drivetrains
Axial-flux designs delivered double the power density of radial motors yet required fine torque control to manage distinctive magnetic saturation behaviors. Prototype passenger-car platforms entering pre-series production in 2024 added shaft-end or stator-embedded sensors to capture real-time torque ripple for inverter optimization. Smaller gear ratios amplified the importance of direct drive monitoring, and premium EV brands positioned axial-flux torque feedback as a ride-quality differentiator. Research in 2025 confirmed that optimized axial-flux motors achieved superior lumped-parameter performance once equipped with closed-loop torque measurement.
Restraints Impact Analysis of Torque Sensor Market*
| Restraint | (~) % Impact on CAGR Forecast | Geographic Relevance | Impact Timeline |
|---|---|---|---|
| Price sensitivity in volume automotive programs | -1.6% | Global; acute in emerging markets | Short term (≤ 2 years) |
| Reliability issues under electromagnetic interference | -0.9% | Global; larger impact in industrial, aero | Medium term (2-4 years) |
| Supply bottlenecks for high-grade magnetoelastic alloys | -0.7% | Asia-Pacific-centered supply chains | Long term (≥ 4 years) |
| Source: Mordor Intelligence | |||
Price Sensitivity in Volume Automotive Programs
OEM cost-down targets capped sensor pricing near USD 50 per unit in mainstream EV platforms, pressuring suppliers to strip auxiliary features. The need to offset battery-pack costs heightened scrutiny of every drivetrain component, with platform standardization further commoditizing specifications. Rare-earth magnet supply disruptions in 2024 exacerbated the dilemma, forcing Indian and South American automakers to weigh substitute materials that risked lower precision. Suppliers countered with modular electronics, allowing optional conditioning boards for premium trims while preserving a low-cost core for entry variants.
Reliability Issues under Electromagnetic Interference
High-voltage inverters and fast-switching power electronics in EVs and industrial drives generated EMI levels capable of distorting millivolt-level torque signals. A 2025 study showed an 87.5% enhancement in computational efficiency after implementing predictive EMI-suppression algorithms, though additional shielding and filtering raised total system cost. [2] Aerospace and UAV programs cited similar interference-induced mis-reads that compromised fly-by-wire redundancies. The trade-off between cable-based strain-gauges and wireless SAW or optical architectures remained unresolved for many volume customers.
*Our forecasts treat driver/restraint impacts as directional, not additive. The impact forecasts reflect baseline growth, mix effects, and variable interactions.
Torque Sensor Market Segment Analysis
By Product Type:
Rotational Sensors Dominate ApplicationsRotational units captured 64.78% of torque sensor market share in 2025 on the strength of drivetrain, wind-turbine and process-control deployments. They offered continuous, in-situ measurement that supported closed-loop control in EVs and turbines. Reaction types, while smaller in base, posted an 11.32% CAGR as automated test-stands proliferated across machining and battery-cell wrap processes. Digital telemetry elevated rotational designs by removing slip rings, boosting reliability in harsh industrial settings.
Rotational sensors evolved into edge-computing nodes, streaming data to cloud dashboards for predictive maintenance. In-process machining adopted reaction units to catch torque spikes indicative of tool wear, advancing zero-defect programs in aerospace structural milling. The torque sensor market benefits as OEMs retrofit older assembly lines to meet traceability mandates, ensuring both sensor categories sustain parallel growth.


By Technology:
Strain-Gauge Leadership Faces SAW ChallengeStrain-gauges retained 47.85% revenue in 2025, favored for cost and proven ruggedness. Yet, SAW sensors recorded a 12.74% CAGR and gained share where EMI immunity and wireless data mattered most. Magnetoelastic variants served sealed, non-contact duties in pump shafts, whereas optical fibers targeted lab and aerospace calibration where nano-radian resolution justified premium pricing.
SAW innovations in 2024 achieved temperature tolerance to 1,000 °C and 10 µm displacement resolution. Such capabilities unlocked extreme-environment markets like gas turbines and deep-well drilling. The torque sensor market thus witnessed technology bifurcation: low-cost strain-gauges for commoditized automotive steering, and high-value SAW or optical units for hazardous or mission-critical niches.
By Application:
Automotive Leads, Healthcare AcceleratesAutomotive applications commanded 41.65% of torque sensor market size in 2025, buoyed by EPS and traction-motor control loops. Medical and healthcare robotics, however, registered the swiftest 13.52% CAGR to 2031 as surgical platforms multiplied across private hospitals. Aerospace turbine testing and industrial manufacturing held mid-single-digit trajectories, supported by Industry 4.0 retrofits.
Surgical-robot OEMs embedded multi-axis strain-gauges at each joint to assure haptic feedback fidelity, driving per-system sensor counts higher than in automotive steering columns. Regulatory scrutiny over patient safety cemented torque sensing as a non-negotiable bill-of-materials line item, accelerating the torque sensor market across healthcare use cases.
By End-User Industry:
OEM Testing Dominates, In-Process Monitoring SurgesOEM laboratory and end-of-line test-stands accounted for 43.76% share of the torque sensor market size in 2025 thanks to stringent validation protocols in automotive, aerospace and energy sectors. In-process monitoring logged a 11.65% CAGR, mirroring the shift from post-hoc QC toward real-time control envisioned in Industry 4.0 roadmaps.
Digital performance-management pilots in 2024 showed torque data outperforming legacy OEE indices for early fault detection. Cloud-linked sensors enabled hour-level drill-downs into spindle performance, reducing unplanned downtime. As manufacturers standardize such analytics, sensor volumes will decouple from new-equipment sales and follow retrofit cycles instead.
Geography Analysis
APAC Torque Sensor Market
Asia-Pacific generated 35.92% of 2025 revenue and sustained leadership through dense automotive assembly, semiconductor fabrication and robotics adoption. China led EPS volumes, Japan supplied precision strain-gauge substrates, and South Korea’s electronics majors deployed high-resolution torque feedback in battery and display lines. India’s push to localize rare-earth magnet production, with 500-tonne annual capacity targeted by 2026, promised to moderate raw-material risk across the region.
North America Torque Sensor Market
North America maintained its premium niche as aerospace and defense integrators employed high-temperature optical sensors for engine testing. US EV start-ups leveraged axial-flux motors requiring sophisticated torque control loops, bolstering demand for SAW and magnetoelastic devices. Mexico’s growing role as an automotive export hub amplified mid-volume, cost-sensitive orders for steering and drivetrain sensing.
Europe and South America Torque Sensor Market
Europe advanced steadily on regulatory mandates that embedded torque measurement into collaborative robot safety standards and vehicle autonomous-readiness rules. Germany’s automation vendors integrated sensor gateways into programmable-logic controllers, while France’s nuclear maintenance contractors adopted wireless torque heads to accelerate outage turnarounds. South America, led by Brazil, posted the fastest 10.98% CAGR as OEMs installed new stamping and powertrain lines requiring extensive test-stand instrumentation.
Regulatory Landscape
Torque sensor demand in automation and robotics is shaped by machinery safety rules and robot-cell standards that translate into design, validation, and documentation requirements. In the European Union, the EU Machinery Regulation (EU) 2023/1230 updates essential health and safety requirements to address risks from digital technologies, including sensor-integrated and increasingly autonomous machinery, which raises conformity assessment expectations for sensor-enabled equipment placed on the EU market.
In industrial robot deployments, updated safety frameworks also affect how torque sensing is specified for collaborative applications. ANSI/A3 R15.06-2025 refreshes safety requirements for industrial robots and robot systems in the United States, while IEC 61496-3:2025 (published August 2025) updates requirements for electro-sensitive protective equipment used in safety systems. For calibration and traceability, ISO 6789-1:2017 and ISO 6789-2:2017 remain key references for torque measurement devices and calibration practices, reinforcing the need for traceable calibration aligned with ISO/IEC 17025 laboratory competence in many customer audits and acceptance procedures.
Value Chain Analysis
The torque sensor value chain starts with specialized raw materials and precision parts, then moves through sensing element fabrication, electronics integration, and calibration before distribution into OEM systems and aftermarket service. Upstream inputs include high-grade alloys and precision-machined shaft components for rotational sensors, along with semiconductor-based signal-conditioning modules. Allocation and lead-time pressure has been most visible in electronics (extended allocation periods through 2024-2026), while precision machining lead times for shaft blanks and special alloys have been cited at roughly 8 to 12 weeks from European mills for high-accuracy rotational builds.
Midstream, sensor manufacturers assemble strain-gauge, magnetoelastic, optical, or SAW architectures with packaging designed for EMI robustness and harsh environments, then certify performance via calibration and test infrastructure. Downstream, torque sensors are embedded by automotive and industrial OEMs into EPS, drivetrains, test stands, and robotic joints, and increasingly into integrated mechatronic subassemblies. Harmonic Drive SE introduced a Harmonic Drive Gear with an integrated torque sensor (June 2025) targeting robotics and medical technology, highlighting a shift toward component-level integration rather than standalone transducers. System integrators and automation vendors then bundle sensors with drives, PLCs, and analytics, while service providers and calibration labs support lifecycle recertification for QA and regulated end-use cases.
Competitive Landscape
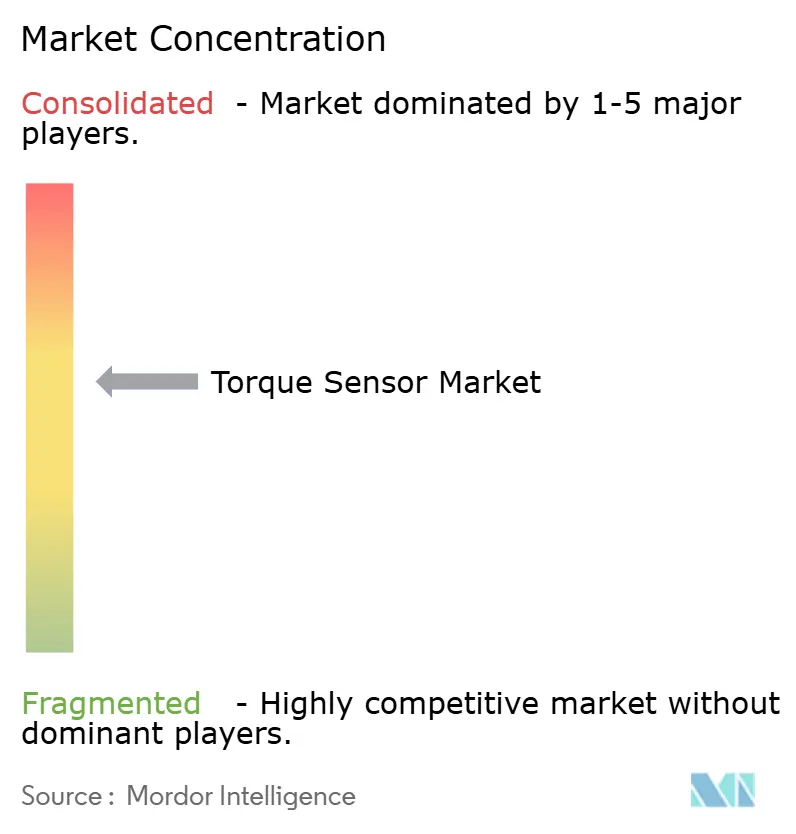
The torque sensor market remained moderately fragmented: the top five suppliers controlled roughly 45% of revenue, leaving space for specialist challengers. ABB packaged sensors within full electric-drive solutions, leveraging its USD 32.2 billion motion portfolio to cross-sell into factory retrofits. Honeywell exploited aerospace certifications to sustain premium pricing in extreme-temperature programs. [4] TE Connectivity’s automotive dominance helped push lower-cost strain-gauges into emerging-market steering assemblies.
Kistler capitalized on dynamic measurement expertise to win EV powertrain test benches, while Sensor Technology’s 2025 launch of compact split-head TorqSense offered installers a drop-in option for cramped driveline architectures. Smaller firms carved niches around wireless SAW modules and cloud analytics, often partnering with MES vendors to bundle data dashboards. Competition thus pivoted on integration agility and EMI resilience more than on baseline accuracy, resetting differentiation rules in the torque sensor market.
Torque Sensor Industry Leaders
-
ABB Ltd
-
Crane Electronics Ltd
-
Honeywell International
-
Hottinger Brüel & Kjær (HBK – Spectris plc)
-
Applied Measurements Ltd
- *Disclaimer: Major Players sorted in no particular order
Torque Sensor Market Companies Covered in this Report
- ABB Ltd
- Honeywell International Inc.
- Hottinger Brüel & Kjær (HBK – Spectris plc)
- TE Connectivity Ltd
- Kistler Instrumente AG
- Infineon Technologies AG
- Norbar Torque Tools Ltd
- Crane Electronics Ltd
- S. Himmelstein & Company Inc.
- Datum Electronics Ltd (Indutrade AB)
- Applied Measurements Ltd
- PCB Piezotronics Inc. (MTS)
- MagCanica Inc.
- Futek Advanced Sensor Technology Inc.
- Forsentek Co. Ltd
- Bota Systems AG
- ATI Industrial Automation (Novanta)
- Althen Sensors & Controls GmbH
- Sensor Technology Ltd (TorqSense)
- Burster Präzisionsmesstechnik GmbH
- Transense Technologies plc (SAWSense)
- Interface Inc.
- Mountz Inc.
- KTR Kupplungstechnik GmbH
- OPKON Optik Elektronik Kontrol San. A.Ş.
Market Opportunities and Future Outlook
Higher-fidelity torque sensing is opening whitespace where indirect estimation and lower-bandwidth measurement leave control and quality gaps, particularly in electrified drivetrains, robotics, and high-dynamic test environments. Product activity already points to this direction: Transense Technologies introduced SAWsense (April 2026) for direct, real-time torque and temperature measurement on electric motor rotors, targeting applications that previously relied on software estimation. In test and measurement, S. Himmelstein and Company released bearingless digital torque sensors (May 2026) aimed at high bandwidth and overload capability, aligning with the growing share of OEM test-stand and QA use (43.76% in 2025) where faster transient capture and repeatable calibration reduce validation cycles.
Robotics is a second opportunity pocket, tied to safety and dexterity needs. In these applications, torque sensors move from single-axis monitoring toward higher-sensitivity, multi-axis feedback for interaction tasks such as peg-in-hole insertion, connector mating, and hand-guiding, while supporting collaborative safety constraints such as ISO 10218. Academic and pre-commercial work also feeds the roadmap toward richer force-torque perception: a Science Advances publication (March 2026) described a torque-angle-pressure tactile sensor concept with fine torque and angle sensitivity for robotic manipulation. Across these use cases, digital interfaces (CAN, I2C, SPI), ruggedized packaging, and non-contact or wireless telemetry support easier integration into connected workcells and rotating equipment, even as supply bottlenecks in specialty alloys and electronics remain a constraint that favors vendors with diversified sourcing and in-region calibration and test capabilities.
Recent Industry Developments in Torque Sensor Market
- June 2026: Crane Electronics launched the WrenchStar Multi Plus digital torque wrench, adding ruggedization features such as IP54 ingress protection and a 2.3 m drop-test rating for demanding assembly environments. The introduction reinforces the shift toward torque-enabled assembly tools that capture higher-integrity tightening data for connected manufacturing and compliance-driven traceability.
- April 2025: TDK expanded its temperature and magnetic sensor lines for automotive and industrial platforms, strengthening multi-sensor integration strategies used in electrified powertrains and automated equipment. Broader sensing portfolios support OEM preferences for consolidated supply and tighter interoperability between torque, position, and condition-monitoring subsystems.
- March 2025: Sensor Technology unveiled the TorqSense SGR530/540 with detachable heads designed for tight packaging in EV driveline installations. The split-head approach improves installation flexibility in constrained architectures and supports retrofit and test-cell deployments where access and alignment can limit conventional transducer options.
Torque Sensor Market Report Scope and Research Methodology
Market Definition and Coverage
The torque sensor market is defined as revenue generated from torque sensing devices that measure torque on rotating or fixed mechanical parts and provide an output signal for monitoring, control, or testing across industrial and mobility end uses.
Scope exclusions: The scope excludes actuators and focuses on torque sensor hardware revenue only (meaning services and adjacent control components are not counted).
Segments Covered in This Report
- By Product Type
- Reaction Torque Sensors
- Rotational / Rotary Torque Sensors
- By Technology
- Strain-Gauge
- Magnetoelastic
- Optical
- SAW (Surface Acoustic Wave)
- Others
- By Application
- Automotive
- Aerospace and Defense
- Industrial Manufacturing and Robotics
- Medical and Healthcare
- Energy and Power
- By End-User Industry
- OEM Test-Stand and QA
- In-Process Monitoring
- Research and Development
- By Geography
- North America
- United States
- Canada
- Mexico
- South America
- Brazil
- Argentina
- Rest of South America
- Europe
- Germany
- United Kingdom
- France
- Russia
- Rest of Europe
- Asia-Pacific
- China
- Japan
- South Korea
- India
- Rest of Asia-Pacific
- Middle East and Africa
- Middle East
- Saudi Arabia
- United Arab Emirates
- Turkey
- Rest of Middle East
- Africa
- South Africa
- Nigeria
- Rest of Africa
- Middle East
- North America
Data Sources, Market Sizing, and Validation
Desk Research
Desk research was used to set the fact base for demand signals, supply capacity context, and price movement patterns before any market math was finalized. We typically refer to public sources such as U.S. Census Bureau manufacturing statistics, Eurostat industrial production series, UN Comtrade trade flows for sensor related HS codes, and standards bodies publications such as ISO and IEC that influence test and calibration practices.
We also review company annual reports, investor presentations, and product catalogs to understand how torque sensors are positioned by type and typical end uses. For triangulation, patent databases and peer-reviewed engineering journals help track design direction (such as strain gauge, magnetoelastic, and SAW), and an import-export shipment-level database can be used selectively to sanity check cross-border movement of relevant components. The desk research sources listed above are illustrative, and many other public and paid references were also used for data collection, validation, and clarification.
Primary Interviews and Surveys
Primary work was used to pressure test the desk assumptions and to close gaps around average selling prices, adoption rates, and replacement cycles across key end markets. We spoke with a mix of sensor manufacturers, integrators, test and measurement users, and OEM-aligned engineering roles, and coverage was balanced across APAC, EMEA, and the Americas so regional production and demand differences could be reflected.
Distribution of primary research fieldwork respondents
| Company type | Respondent position | Region |
|---|---|---|
| Top tier: 26% | CXOs: 17% | APAC: 42% |
| Mid tier: 57% | Functional/Unit leaders: 32% | EMEA: 33% |
| Smaller Players: 17% | Managers: 51% | Americas: 25% |
Market-Sizing & Forecasting
Sizing is built using a top-down approach where production, trade, and end-market activity indicators are translated into a consistent demand pool for torque sensing hardware. To keep totals realistic, we cross-check results using selective bottom-up approximations, such as sampled price points multiplied by estimated unit volumes in a few high-usage applications, then adjust where the top-down and bottom-up views diverge.
The model uses practical inputs that can be defended on a client call, including torque sensor penetration in electric power steering and other drivetrain systems, industrial automation and test-bench utilization levels, typical calibration and replacement intervals, mix shifts between rotary and reaction sensors, and observed pricing direction by technology type. Forecasting runs through scenario analysis, where growth variables are moved in steps based on what industry experts expect for EV production momentum, factory automation spend cycles, and aerospace build rates, and then the mid-case is selected after reconciling with interview feedback.
Where a direct unit build-up is not possible for a niche use case, the gap is handled through proxy indicators (such as installed base growth and maintenance intensity) so the final number remains traceable to clear drivers rather than unsupported aggregation.
Data Validation & Update Cycle
Validation is done through multiple checks so outliers do not quietly enter the final tables. We compare outputs against independent signals like regional manufacturing output direction, trade movement consistency, and whether implied prices stay within ranges seen in catalogs and interview feedback.
When large variances appear, assumptions are reopened, respondents are re-contacted selectively, and the model is recalculated before sign-off. The report is refreshed annually, and interim updates are also made when material events change the demand outlook, after which a final review pass is completed close to delivery so clients receive the latest view.
Mordor Intelligence's Torque Sensor Market Sizing Compared With Other Published Estimates
Published market numbers for torque sensors can look far apart even when publishers are describing the same industry, because each publisher draws the scope line differently and chooses its own timing for exchange rates and base years. Differences also come from how each study separates hardware versus services, and whether application coverage is built from a real demand pool or from broad revenue scaling.
The main gap comes from whether actuator and service revenues are mixed into the total. Mordor Intelligence counts only torque sensor hardware and keeps transducers limited to sensing, which can push some broader estimates higher even when the growth story is similar.
Benchmark comparison
| Source | Market Size | Gaps in Research Methodology |
|---|---|---|
| Mordor Intelligence | USD 11.59 B (2026) | |
| Global Consultancy A | USD 11.58 B (2025) | Uses a 2025 base year and a longer forecast window, and the page does not clearly state hardware-only treatment, so adjacent revenue lines can get blended depending on how solutions are defined. |
| Industry Publisher B | USD 10.16 B (2025) | Base year and history window differ and the sizing is presented around 2025 with a 2026-2034 CAGR, which can shift the starting value depending on how pricing and currency timing are handled. |
The table shows that year choice and what gets included in revenue are the biggest reasons for the spread. By keeping inputs tied to adoption, pricing, and replacement patterns that can be cross-checked with interviews and public signals, the estimate stays repeatable and easier to audit when new information appears.
Key Questions Answered in the Report
What was the global torque sensor market size in 2026 and where is it heading?
The market reached USD 11.59 billion in 2026 and is projected to hit USD 18.62 billion by 2031, reflecting a 9.93% CAGR.
Which segment holds the largest torque sensor market share today?
Rotational sensors led with 64.78% share in 2025, driven by drivetrain and turbine uses.
Why are torque sensors critical for electric power-steering systems?
EPS platforms rely on continuous torque feedback to modulate motor assistance and fulfil autonomous-readiness safety rules.
Which region is growing fastest for torque sensors?
South America is forecast to expand at 10.98% CAGR through 2031 on rising manufacturing investment.
How are collaborative robots influencing torque sensor demand?
Cobots mandate redundant torque sensing for human-safety compliance, increasing sensor content per robot and driving long-term demand.