Microsegmentation Market Size and Share
Market Overview
| Study Period | 2020 - 2031 |
|---|---|
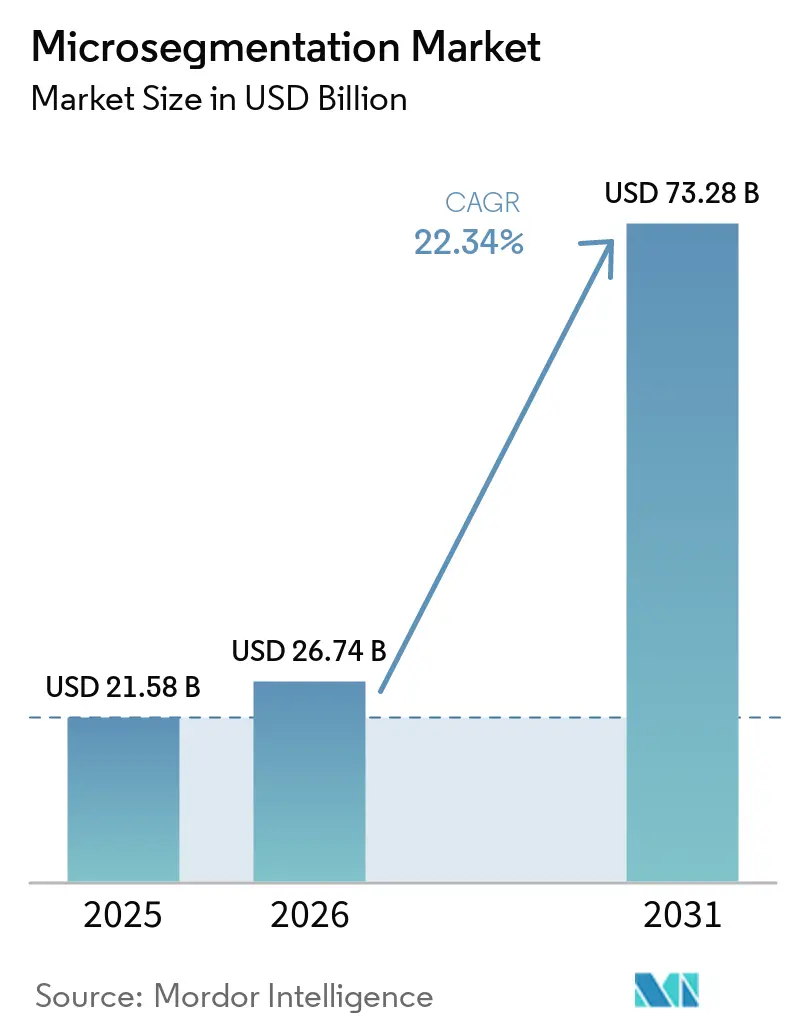
| Market Size (2026) | USD 26.74 Billion |
| Market Size (2031) | USD 73.28 Billion |
| Growth Rate (2026 - 2031) | 22.34% CAGR |
| Fastest Growing Market | Asia Pacific |
| Largest Market | North America |
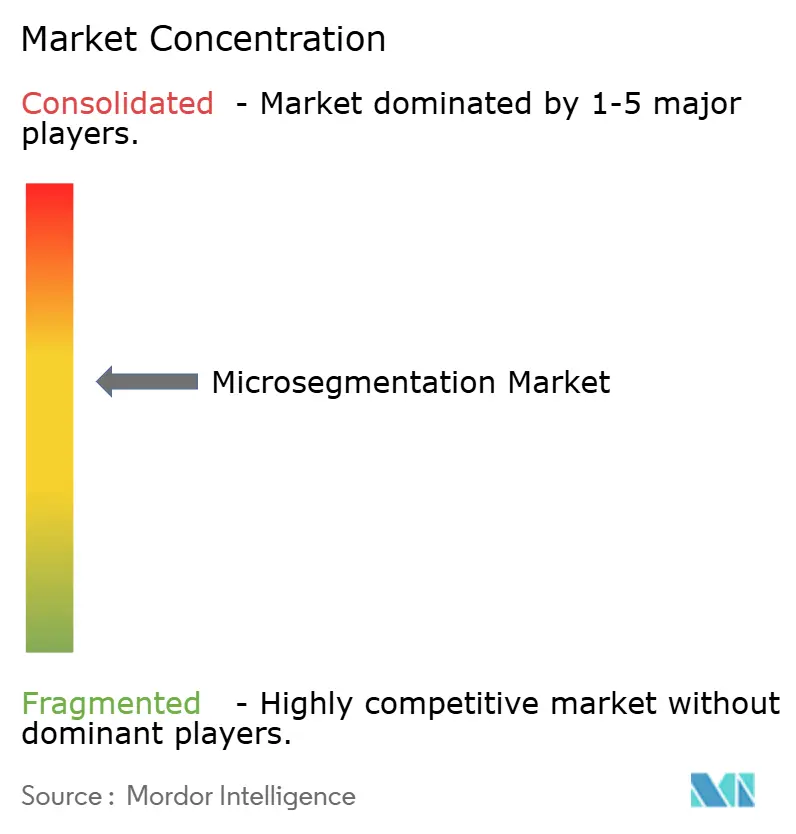
| Market Concentration | Medium |
Major Players *Disclaimer: Major Players sorted in no particular order Image © Mordor Intelligence. Reuse requires attribution under CC BY 4.0. | |
Microsegmentation Market Analysis by Mordor Intelligence
The microsegmentation market size is projected to be USD 21.58 billion in 2025, USD 26.74 billion in 2026, and reach USD 73.28 billion by 2031, growing at a CAGR of 22.34% from 2026 to 2031. Surging ransomware losses, zero-trust mandates, and cloud-native application growth collectively accelerate adoption, moving segmentation from a specialist control to a mainstream architecture. Vendor roadmaps now place workload-centric policy engines at the heart of secure-by-design initiatives, while cyber-insurance discounts turn security outlays into balance-sheet savings. Board-level scrutiny of east-west traffic, amplified by tightening regulations, shortens procurement cycles and sustains double-digit expansion even when broader IT spending moderates. Platform convergence also reshapes competitive dynamics, as networking and identity providers embed segmentation into evergreen subscription bundles, cementing recurring revenue streams.
Key Report Takeaways
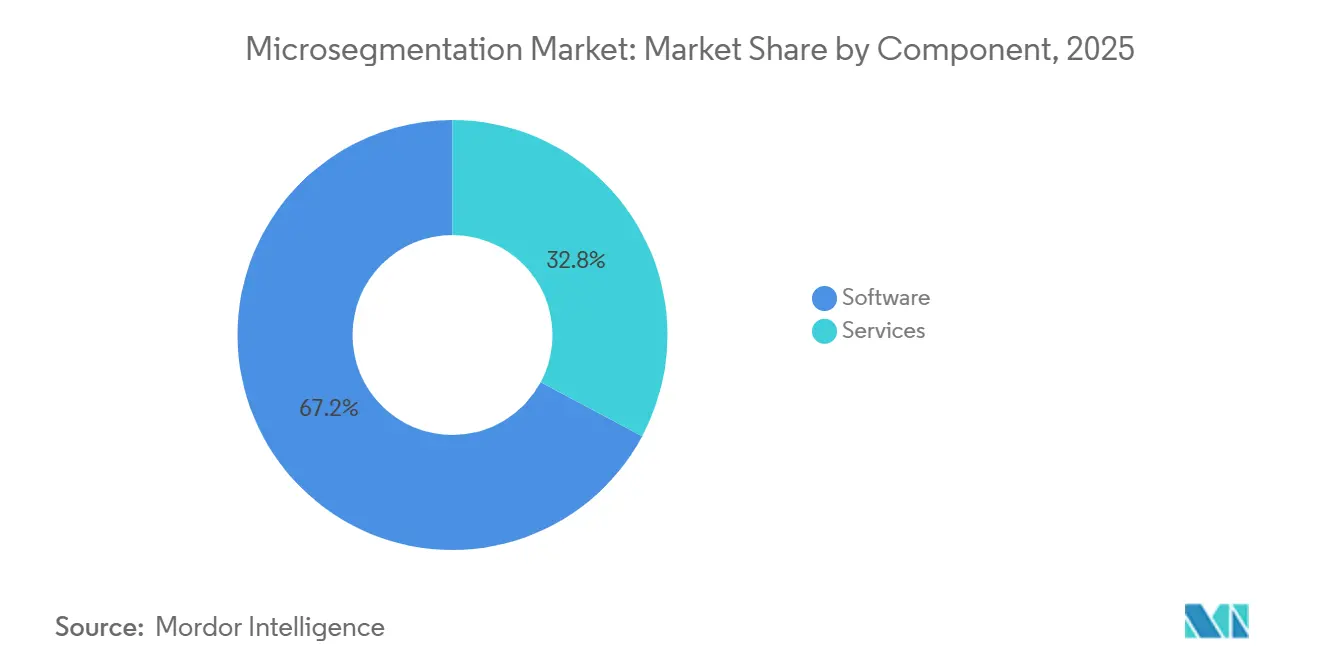
- By component, software led with 67.19% revenue share in 2025, while services are advancing at a 4.99% CAGR through 2031.
- By deployment mode, cloud captured 58.43% of the microsegmentation market share in 2025 and is progressing at a 4.93% CAGR through 2031.
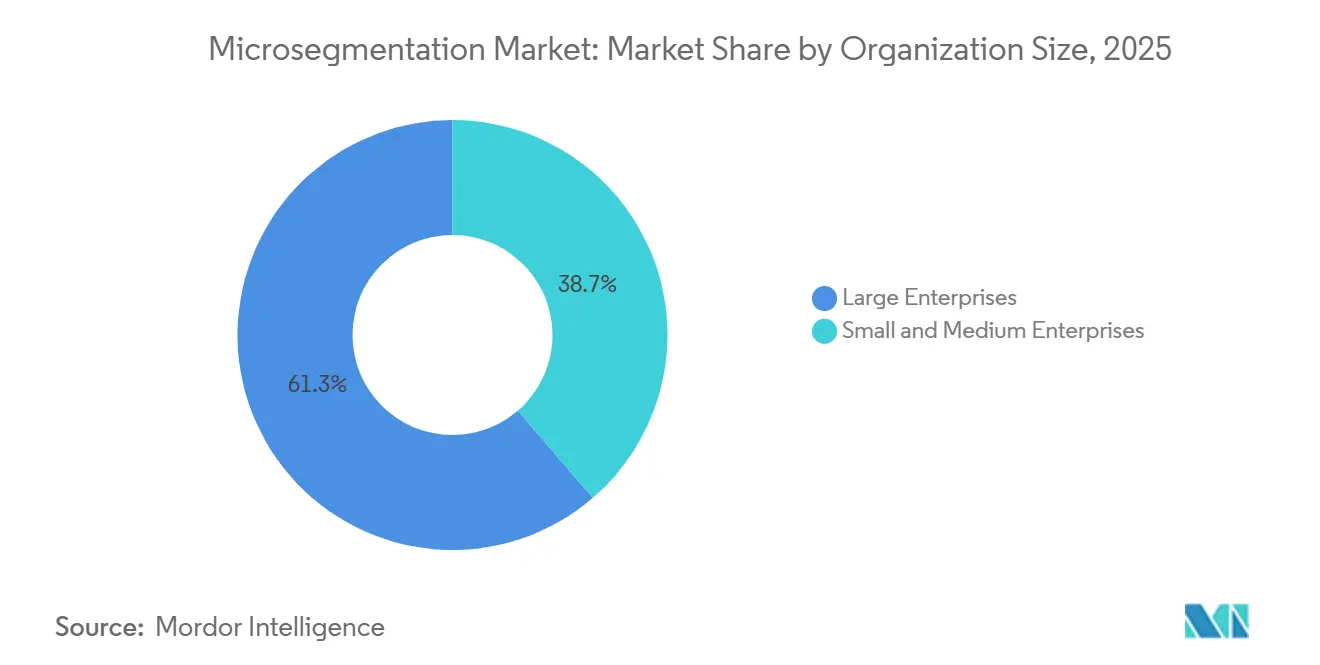
- By organization size, large enterprises accounted for 61.32% of 2025 spending, whereas small and medium enterprises are forecast to accelerate at a 5.18% CAGR through 2031.
- By end-user industry, banking, financial services, and insurance held 28.76% share of the microsegmentation market size in 2025, while healthcare and life sciences are expanding at a 5.06% CAGR over 2026-2031.
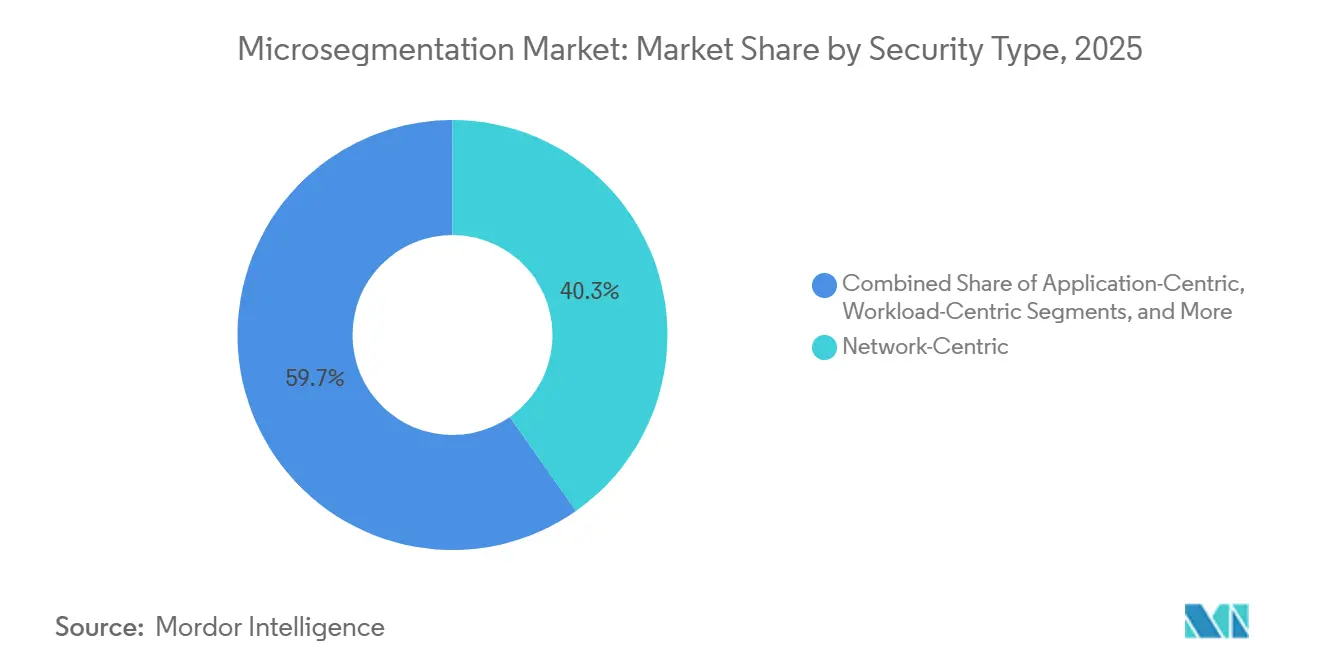
- By security type, network-centric architectures led with 40.27% of 2025 deployments, yet workload-centric approaches are pacing ahead at a 5.22% CAGR through 2031.
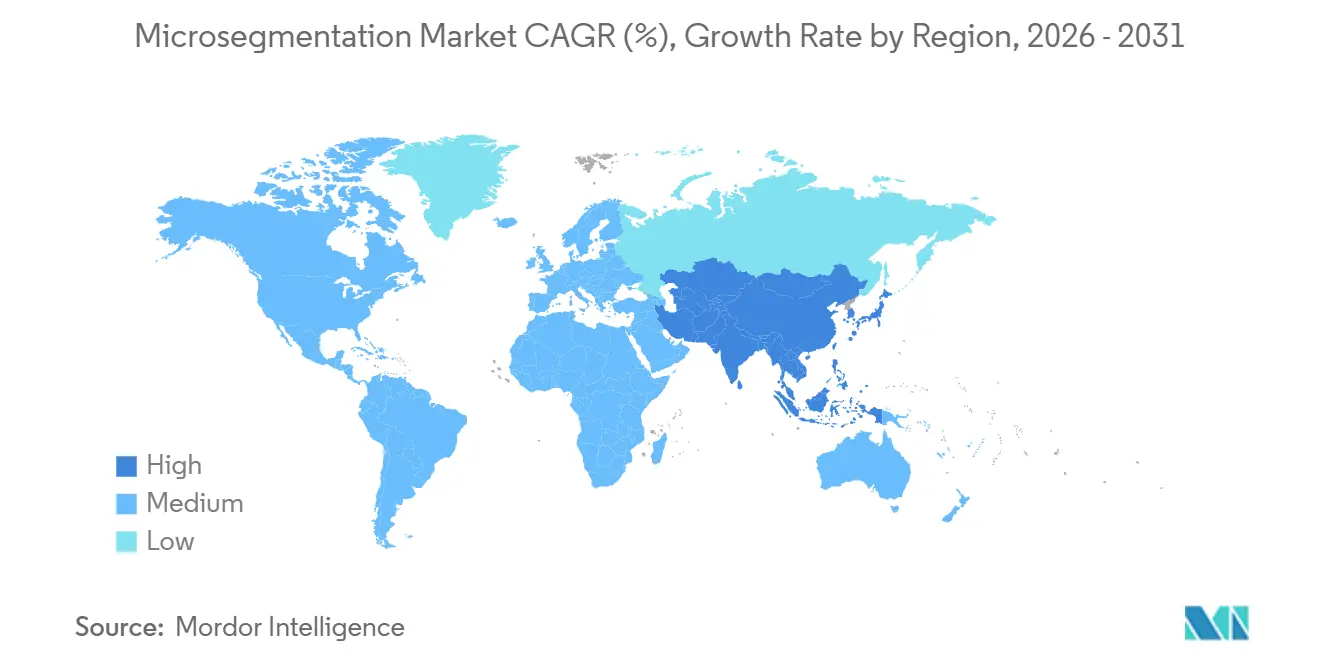
- By geography, North America dominated with 38.51% of 2025 revenue, whereas Asia-Pacific is recording the highest regional CAGR at 5.31% over 2026-2031.
Note: Market size and forecast figures in this report are generated using Mordor Intelligence’s proprietary estimation framework, updated with the latest available data and insights as of January 2026.
Global Microsegmentation Market Trends and Insights
Drivers Impact Analysis*
| Driver | (~) % Impact on CAGR Forecast | Geographic Relevance | Impact Timeline |
|---|---|---|---|
| Rising adoption of Zero‑Trust security architectures | +6.2% | Global; early traction in North America and Europe | Medium term (2–4 years) |
| Surge in ransomware and lateral‑movement cyberattacks | +5.8% | Global; particularly acute in major financial hubs | Short term (≤ 2 years) |
| Regulatory mandates for east‑west traffic control | +4.7% | Europe and North America; expanding into Asia‑Pacific | Medium term (2–4 years) |
| Proliferation of cloud‑native workloads and microservices | +3.9% | Global; concentrated in technology and e‑commerce sectors | Long term (≥ 4 years) |
| Convergence with Secure Access Service Edge (SASE) platforms | +2.6% | North America and Europe; emerging in Asia‑Pacific | Long term (≥ 4 years) |
| Cyber‑insurance pre‑qualification requirements | +1.8% | North America and Europe | Short term (≤ 2 years) |
| Source: Mordor Intelligence | |||
Rising Adoption Of Zero-Trust Security Architectures
Zero-trust programs replace implicit trust with continuous verification, forcing enterprises to isolate every workload, device, and session. The U.S. Office of Management and Budget requires federal agencies to attain zero-trust Level 3 maturity by fiscal 2027, which explicitly calls for microsegmentation on all networks, driving similar moves in highly regulated private sectors.[1]Office of Management and Budget, “Moving the U.S. Government Toward Zero Trust Cybersecurity Principles,” whitehouse.gov Financial institutions report that dwell time dropped from 21 days to under 48 hours after segmentation, confirming the control’s direct impact on breach economics. Vendors align roadmaps accordingly, integrating identity, network, and workload policies into a unified engine that executes in line with zero-trust principles.
Surge In Ransomware And Lateral-Movement Attacks
Average enterprise ransom demands climbed to USD 5.3 million in 2025, a 74% rise from the prior year, as attackers spent longer mapping internal topologies before detonation.[2]Federal Bureau of Investigation, “2025 Internet Crime Report,” fbi.gov Nearly 68% of successful incidents involved cross-segment traversal, a pattern microsegmentation disrupts by sealing off unused pathways. Organizations with pre-existing segmentation reported 89% lower recovery outlays than peers, converting cybersecurity into an actuarial hedge rather than a sunk cost.
Regulatory Mandates For East-West Traffic Control
The European Union NIS2 Directive, enforced since October 2024, obliges 18 critical sectors to maintain documented segmentation policies, with fines up to EUR 10 million (USD 10.8 million) for non-compliance. PCI DSS v4.0 and the U.S. Cybersecurity Maturity Model Certification impose similar requirements, synchronizing global compliance calendars and compressing deployment timelines.[3]PCI Security Standards Council, “Payment Card Industry Data Security Standard Version 4.0,” pcisecuritystandards.org
Proliferation Of Cloud-Native Workloads And Microservices
More than 78% of production workloads now execute in containers or serverless frameworks, rendering static IP-based controls obsolete. Kubernetes adoption expanded 43% year-over-year in 2025, compelling policy engines to follow ephemeral pods via workload identity rather than network location. Cloud-delivered segmentation aligns with infrastructure-as-code pipelines, letting DevSecOps teams deploy policies alongside application builds and cutting operational overhead by 60% for multi-cloud estates.
Restraints Impact Analysis*
| Restraint | (~) % Impact on CAGR Forecast | Geographic Relevance | Impact Timeline |
|---|---|---|---|
| High implementation complexity and cost | −3.2% | Global; more acute among mid‑market enterprises | Short term (≤ 2 years) |
| Legacy infrastructure compatibility challenges | −2.1% | North America and Europe; regions with aging IT and OT infrastructure | Medium term (2–4 years) |
| Scarcity of certified microsegmentation architects | −1.4% | Global; particularly pronounced in Asia‑Pacific and emerging markets | Long term (≥ 4 years) |
| Latency overheads in operational technology (OT) networks | −0.9% | Global; concentrated in manufacturing and energy sectors | Medium term (2–4 years) |
| Source: Mordor Intelligence | |||
High Implementation Complexity And Cost
Segmentation rollouts typically require six to eighteen months, driven by painstaking discovery of application dependencies and extensive pilot testing. Mid-sized enterprises invest between USD 500,000 and USD 5 million for a first phase that covers only mission-critical assets, diverting scarce capital from other modernization programs. Rework risk looms large, as one mis-scoped policy can interrupt production workflows, eroding stakeholder confidence and delaying further phases.
Legacy Infrastructure Compatibility Challenges
Mainframes, programmable logic controllers, and proprietary protocols often lack hooks for identity-based policy enforcement, forcing segmentation to occur at aggregation points rather than at each device. This coarse control leaves residual gaps that attackers can exploit, while custom integration layers inflate project budgets and extend maintenance lifecycles.
*Our forecasts treat driver/restraint impacts as directional, not additive. The impact forecasts reflect baseline growth, mix effects, and variable interactions.
Segment Analysis
By Component: Professional Services Fuel Complex Deployments
Services growth outpaces the overall microsegmentation market, reflecting an acute need for architects who translate abstract security intent into enforceable rules. In 2025, software still generated most revenue, yet organizations discovered that licensing alone does not secure networks. Professional teams spend months mapping traffic flows, drafting allowlists, and validating policy impact on legacy workloads. As these engagements mature, outcome-based contracts gain traction, tying vendor payments to measurable reductions in attack surface or audit findings. Managed service providers bundle microsegmentation into broader offerings that include continuous policy tuning, change management, and incident response, crucial for organizations unable to field full-time segmentation staff.
A secondary dynamic is the emergence of low-code policy generators that embed best practice templates for common enterprise applications. These tools elevate the value of services from repetitive rule writing toward higher-margin advisory roles. The convergence keeps average project scopes high and sustains robust consulting pipelines, even as software per-unit prices are being commoditized.


By Deployment Mode: Cloud Dominance Reflects Infrastructure Shift
Cloud deployments held 58.43% of 2025 revenue as greenfield projects favored SaaS control planes that scale elastically and validate policies in minutes. Cloud delivery removes the need for rack space, cabling, and hardware refresh cycles, reducing time-to-value for distributed enterprises. For multi-cloud users, a unified SaaS console prevents policy syntax drift across Amazon Web Services, Microsoft Azure, and Google Cloud environments.
On-premises deployments, however, remain a fixture in sectors with data sovereignty rules or air-gapped operational technology networks. In those contexts, appliances or self-hosted virtual machines still offer deterministic performance and offline operation. Hybrid patterns are common, with organizations running cloud-delivered policy engines that push rules to on-premises enforcers, yielding a single pane of glass without relocating sensitive data.
By Organization Size: SME Adoption Accelerates Through Managed Services
Large enterprises remain primary buyers thanks to sprawling networks and audit requirements, yet the microsegmentation market now sees its fastest growth within the SME bracket. Managed security service providers amortize skills and tooling, letting smaller businesses procure segmentation as a monthly operating expense rather than a disruptive capital program. Simpler network topologies shorten engagement cycles, allowing SMEs to attain measurable risk reduction in under six months.
Vendor pricing strategies recognize the elasticity of this segment. Starter tiers cover a few hundred workloads and rely on guided onboarding wizards, avoiding the sticker shock of enterprise feature bundles. As ransomware trends spread indiscriminately across company sizes, demand among resource-constrained organizations is expected to remain resilient even when macroeconomic pressures curb discretionary IT budgets.
By End-User Industry: Healthcare Accelerates After Ransomware Surge
Healthcare’s post-attack urgency elevates segmentation from an aspirational project to an operational imperative. Hospitals coping with legacy clinical systems must protect devices that cannot be patched without jeopardizing patient safety. Microsegmentation confines potential compromise to discrete zones while ensuring life-critical traffic, such as imaging transfers, remains unhindered. Cyber-insurers increasingly view segmentation as a prerequisite for underwriting clinical risk, reinforcing the upgrade cycle.
Banking, financial services, and insurance keep overall volume leadership due to long-standing regulatory pressures and deep budgets. Treasury systems, trade settlement engines, and payment processors all benefit from workload isolation, making segmentation a natural extension of data loss prevention initiatives. Meanwhile, government agencies apply segmentation as a cornerstone of zero-trust roadmaps, especially where classified and unclassified flows share infrastructure.
By Security Type: Workload-Centric Gains From Containerization
Network-centric controls prevailed when traffic patterns were static, but dynamic container orchestration rendered IP ranges fleeting. Workload-centric engines now tag policies to cryptographic identities that persist even as compute instances spin up or down. This flexibility is vital for blue-green deployments and auto-scaling clusters, where new pods appear every few seconds. Security teams no longer chase subnet changes, freeing them to focus on rule logic rather than implementation minutiae.
Application-centric strategies, in contrast, place policy boundaries around entire business services such as payment gateways or electronic health record platforms. While this method cannot cover every endpoint, it aligns well with risk-based models that prioritize crown-jewel assets. Endpoint-centric profiles round out the portfolio for remote workforces, tying host posture to real-time access permissions regardless of network location.

Geography Analysis
Asia-Pacific’s high-growth trajectory is fueled by multi-billion-dollar factory modernization programs, fintech proliferation, and national cybersecurity strategies. China mandates localized protection of critical information infrastructure, encouraging sectors such as energy, finance, and telecom to adopt granular controls. In Japan, Industry 4.0 retrofits expose programmable logic controllers to broader networks, necessitating workload isolation that avoids process interruptions.
North America retains demand leadership by virtue of mature cyber budgets and advanced threat activity. U.S. federal zero-trust milestones and state privacy laws create a mosaic of mandates that place segmentation squarely on enterprise roadmaps. Canada’s emphasis on critical infrastructure resilience adds incremental volume, while Mexican nearshoring initiatives inject new demand in manufacturing corridors.
Europe experiences synchronized adoption across critical sectors as penalties for NIS2 non-conformance become a board-level concern. The Middle East channels oil revenue into technology diversification, with large-scale smart city and energy projects embedding segmentation at design time. South American uptake centers on Brazil and Argentina, where financial regulators tighten breach reporting rules, while Africa remains emergent, constrained by shortage of security architects but buoyed by telecom modernization.

Competitive Landscape
The top five providers account for about 45% of revenue, a figure that signals moderate concentration. Incumbent networking vendors embed segmentation into existing fabric management consoles, encouraging customers to activate features already licensed through enterprise agreements. Pure-play specialists respond by doubling down on specificity, tailoring policy engines for operational technology or edge use cases that prize deterministic latency and minimal agent footprint.
Acquisition activity indicates rising consolidation pressure. Six high-profile deals since 2024 demonstrate platform players buying policy automation or machine learning talent to close capability gaps. Post-merger roadmaps often prioritize integration into secure access service edge suites, turning microsegmentation from an add-on into a table-stake within broader secure service bundles.
Nonetheless, room remains for innovation around no-code policy orchestration, AI-guided dependency mapping, and agentless enforcement. Venture investment into startups that promise sub-hour discovery scans and single-click policy synthesis reflects persistent pain points around complexity and talent scarcity. As technology converges, pricing models shift from per-workload licensing to tiered subscriptions linked to protected asset value or verified risk reduction, aligning supplier incentives with customer outcomes.
Microsegmentation Industry Leaders
Illumio, Inc.
VMware, Inc.
Cisco Systems, Inc.
Akamai Technologies, Inc.
Palo Alto Networks, Inc.
- *Disclaimer: Major Players sorted in no particular order

Recent Industry Developments
- March 2026: ColorTokens received FedRAMP High authorization for its Xshield platform, expanding eligibility to U.S. federal agencies.
- February 2026: Cisco integrated Secure Workload with its Security Service Edge stack, offering unified policy enforcement for hybrid environments.
- February 2026: Check Point rolled out Quantum Spark 1900 appliances targeting SMEs with integrated microsegmentation at a sub-USD 10,000 price point.
- January 2026: Palo Alto Networks launched Prisma Cloud 3.0, featuring automated workload-centric segmentation for Kubernetes clusters.


Global Microsegmentation Market Report Scope
The Microsegmentation Market refers to the industry focused on advanced network security solutions that divide data centers and cloud environments into smaller, isolated segments to protect workloads and applications from cyber threats. Microsegmentation enables organizations to implement granular security policies, control east-west traffic, and limit the lateral movement of attackers within IT infrastructures.
The Microsegmentation Market Report is Segmented by Component (Software, Services), Deployment Mode (On-Premises, Cloud), Organization Size (Small and Medium Enterprises, Large Enterprises), End-User Industry (BFSI, Healthcare and Life Sciences, Government and Defense, IT and Telecommunication, Retail and E-Commerce, Energy and Utilities, Rest of End-User Industry), Security Type (Network-Centric, Application-Centric, Workload-Centric, Endpoint-Centric), and Geography (North America, Europe, Asia-Pacific, Middle East, Africa, South America). The Market Forecasts are Provided in Terms of Value (USD).
| Software |
| Services |
| On-Premises |
| Cloud |
| Small and Medium Enterprises |
| Large Enterprises |
| Banking, Financial Services and Insurance (BFSI) |
| Healthcare and Life Sciences |
| Government and Defense |
| IT and Telecommunication |
| Retail and E-Commerce |
| Energy and Utilities |
| Rest of End-User Industry |
| Network-Centric |
| Application-Centric |
| Workload-Centric |
| Endpoint-Centric |
| North America | United States |
| Canada | |
| Mexico | |
| Europe | Germany |
| United Kingdom | |
| France | |
| Russia | |
| Rest of Europe | |
| Asia-Pacific | China |
| Japan | |
| India | |
| South Korea | |
| Australia | |
| Rest of Asia-Pacific | |
| Middle East | Saudi Arabia |
| United Arab Emirates | |
| Rest of Middle East | |
| Africa | South Africa |
| Egypt | |
| Rest of Africa | |
| South America | Brazil |
| Argentina | |
| Rest of South America |
| By Component | Software | |
| Services | ||
| By Deployment Mode | On-Premises | |
| Cloud | ||
| By Organization Size | Small and Medium Enterprises | |
| Large Enterprises | ||
| By End-User Industry | Banking, Financial Services and Insurance (BFSI) | |
| Healthcare and Life Sciences | ||
| Government and Defense | ||
| IT and Telecommunication | ||
| Retail and E-Commerce | ||
| Energy and Utilities | ||
| Rest of End-User Industry | ||
| By Security Type | Network-Centric | |
| Application-Centric | ||
| Workload-Centric | ||
| Endpoint-Centric | ||
| By Geography | North America | United States |
| Canada | ||
| Mexico | ||
| Europe | Germany | |
| United Kingdom | ||
| France | ||
| Russia | ||
| Rest of Europe | ||
| Asia-Pacific | China | |
| Japan | ||
| India | ||
| South Korea | ||
| Australia | ||
| Rest of Asia-Pacific | ||
| Middle East | Saudi Arabia | |
| United Arab Emirates | ||
| Rest of Middle East | ||
| Africa | South Africa | |
| Egypt | ||
| Rest of Africa | ||
| South America | Brazil | |
| Argentina | ||
| Rest of South America | ||


Key Questions Answered in the Report
How quickly can a mid-sized firm implement microsegmentation controls?
Typical implementations complete within 6-12 months when supported by managed security service providers (MSSPs), which accelerate policy discovery and validation cycles.
What drives the rising demand for segmentation in healthcare?
A surge in ransomware attacks disrupting patient care during 2024-2025 forced hospitals to isolate clinical systems, making healthcare the fastest-growing end-user segment by CAGR.
Why is workload-centric segmentation overtaking network-centric approaches?
Container orchestration and serverless environments create ephemeral workloads, making identity- and workload-based policies more effective than static, network-defined rules.
How do regulations influence purchasing timelines?
Regulations such as the EU NIS2 Directive impose material financial penalties for non-compliance, compressing procurement cycles as boards approve segmentation investments to mitigate regulatory risk.
What impact does segmentation have on cyber-insurance premiums?
Insurers now offer 15%-25% premium discounts to organizations with validated segmentation controls, enabling many buyers to recoup project costs within two years of deployment.
Which region will contribute the most incremental revenue by 2031?
Asia-Pacific is expected to deliver the largest absolute revenue growth, supported by a projected 5.31% CAGR and large-scale digital transformation initiatives across manufacturing and financial services.
Page last updated on:


