
Micro Server Market Size and Share
Market Overview
| Study Period | 2020 - 2031 |
|---|---|
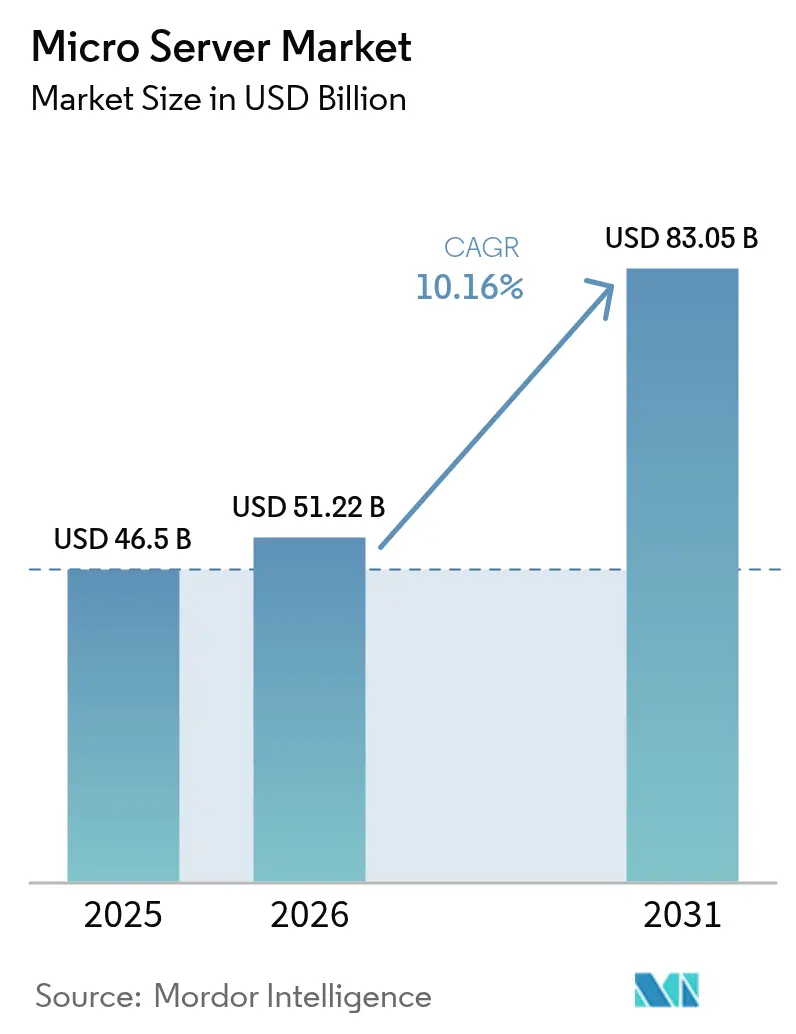
| Market Size (2026) | USD 51.22 Billion |
| Market Size (2031) | USD 83.05 Billion |
| Growth Rate (2026 - 2031) | 10.16 % |
| Fastest Growing Market | Asia Pacific |
| Largest Market | North America |
| Market Concentration | Medium |
Major Players *Disclaimer: Major Players sorted in no particular order Image © Mordor Intelligence. Reuse requires attribution under CC BY 4.0. | |
Micro Server Market Analysis by Mordor Intelligence
The micro server market size is expected to grow from USD 46.50 billion in 2025 to USD 51.22 billion in 2026 and is forecast to reach USD 83.05 billion by 2031 at 10.16% CAGR over 2026-2031. Rapid densification of data-center footprints, demand for low-power compute nodes to support AI inference, and tightening energy-efficiency mandates are the primary tailwinds. Vendor competition spans established x86 server makers, cloud providers designing custom silicon, and new ARM-based entrants that promise higher performance per watt. Hardware continues to dominate procurement budgets, yet managed services grow quickly as enterprises grapple with heterogeneous architectures. Regionally, North America leads on the back of hyperscale investments, while Asia-Pacific shows the fastest expansion because of SME digitalisation and 5G roll-outs.
Key Report Takeaways
- By component, hardware retained 65.02% of the micro server market share in 2025; services are projected to expand at 11.74% CAGR through 2031.
- By form factor, rack (1U–4U) platforms commanded 59.48% of the micro server market size in 2025, whereas modular rugged edge boxes are forecast to grow at 11.35% CAGR.
- By application, cloud computing led with 36.12% revenue share in 2025; data analytics and AI workloads are advancing at 10.55% CAGR to 2031.
- By end-user, large enterprises held 69.05% of the micro server market size in 2025, while SMEs post the highest projected CAGR at 11.98%.
- By geography, North America captured 37.12% revenue in 2025; Asia-Pacific is poised for an 11.03% CAGR to 2031.
Note: Market size and forecast figures in this report are generated using Mordor Intelligence’s proprietary estimation framework, updated with the latest available data and insights as of 2026.
Global Micro Server Market Trends and Insights
Drivers Impact Analysis*
| Driver | (~) % Impact on CAGR Forecast | Geographic Relevance | Impact Timeline |
|---|---|---|---|
| Surge in hyperscale and edge-cloud build-outs | +2.8% | Global, concentrated in North America and Asia-Pacific | Medium term (2-4 years) |
| AI inference workloads require dense, low-power nodes | +2.1% | Global, led by North America and China | Short term (≤ 2 years) |
| SME digitalisation boom in emerging markets | +1.7% | Asia-Pacific, Latin America, Middle East and Africa | Long term (≥ 4 years) |
| Rising edge-computing demand from 5G and IoT roll-outs | +1.4% | Global, early adoption in Asia-Pacific and Europe | Medium term (2-4 years) |
| Data-centre energy-efficiency and carbon-tax mandates | +1.2% | Europe, North America with spillover elsewhere | Long term (≥ 4 years) |
| Reshoring to “trusted” supply chains for defence-grade micro servers | +0.9% | North America, Europe, Australia, Japan | Medium term (2-4 years) |
| Source: Mordor Intelligence | |||
Surge in Hyperscale and Edge-Cloud Build-Outs
Hyperscale operators are standardising factory-integrated, high-density sleds that shorten deployment cycles and improve watt-per-compute metrics. Infrastructure Masons advocates campus-style “clean-energy parks” sized at multi-gigawatt scale, while Lancium plans sites that may reach 6 GW of capacity, illustrating how power availability now guides server architecture choices. Telecommunications companies extend the same logic to metro edge sites, installing micro data centres adjacent to 5G nodes to meet sub-10 millisecond latency targets; ruggedised micro servers allow rapid provisioning without full-scale facilities. Convergence of hyperscale economics with edge proximity therefore cements the micro server market as the preferred platform for balancing density, cost, and power efficiency.
AI Inference Workloads Require Dense, Low-Power Nodes
Inference-oriented traffic now dominates many production AI stacks, pushing server design toward memory bandwidth and accelerator integration over raw CPU frequency. Amazon Web Services’ Graviton 4, built on Arm Neoverse V2, integrates 96 cores and 12-channel DDR5-5600 to keep inference latency within budget while trimming energy draw[1]Amazon Web Services, “Introducing Graviton 4,” aws.amazon.com. Dell’s 4U PowerEdge XE9680L packages eight NVIDIA Blackwell GPUs with direct liquid cooling, delivering high performance per watt inside standard racks. These blueprints underscore an architectural pivot: micro servers must move data efficiently rather than simply compute faster, embedding accelerators that disperse inference workloads across clusters.
SME Digitalisation Boom in Emerging Markets
Asia-Pacific’s micro, small and medium enterprises represent 96.6% of firms and contribute 28% of economic output, creating a large addressable base for affordable compute. OECD surveys show rising adoption of cloud and AI tools, yet skills gaps and upfront cost remain obstacles. Micro server-based infrastructure-as-a-service models lower entry barriers by offering pay-as-you-go capacity in compact form factors that fit into constrained office spaces. MITRE research in South Asia finds post-pandemic acceleration of online sales channels among SMEs, further intensifying demand for scalable, low-maintenance server nodes.
Rising Edge-Computing Demand from 5G and IoT Roll-Outs
Edge workloads such as autonomous driving, smart grids, and tele-medicine require real-time analytics at the network perimeter. Vicor Power projects edge computing to expand at nearly double the growth rate of core cloud services, citing power-efficient edge micro data centres as an enabling layer. Industrial IoT installations pair 5G network slicing with micro servers that dynamically allocate processing to local devices, trimming backhaul traffic and ensuring deterministic latency. European telecom operators already pilot containerised edge stacks in 5G base-station shelters, validating rugged micro server chassis that withstand temperature and vibration extremes.
Restraints Impact Analysis*
| Restraint | (~) % Impact on CAGR Forecast | Geographic Relevance | Impact Timeline |
|---|---|---|---|
| Fragmented form-factor and I/O standards | -1.8% | Global, affecting multi-vendor deployments | Medium term (2-4 years) |
| High software-porting cost from x86 to Arm/RISC-V | -1.3% | Global, influencing enterprise adoption | Short term (≤ 2 years) |
| Export-control uncertainty on advanced processors | -1.1% | Global, concentrated in China and restricted markets | Short term (≤ 2 years) |
| Slow maturity of open-source RISC-V ecosystems | -0.8% | Global, impacting cost-sensitive buyers | Long term (≥ 4 years) |
| Source: Mordor Intelligence | |||
Fragmented Form-Factor and I/O Standards
Despite the Open Compute Project’s M-XIO and Modular Hardware System specifications, variance in power pins, PCIe lanes, and out-of-band interfaces complicates swapping sleds across vendors. Enterprises therefore juggle multiple spares inventories and bespoke management stacks, diluting economies of scale. Lack of plug-and-play interoperability also slows the creation of third-party accelerator modules that could otherwise ride a common backplane. Vendors that pre-certify cross-compatibility or bundle holistic support contracts are better positioned until true standardisation emerges.
High Software-Porting Cost from x86 to Arm/RISC-V
A Journal of Supercomputing meta-study shows Arm generally delivers superior energy efficiency to RISC-V, yet neither guarantees drop-in application portability from x86. MDPI Electronics benchmarked Kubernetes clusters and found Arm outperforms contemporary RISC-V cores in memory throughput and multithread scaling, although RISC-V’s open ISA enables future customisation. Re-compilation, regression testing, and performance tuning consume engineering hours that many mid-tier enterprises cannot spare. Until toolchains, SDKs, and container images mature, x86 inertia will persist in portions of the micro server industry.
*Our forecasts treat driver/restraint impacts as directional, not additive. The impact forecasts reflect baseline growth, mix effects, and variable interactions.
Segment Analysis
By Component: Services Scale Despite Hardware Dominance
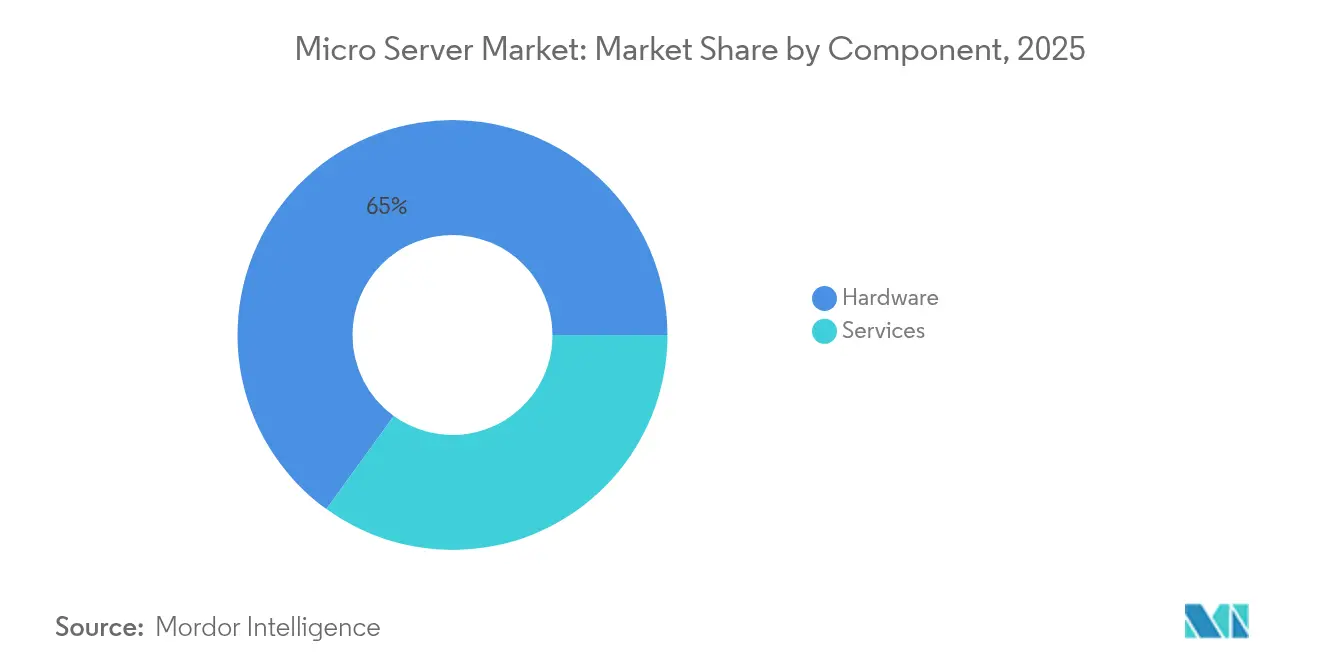
The micro server market size by component reached USD 30.23 billion for hardware in 2025, equivalent to 65.02% share, confirming capital-intensive refresh cycles within hyperscale and edge facilities. Services followed at USD 16.27 billion but will expand at 11.74% CAGR through 2031, reflecting enterprise reliance on managed infrastructure to tame architectural heterogeneity. Much of the spend funneled into design-for-AI racks, liquid cooling retrofits, and remote fleet orchestration.
Hardware revenue is anchored by continued shipments of dense 1U twin-node sleds and 4U GPU trays that integrate Arm, x86, and custom ASICs. Dell shipped USD 2.9 billion in AI-optimised servers during 2025 Q1, a single-vendor signal of the hardware cycle’s strength. Services growth stems from demand for remote BIOS provisioning, container orchestration, and lifecycle security patching—tasks that multicloud teams increasingly outsource. Vendors that wrap consulting, firmware customisation, and 24-hour support around micro server fleets capture sticky annuity streams, cushioning volatility in capital budgets.



By Form Factor: Edge Boxes Challenge Rack Supremacy
Rack units between 1U and 4U captured 59.48% of micro server market share in 2025, owing to their fit with existing aisle layouts and standardised power feeds. However, rugged edge boxes are on track for an 11.35% CAGR, far outpacing legacy chassis as telecom and industrial players push compute to constrained sites. Many designs adopt front-serviceable soaked-plate cooling and ¬-48 V DC inputs, aligning with outdoor 5G cabinets.
The micro server market size for modular boxes will rise as OEMs pre-integrate networking, AI accelerators, and battery backup into shoebox-scale enclosures. Vicor-backed reference designs show 35% lower energy use per inference operation compared with typical rack nodes, attractive where grid capacity is scarce. Meanwhile, multi-node microcloud sleds strike a balance, fitting eight single-socket boards into a 3U frame to boost rack density without sacrificing serviceability.
By Application: AI Analytics Reshape Cloud Compute
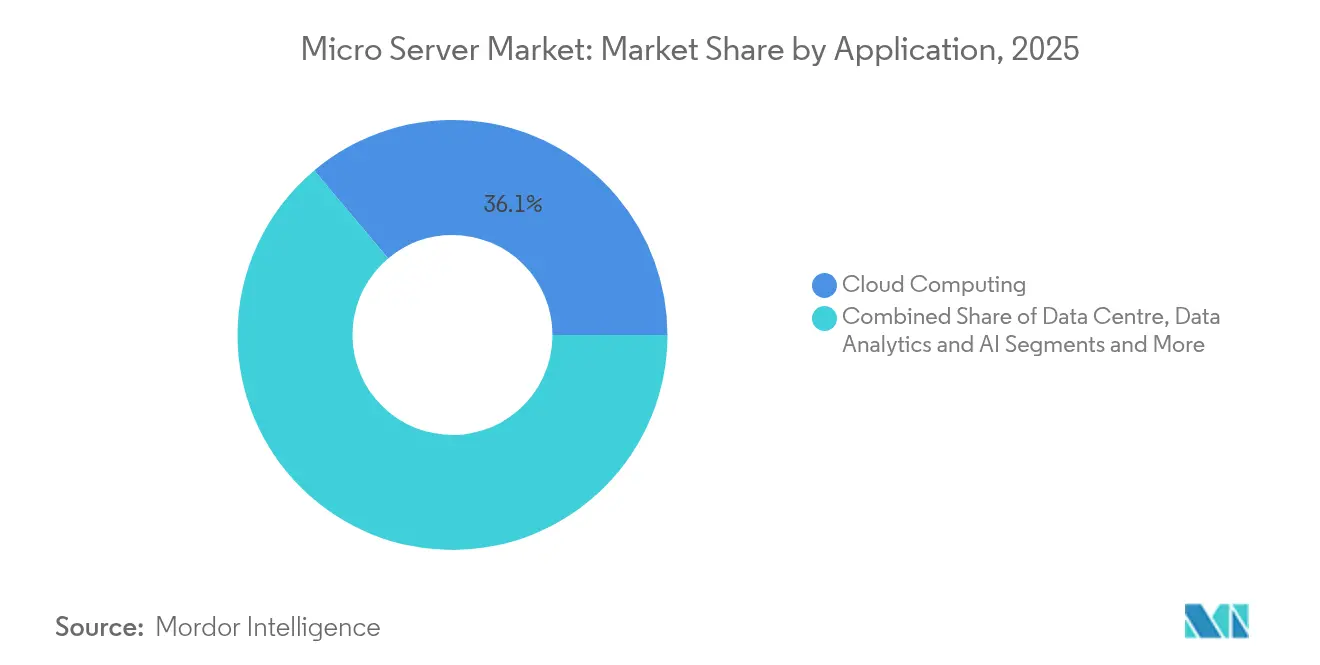
Cloud computing workloads represented USD 16.79 billion in revenue, equal to 36.12% of the micro server market size during 2025, as hyperscalers pivot toward containerised PaaS offerings built on dense Arm silicon. Data analytics and AI, though smaller today, will grow at 10.55% CAGR, eventually narrowing the gap as inference traffic multiplies.
AWS’s Graviton 4 underscores this momentum: its 96-core layout paired with DDR5-5600 memory hits the sweet spot for memory-bound inference, boosting tenant density per rack while curbing power bills. Media streaming, CDN edge caches, and IoT sensor fusion clusters round out the mix, yet all share a common demand for low-latency processing closer to users. Vendors that bundle AI accelerators and advanced NICs into micro servers are primed to win upcoming refreshes.
By End-User: SMEs Erode Enterprise Monopoly
Large enterprises still occupied 69.05% of the micro server market in 2025, reflecting global rollouts of hybrid-cloud stacks spanning core and edge. These buyers negotiate multi-year hardware roadmaps, insisting on trusted-supply-chain assurances that favour established brands.
Conversely, SMEs will post a 11.98% CAGR to 2031, unlocking fresh volume for white-label and ODM players. The Asian Development Bank highlights that MSMEs constitute 96.6% of businesses region-wide, a demographic poised to leapfrog to service-based micro server deployments. Managed-hosting firms distil complex infrastructure into subscription bundles, letting SMEs deploy ERP, e-commerce, and analytics platforms without in-house administrators.
Geography Analysis
North America generated USD 17.26 billion of revenue in 2025, equal to 37.12% of the micro server market, thanks to heavy hyperscale capex and government preference for defence-grade domestic supply chains. The Georgia Public Service Commission now obliges large-load customers to shoulder upfront grid-upgrade costs, nudging data-centre operators toward more energy-efficient micro server nodes. Federal export controls on AI accelerators further incentivise U.S.-based assembly and testing, solidifying local value retention.
Europe follows, propelled by stringent energy-efficiency and cyber-resilience laws. The updated Energy Efficiency Directive mandates annual reporting for data-centre sites above 100 kW IT load, while the Digital Operational Resilience Act compels financial firms to bolster uptime and security. These rules elevate demand for micro servers that deliver higher compute per kilowatt, aiding operators in meeting power-usage-effectiveness targets without new grid connections.
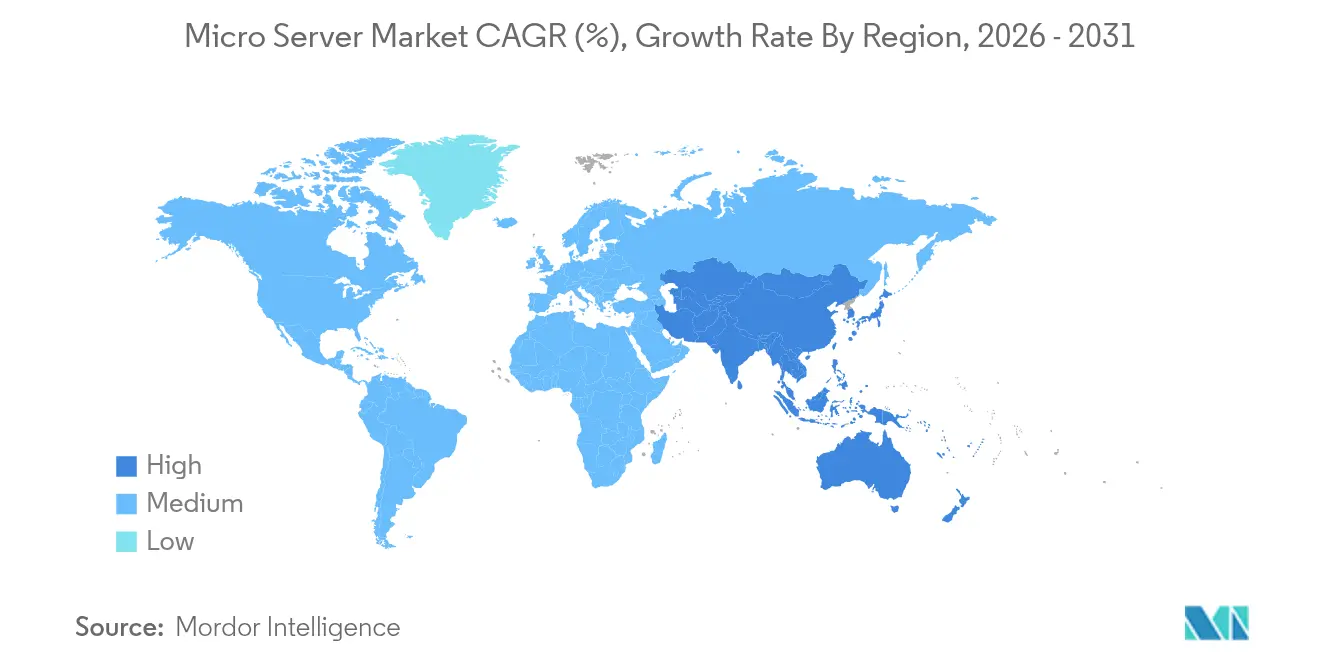
Asia-Pacific is the fastest-growing territory, forecast at 11.03% CAGR, as 5G densification and SME cloud adoption converge. Compal Electronics and Kalyani Group signed an MoU to manufacture servers in India, aligning with “Make in India” incentives aimed at localising the compute value chain. Governments across ASEAN and South Asia promote domestically hosted data to spur digital services GDP contributions, paving the way for region-specific micro server designs optimised for humid climates and limited utility power.

Regulatory Landscape
Energy-efficiency and data-center reporting rules are increasingly shaping micro server design and procurement. In the European Union, Regulation (EU) 2019/424 (Ecodesign requirements for servers and data storage products) underpins market-access expectations, while the Energy Efficiency Directive update (Directive (EU) 2023/1791) is being transposed into national reporting obligations for data centers above defined IT-load thresholds. This is raising the importance of measurable performance and power management at the node level.
Trade controls and telecom equipment conformity regimes also influence platform roadmaps and supply chains. In January 2026, the US Bureau of Industry and Security revised license review policy for exports of advanced computing commodities to China and Macau, reinforcing export-control uncertainty for advanced processors used in dense micro server configurations. China implemented GB 28380-2025 in February 2026, updating minimum energy-efficiency values and energy grades for microcomputers, while the UAE Telecommunications and Digital Government Regulatory Authority issued Decision No. 3/2026 to modernize type-approval requirements for network infrastructure equipment, adding more compliance touchpoints for edge-oriented micro server deployments in regulated telecom environments.
Value Chain Analysis
The micro server value chain covers CPU/GPU and accelerator silicon, memory and storage, boards and chassis, system integration (including liquid cooling and high-speed interconnect), firmware and management software, and then distribution through OEMs, ODMs/EMS, cloud providers, and channel partners to data centers and edge sites. Open hardware initiatives, including Open Compute Project modular specifications, influence upstream design choices by encouraging interchangeable sleds, backplanes, and serviceability features, while heterogeneous compute requirements raise design complexity around accelerators, NICs, and power delivery.
Manufacturing and fulfillment remain structurally dependent on East and Southeast Asia for leading-edge semiconductors and server assembly. Taiwanese EMS providers (including Foxconn, Wistron, Wiwynn, Quanta, Inventec, and Mitac) support high-volume builds, while North American deliveries often involve cross-border final assembly and logistics (including Mexico) to manage lead times and trade exposure. Distribution and component availability also act as recurring bottlenecks; for example, in July 2025 WPG Holdings announced an organizational revamp aimed at mitigating global distribution constraints, reflecting how allocator capacity, advanced-node supply tightness, and shifting tariff regimes can quickly filter into server bill-of-materials costs and delivery schedules.
Competitive Landscape
Vendor rivalry spans classic server incumbents and silicon-first disruptors, yielding a moderately fragmented field. Dell, HPE, and Lenovo continue to bundle secure supply-chain certifications and global service networks, winning complex enterprise bids. Dell’s AI Factory partnership with NVIDIA boosted its standing in GPU-accelerated racks, illustrating how incumbents can pivot swiftly when IP partnerships align.
In parallel, SoftBank’s USD 6.5 billion acquisition of Ampere Computing signals a vertical-integration strategy that couples Arm Neoverse cores with cloud hosting assets. AMD’s USD 400 million purchase of ZT Systems adds design-for-AI systems expertise, positioning AMD to offer turnkey platforms around EPYC CPUs and Instinct accelerators. Such deals highlight a race to own both silicon and system IP, shortening time-to-market for tailored micro server SKUs.
Start-ups focus on ruggedised edge boxes and high-bandwidth-memory AI inference cards. Open Compute Project initiatives, like M-XIO, catalyse limited collaboration; however, participants still ship proprietary extensions, keeping differentiation alive. Buyers, therefore, weigh interoperability, total cost of ownership, and ecosystem maturity when selecting micro server roadmaps.
Micro Server Industry Leaders
Fujitsu Ltd
Cisco Systems
AWS (Graviton)
Intel
Nvidia
- *Disclaimer: Major Players sorted in no particular order


Market Opportunities and Future Outlook
White space is forming around standardized, modular micro server platforms that can be deployed consistently across hyperscale, enterprise, and edge sites, while reducing bespoke engineering. Open Compute Project specifications such as DC-MHS and open edge server design guidance provide a basis for vendor-neutral component reuse, which creates opportunities for OEMs/ODMs and solution providers that package interoperable chassis, management layers, and validated accelerator options for multi-vendor fleets.
Dense, low-power compute for AI inference at the edge is also broadening the product envelope beyond traditional rack-only deployments. In March 2026, Arm introduced the AGI CPU as a production-ready server silicon option with up to 136 Arm Neoverse V3 cores and PCIe Gen6 within a 300W envelope, supporting higher core density per node for cloud and inference-heavy micro server designs. In June 2026, Supermicro announced liquid-cooled and short-depth Arm-based server systems optimized for distributed AI inference and edge deployments, aligning with micro data center build-outs where power and cooling limits (often discussed in the 20-40 kW per rack range) and ASHRAE TC 9.9-aligned operating envelopes favor compact form factors, simplified serviceability, and higher performance per watt.
Recent Industry Developments
- June 2026: AWS announced general availability of Amazon EC2 C9g and C9gd instances powered by AWS Graviton5 processors. The release expands Arm-based compute options for real-time and scale-out workloads, reinforcing a cloud-to-edge software ecosystem that supports micro server adoption across heterogeneous architectures.
- November 2025: Cisco debuted its Unified Edge Platform, centered on the UCS XE9305 3U modular chassis for distributed AI inferencing and agentic workloads. The modular edge-first design focuses on constrained sites outside traditional data centers, strengthening demand for compact, ruggedized micro server-class systems with simplified lifecycle management.
- March 2025: SoftBank Group finalized its acquisition of Ampere Computing. The deal tightens vertical integration around Arm server CPUs and increases competitive pressure on x86-centric roadmaps in dense, power-efficient micro server deployments.


Research Methodology Framework and Report Scope
Market Definition and Coverage
This market covers the revenue generated from selling micro servers and closely related services, where compact server nodes are used for workloads like web serving, light compute, storage, and edge processing in data centers and distributed sites.
Scope exclusions: We exclude general-purpose enterprise servers that do not meet micro server form-factor and low-power design intent, along with unrelated data center services that are not directly tied to micro server deployments.
Segmentation Overview
- By Component
- Hardware
- Services
- By Form Factor
- Rack (1U-4U)
- Multi-node Microcloud
- Modular Rugged Edge Box
- By Application
- Data Centre
- Cloud Computing
- Media / Content Storage
- Data Analytics and AI
- IoT / Industrial Edge
- By End-User
- Large Enterprises
- Small and Medium Enterprises (SMEs)
- By Geography
- North America
- United States
- Canada
- Mexico
- Europe
- Germany
- United Kingdom
- France
- Italy
- Spain
- Rest of Europe
- Asia-Pacific
- China
- Japan
- India
- South Korea
- Australia
- Rest of Asia-Pacific
- South America
- Brazil
- Argentina
- Rest of South America
- Middle East and Africa
- Middle East
- Saudi Arabia
- United Arab Emirates
- Turkey
- Rest of Middle East
- Africa
- South Africa
- Egypt
- Nigeria
- Rest of Africa
- Middle East
- North America
Data Sources, Market Sizing, and Validation
Desk Research
For the starting structure of the model, we leaned on public data that helps explain demand for small-footprint compute and shipment flows. Sources used include items such as International Telecommunication Union indicators, International Energy Agency data on power and efficiency themes, OECD digital economy statistics, US International Trade Commission trade data, and IEEE or similar peer-reviewed publications that discuss server architectures and power profiles.
Beyond that, we reviewed company filings, investor presentations, product documentation, and credible press to map typical configurations, pricing bands, and where these systems are first adopted. A paid subscription focused on company financials and intelligence was used selectively to standardize revenue splits when public reporting was incomplete, and a patent database was checked to validate directionally where design activity is concentrated. These desk sources are not exhaustive, and many other public references were also used for cross-checks, clarification, and validation.
Primary Interviews and Surveys
Primary work was used to pressure-test the sizing logic and remove gaps that desk research does not show clearly, especially around what buyers classify as micro servers versus adjacent low-end servers. We spoke with a mix of hardware suppliers, integrators, and large end users, and we checked inputs across major regions so the assumptions held up against different procurement and deployment patterns.
Distribution of primary research fieldwork respondents
| Company type | Respondent position | Region |
|---|---|---|
| Top tier: 29% | CXOs: 14% | APAC: 45% |
| Mid tier: 53% | Functional/Unit leaders: 29% | EMEA: 31% |
| Smaller Players: 18% | Managers: 57% | Americas: 24% |
Market-Sizing & Forecasting
Sizing was built using a top-down approach once, where data center and edge compute demand indicators were reconstructed into a realistic addressable pool for micro servers, and then converted into value using observed configuration and pricing bands. To keep the totals grounded, the outputs were corroborated with selective bottom-up approximations, such as sampling shipment-like volumes from public signals, applying typical ASP ranges by form factor, and sanity-checking against supplier revenue commentary.
Key inputs that informed the model included data center footprint expansion, edge computing rollouts (including 5G-related deployment momentum), average node power and density targets, workload mix shifts toward lighter distributed compute, and expected hardware-to-services attach rates. When bottom-up signals were missing for a country or a niche application, gaps were handled using proxy adoption rates from similar markets, followed by interview-based adjustments.
For forecasting, scenario analysis was used so that pricing progression and adoption speed could be tuned based on what experts expect for energy efficiency requirements, enterprise refresh cycles, and cloud-edge architecture shifts. Assumptions were kept simple enough to be repeated, and each scenario was tied back to the same observable demand indicators.
Data Validation & Update Cycle
Model outputs were checked against independent market signals, including data center build activity, stated efficiency targets, and the pace of edge deployments, before the numbers were finalized. If a region showed an unusual jump or drop, the drivers were re-reviewed, and follow-up outreach was triggered to confirm whether it was pricing, mix shift, or timing.
A multi-step internal review is followed so inputs, formulas, and conversion factors are consistent across segments and geographies. Reports are refreshed annually, and interim updates are made when material events occur that can change deployment or pricing assumptions. Before delivery, a final freshness pass is completed so clients receive the latest updated view.
Mordor Intelligence's Micro Server Market Size Measured Against Other Published Estimates
Published market sizes for micro servers often look far apart because the market label is used differently across sources, and because pricing and deployment assumptions are not always aligned to what buyers procure in practice.
General-purpose enterprise servers that do not follow micro server design intent sit outside Mordor Intelligence's scope, and that single exclusion often explains why some published totals appear materially larger even when the growth direction looks similar.
Benchmark comparison
| Source | Market Size | Gaps in Research Methodology |
|---|---|---|
| Mordor Intelligence | USD 51.22 B (2026) | |
| Industry Analytics Firm A | USD 8.50 B (2024) | Uses a narrower revenue capture that appears to focus on microserver-only configurations, and the base year is earlier, which can understate the market if newer edge deployments are not fully counted. |
| Market Statistics Portal B | USD 2.80 B (2023) | Reported value is tied to a limited set of tracked revenue lines and a shorter forecast window, and it may exclude services and some form factors that are counted when systems are deployed as microcloud or rugged edge nodes. |
The spread in the table mainly comes from scope cutoffs and how unit pricing and form-factor coverage are handled across sources. By keeping the model traceable to demand signals, configuration mix, and repeatable conversion steps, the final estimate stays easier to audit and update when new deployment and pricing evidence appears.


Key Questions Answered in the Report
What is the current size of the micro server market?
The micro server market size stands at USD 51.22 billion in 2026 and is projected to reach USD 83.05 billion by 2031.
Which segment is growing fastest within the micro server market?
Services lead with an 11.74% CAGR through 2031, reflecting enterprise adoption of managed micro-server infrastructure.
Why are rugged edge boxes gaining popularity?
Edge deployments linked to 5G and IoT need compact, hardened enclosures; rugged edge boxes are forecast to grow at 11.35% CAGR as they meet these requirements.
How do export controls influence the micro server industry?
New U.S. rules on advanced processors restrict shipments to certain countries, prompting vendors to adjust supply chains and product roadmaps.
Which region offers the highest growth potential?
Asia-Pacific shows the fastest trajectory at 11.03% CAGR, driven by SME digitalisation and local manufacturing initiatives.
Page last updated on:





