Microbial Fuel Cell Market Size and Share
Market Overview
| Study Period | 2020 - 2030 |
|---|---|
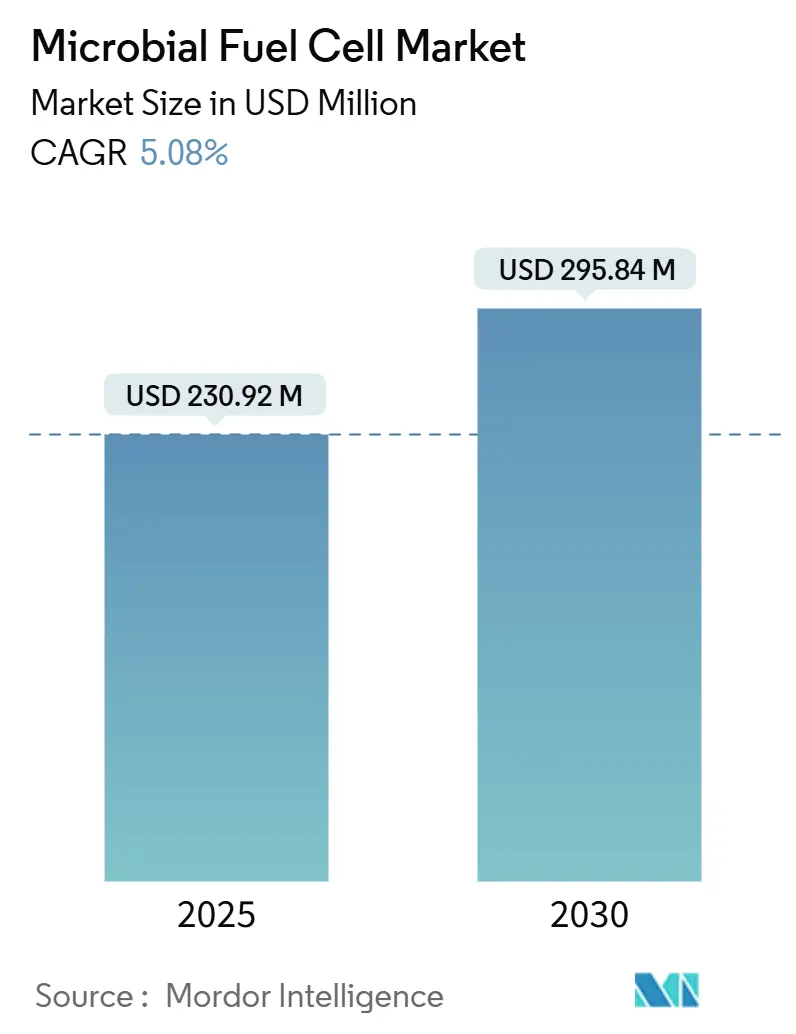
| Market Size (2025) | USD 230.92 Million |
| Market Size (2030) | USD 295.84 Million |
| Growth Rate (2025 - 2030) | 5.08% CAGR |
| Fastest Growing Market | Asia Pacific |
| Largest Market | Asia Pacific |
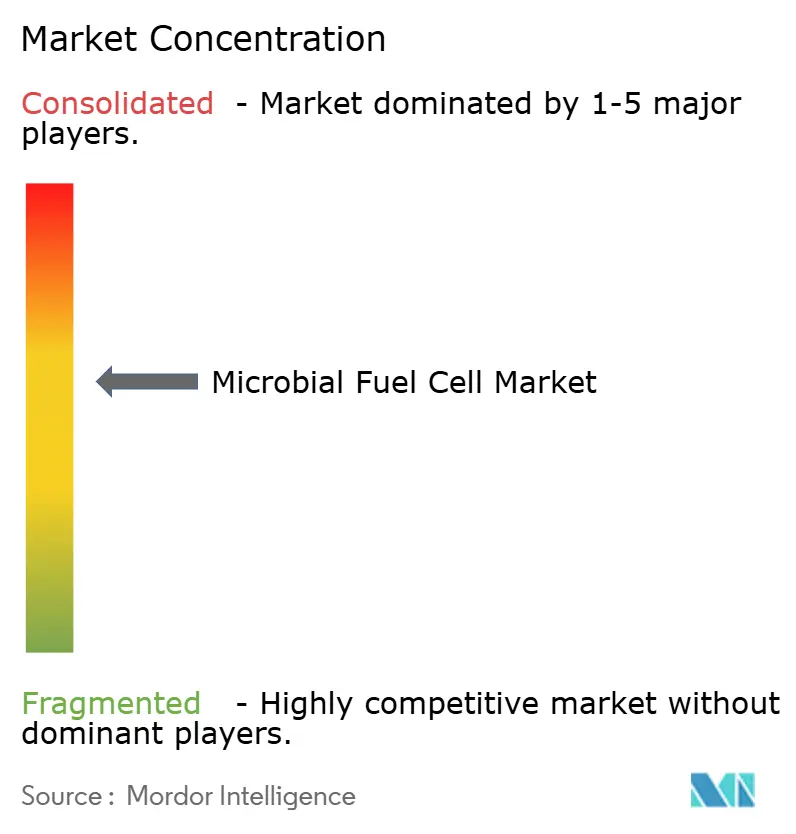
| Market Concentration | Medium |
Major Players *Disclaimer: Major Players sorted in no particular order Image © Mordor Intelligence. Reuse requires attribution under CC BY 4.0. | |
Microbial Fuel Cell Market Analysis by Mordor Intelligence
The Microbial Fuel Cell Market size is estimated at USD 230.92 million in 2025, and is expected to reach USD 295.84 million by 2030, at a CAGR of 5.08% during the forecast period (2025-2030).
Ongoing cost declines in graphene electrodes, rising regulatory pressure on nutrient discharge, and a growing pipeline of pilot projects sustain investor confidence in technology scale-up. Industry participants see a clear opportunity to monetize high-COD effluents while trimming compliance overheads, which keeps industrial and municipal prospects engaged despite the technology’s early-stage nature. Competitive dynamics remain fluid because water treatment incumbents, defense contractors, and nanomaterial start-ups pursue distinct technology roadmaps. Near-term adoption hinges on power density gains and stackable reactor designs, while mid-term uptake will depend on cost-effective PGM-free catalysts and modular contracting frameworks that mitigate capital risk for end users.
Key Report Takeaways
- By type, mediator-free systems led with 60.9% revenue share in 2024; mediator-based variants are projected to expand at a 5.6% CAGR through 2030.
- By design, single-chamber configurations accounted for 59.8% of the microbial fuel cell market share in 2024, whereas stackable modular designs are climbing at an 8.5% CAGR to 2030.
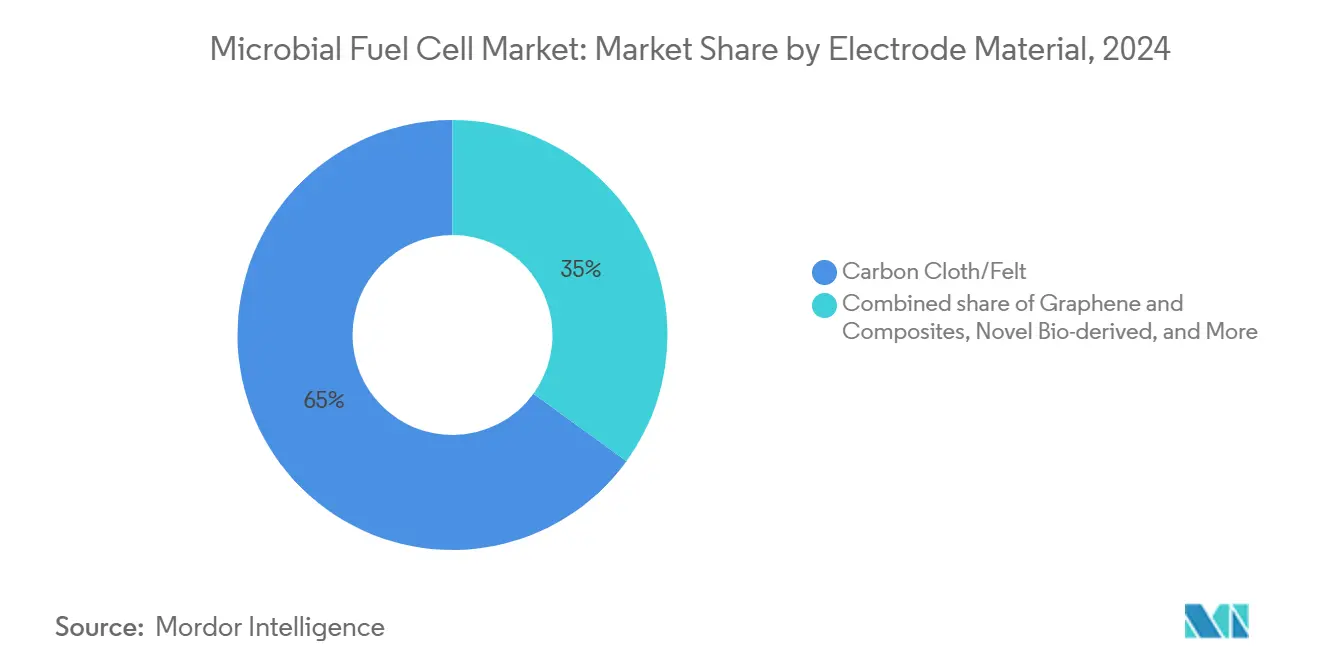
- By electrode material, carbon cloth and felt commanded 65% share of the microbial fuel cell market size in 2024; graphene composites are advancing at a 6.2% CAGR over the forecast period.
- By substrate source, municipal wastewater and industrial effluents held a 75% share in 2024 and are forecast to grow at a 5.4% CAGR to 2030.
- By application, wastewater treatment and energy recovery contributed 57.5% revenue share in 2024, while biosensors and environmental monitoring are pacing at a 7.3% CAGR.
- By end user, industrial facilities secured 50.6% of the 2024 market, whereas research institutions are rising at a 7.7% CAGR through 2030.
- By geography, Asia-Pacific accounted for the largest share, 45.1% in 2024, and is also likely to grow the fastest, at a CAGR of 6.9% through 2030.
Global Microbial Fuel Cell Market Trends and Insights
Drivers Impact Analysis*
| Driver | (~) % Impact on CAGR Forecast | Geographic Relevance | Impact Timeline |
|---|---|---|---|
| R&D funding surge post-2025 | +1.2% | North America & EU | Medium term (2-4 years) |
| Tightening global wastewater-discharge norms | +0.9% | EU & North America first, global later | Long term (≥ 4 years) |
| Demand for off-grid micro-power sensors | +0.7% | APAC core, spill-over to North America | Short term (≤ 2 years) |
| ESCO contracts for effluent-to-power in F&B plants | +0.5% | North America & EU, moving to APAC | Medium term (2-4 years) |
| Falling graphene-anode prices from China | +0.8% | Global; manufacturing base in APAC | Short term (≤ 2 years) |
| Defence grants for self-powered remote biosensors | +0.4% | North America & EU defense sectors | Medium term (2-4 years) |
| Source: Mordor Intelligence | |||
R&D Funding Surge Post-2025
Robust federal and multilateral grant programs channel resources to microbial fuel cell laboratories worldwide, including the U.S. Department of Energy’s USD 46 million hydrogen and fuel-cell call.(1)Source: U.S. Department of Energy, “DOE Announces up to USD 46 Million to Advance Hydrogen and Fuel Cell Technologies,” energy.gov These funds accelerate electrode material discovery, microbial community engineering, and stack integration trials that address lingering power density gaps. Universities coordinate translational projects with utilities to validate pilot rigs on real wastewater, compressing proof-of-concept timelines. Parallel EU initiatives under Horizon Europe earmark funds for circular-economy water projects, anchoring collaborative test beds in Germany, Spain, and the Netherlands. Therefore, the convergence of academic expertise and utility-scale pilots underwrites a rapid feedback loop that speeds commercial readiness.
Tightening Global Wastewater-Discharge Norms
The European Union’s Directive 2024/3019 obliges municipal plants to recover energy from wastewater, explicitly referencing bioelectrochemical solutions.(2)Source: European Parliament and Council, “Directive 2024/3019,” eur-lex.europa.eu Similar provisions in revised Canadian effluent rules grant transitional approvals to facilities installing advanced treatment units.(3)Source: Government of Canada, “Regulations Amending the Wastewater Systems Effluent Regulations,” canadagazette.gc.ca These mandates establish a predictable compliance pathway for operators that select microbial fuel cell reactors, since simultaneous COD removal and electricity output help offset penalty fees. Regulatory certainty also influences lender risk models, allowing project-finance structures to carry longer tenors that reduce annual debt service and broaden adoption potential across mid-tier municipalities.
Demand for Off-Grid Micro-Power Sensors
Agricultural, environmental, and defense entities seek autonomous sensor grids operating for years without battery swaps. Field trials in Japanese citrus orchards and U.S. row-crop farms show soil microbial fuel cells generating stable power far beyond sensor draw. Integration with low-power IoT chipsets slashes maintenance site visits, a critical benefit where labor shortages or security risks complicate battery replacement. Given the segment’s modest power requirement, current power densities suffice, enabling immediate revenue generation while larger wastewater applications mature.
Falling Graphene-Anode Prices from China
Chinese roll-to-roll synthesis lines have trimmed graphene sheet costs by double-digit percentages each year since 2022, making high-surface-area anodes economically viable for industrial-scale stacks. Pilot rigs fitted with graphene-nickel composites report 3–4 × higher current outputs than carbon cloth while holding material cost within budget envelopes. Broader supply availability also spurs aftermarket retrofits, where operators replace spent electrodes to lift reactor yields without rebuilding tanks, shortening payback periods and helping the microbial fuel cell market penetrate conservative utility budgets.
Restraints Impact Analysis*
| Restraint | (~) % Impact on CAGR Forecast | Geographic Relevance | Impact Timeline |
|---|---|---|---|
| Low power density versus alternatives | -1.1% | Global, large-scale applications most affected | Long term (≥ 4 years) |
| High capex vs. conventional treatment | -0.8% | Global, sharper in cost-sensitive markets | Medium term (2-4 years) |
| Cathode bio-fouling in saline waste streams | -0.6% | Coastal and high-salinity industrial regions | Short term (≤ 2 years) |
| Limited life of PGM-free catalysts | -0.4% | Global, impeding low-cost scale-up | Medium term (2-4 years) |
| Source: Mordor Intelligence | |||
Low Power Density Versus Alternatives
Average industrial-scale prototypes rarely exceed 200 mW/m², which limits addressable loads to sensing and supplemental energy recovery. As reactor footprints grow, internal resistance and bio-fouling depress performance, creating a mismatch between land constraints and output expectations. Researchers target hierarchical porous structures and synthetic consortia to raise electron transfer rates, but commercial tipping points will likely require at least a 3-fold jump. Until then, power economics restricts adoption to niche zones where heat, solar, or grid power are infeasible.
High Capex vs. Conventional Treatment
Specialized membranes, precision-machined current collectors, and automated monitoring systems swell upfront budgets relative to activated-sludge baselines. Even though operating expenses fall thanks to energy recovery, many privately financed plants balk at 8-to-10-year payback horizons. ESCO contracts that bundle financing and performance guarantees partially bridge this gap, yet broad cost parity still hinges on cheaper catalyst inks and membrane-less designs that hold effluent quality constant. Scaling electrode fabrication remains the largest lever to close the investment delta and unlock higher microbial fuel cell market volumes.
*Our forecasts treat driver/restraint impacts as directional, not additive. The impact forecasts reflect baseline growth, mix effects, and variable interactions.
Segment Analysis
By Type: Mediator-Free Systems Maintain Leadership
Mediator-free architectures delivered 60.9% of 2024 revenue, equal to USD 133.5 million of the microbial fuel cell market size, thanks to direct electron transfer that eliminates costly redox chemicals. These reactors appeal to operators prioritizing simple maintenance schedules and low consumables inventory. Growth will follow improvements in biofilm management and surface functionalization that further elevate coulombic efficiencies. Simultaneously, the mediator-based cohort, valued at USD 86.7 million, offers upside because next-generation polymeric mediators withstand higher current densities without toxicity drift, supporting a 5.6% CAGR.
The microbial fuel cell market benefits from this two-track evolution because risk-averse users select proven mediator-free rigs, whereas performance-oriented labs trial mediator-enhanced stacks to breach higher power ceilings. Technology vendors, therefore, hedge portfolios across both styles, ensuring continuing knowledge transfer between segments and preserving revenue resilience against unforeseen performance setbacks.


By Design: Modular Configurations Drive Deployment Flexibility
Single-chamber reactors captured 59.8% of revenue in 2024 by offering plug-and-play installation and minimal gasket management, translating to lower downtime in harsh industrial settings. Yet the modular stack format, presently only USD 29.4 million, is accelerating at an 8.5% CAGR as utilities demand scalable blocks that match fluctuating influent loads without civil-works overhauls. This design also mitigates channel clogging risk by isolating failure to one cassette, protecting plant uptime.
Manufacturers now pre-assemble stackable skid units in ISO-container footprints, enabling rapid brownfield retrofits and providing a migration path for plants to expand capacity in 50 kW increments. With several municipal bids specifying modularity as a tender criterion, the microbial fuel cell market base broadens from niche pilots to mainstream procurement checklists.
By Electrode Material: Graphene Composites Accelerate Adoption
Conventional carbon cloth remains the workhorse, anchoring 65% of segment turnover, but graphene composites delivered the highest momentum with a 6.2% CAGR. Power densities above 3,900 mW/m² under lab conditions underscore the headroom available once mass-manufacturing sites in Jiangsu and Guangdong fully ramp production.(4)Source: Wei Zhang et al., “Porous Graphene/Nickel Anode Boosts Performance,” rsc.org The microbial fuel cell market share shift toward graphene parallels falling cost curves that now bring composite anodes within 15% of carbon cloth on a cost-per-watt basis.
Hybrid electrodes blending bio-derived carbons, such as pumpkin-tissue porous foams, further diversify sourcing and reduce ESG risk exposure.(5)Source: Jiaxin Liu et al., “Pumpkin Tissue-Derived Biocarbon Anodes,” mdpi.com As carbon-neutral procurement policies gain force across public tenders, these sustainable electrodes help bidders secure scoring advantages, catalyzing broader adoption across water boards and industrial exporters facing stringent scope-3 reporting.
By Substrate Source: Industrial Effluents Anchor Revenue
Processing of municipal and industrial waste streams produced 75% of 2024 sales, equal to USD 164.4 million of the microbial fuel cell market size, since high-COD liquids offer strong electron donor availability for bio-anodes. Distillery, food-processing, and pulp-and-paper sites recognize that incremental energy recovery boosts corporate sustainability metrics while shrinking sludge disposal volumes.(6)Source: Hanish Mohammed, “Distillery Effluent in Microbial Fuel Cells,” waset.org This dual value proposition secures budget sign-off in tight CapEx cycles.
Agricultural run-off and marine sediment use cases remain smaller but strategic. They demonstrate the technology’s ability to function where grid access is sporadic and conventional treatment is nonexistent. As agritech IoT penetration expands, small-footprint reactors will embed directly in irrigation channels, providing water polishing and sensor power, thereby funneling new demand channels into the microbial fuel cell market.
By Application: Biosensors Deliver the Fastest Upside
Wastewater treatment and cogeneration still dominate, accounting for 57.5% of 2024 turnover. Yet biosensors and environmental monitoring post the briskest 7.3% CAGR because they sidestep power-density bottlenecks. Field deployments prove that 68-plus power-to-load ratios enable indefinite sensor autonomy even under arid conditions. Defense agencies likewise test covert river-monitoring kits that detect chemical threats without revealing power signatures.
These developments reinforce the narrative that early commercial value lies where micro-watt loads suffice. Each success story in sensor grids builds operator confidence and familiarizes engineering teams with the technology, smoothing the path for larger reactors once power outputs climb, thus setting a demand-stack foundation for the broader microbial fuel cell market.

By End User: Research Institutions Cultivate the Pipeline
Industrial buyers still generated 50.6% of revenue in 2024, leveraging co-digestion synergies and regulatory credits. However, research institutions are expanding expenditure at a 7.7% CAGR, reaching USD 36.8 million by 2030, because national labs and universities secure earmarked budgets to transition lab discoveries into pre-commercial demonstrators. Their pilot rigs validate novel biofilms and membranes under controlled conditions, de-risking future industrial roll-outs.
Steady cross-licensing between academia and start-ups accelerates IP monetization and aligns prototype roadmaps with commercial operator requirements. This feedback enriches public-private consortia and concentrates resources on breakthroughs that directly influence the microbial fuel cell market growth curve rather than diffuse academic curiosities.
Geography Analysis
Asia-Pacific commanded 45.1% of 2024 revenue and is advancing at a 6.9% CAGR, powered by China’s graphene supply chain, India’s low-cost earthen-pot prototypes, and Japan’s agricultural sensor pilots. Regional industrial wastewater volume and policy mandates for carbon neutrality create sustained project pipelines despite currency fluctuations. Therefore, the microbial fuel cell market enjoys both demand-side pull and cost-side push in the zone that houses much of the world’s electronics assembly and food-processing capacity.
North America follows, buoyed by Department of Energy funding streams, defense pilot programs, and a robust venture-capital ecosystem that nurtures bioelectrochemical start-ups. Environmental NGOs increasingly pressure utilities to upgrade aging plants, and microbial fuel cell stacks offer a pathway to meet renewable-energy procurement targets while complying with discharge caps. Canadian effluent-rule amendments provide transitional permit relief, further greasing deployment rails for early movers.
Thanks to Directive 2024/3019, Europe remains technology-forward, which embeds energy-positive treatment as a legal obligation. Utilities in Germany, France, and the Nordics run pre-commercial pilots integrating MFC modules with anaerobic digesters, thereby widening the microbial fuel cell market’s reference base. Although regional capex is higher, green debt instruments and ESG-linked bonds lower financing costs, offsetting initial expenditure gaps relative to Asian builds.


Competitive Landscape
Competitive intensity stays fragmented because a single architecture has yet to emerge as the dominant standard. Water sector incumbents such as Fluence integrate microbial fuel cell modules into turnkey treatment skids, leveraging established maintenance networks to reassure operators. Meanwhile, specialists like Aquacycl market containerized units on a “pay-as-you-treat” model that bundles performance guarantees with service contracts, a structure that resonates with budget-constrained SMEs.
Nanomaterial suppliers carve value by licensing graphene-coating recipes and supplying slurry-coated felts that deliver predictable electrochemical characteristics. Defense integrators collaborate with university labs to harden units for harsh environments, securing early high-margin orders that subsidize R&D. Patent data indicate a tilt toward electrode innovations and modular flow-field designs, signaling that differentiation in the microbial fuel cell market hinges more on materials science than on bulk civil engineering.
M&A chatter focuses on converging anaerobic digestion and microbial fuel cell portfolios to create hybrid offerings capable of producing methane and electricity in one plant. Any eventual consolidation will likely revolve around firms that own proprietary high-surface-area electrodes, given their outsized influence on cost curves and performance ceilings.
Microbial Fuel Cell Industry Leaders
Cambrian Innovation
Fluence Corporation
Aquacycl
MICROrganic Technologies
Emefcy (legacy)
- *Disclaimer: Major Players sorted in no particular order

Recent Industry Developments
- March 2025: FuelCell Energy and Malaysia Marine and Heavy Engineering initiated a feasibility study for a low-carbon fuel complex in Malaysia that will integrate microbial fuel cell electrolyzers.
- October 2024: Tokyo University of Agriculture and Technology began soil-cell trials in citrus groves with Shikoku Electric Power, powering cameras and sensors.
- August 2024: Backed by DASA, Wastewater Fuels tested a microbial electrolysis cell converting sewage organics to hydrogen at Severn Trent Water’s site.
- April 2024: FuelCell Energy’s carbonate stack was chosen for the Sacramento Area Sewer District’s 2.8 MW biogeneration project.


Global Microbial Fuel Cell Market Report Scope
| Mediator-Based MFC |
| Mediator-Free MFC |
| Single-Chamber |
| Dual-Chamber |
| Stackable Modular |
| Carbon Cloth/Felt |
| Graphene and Composites |
| Metal-Based (SS, Ti) |
| Novel Bio-derived |
| Municipal Wastewater/Industrial Effluents |
| Agricultural Run-off |
| Marine Sediments |
| Wastewater Treatment and Energy Recovery |
| Power Generation (Remote/Portable) |
| Biosensors and Environmental Monitoring |
| Others |
| Industrial |
| Municipal Utilities |
| Commercial and Residential |
| Research Institutions |
| North America | United States |
| Canada | |
| Mexico | |
| Europe | Germany |
| United Kingdom | |
| France | |
| Italy | |
| NORDIC Countries | |
| Russia | |
| Rest of Europe | |
| Asia-Pacific | China |
| India | |
| Japan | |
| South Korea | |
| ASEAN Countries | |
| Rest of Asia-Pacific | |
| South America | Brazil |
| Argentina | |
| Rest of South America | |
| Middle East and Africa | Saudi Arabia |
| United Arab Emirates | |
| South Africa | |
| Egypt | |
| Rest of Middle East and Africa |
| By Type | Mediator-Based MFC | |
| Mediator-Free MFC | ||
| By Design | Single-Chamber | |
| Dual-Chamber | ||
| Stackable Modular | ||
| By Electrode Material | Carbon Cloth/Felt | |
| Graphene and Composites | ||
| Metal-Based (SS, Ti) | ||
| Novel Bio-derived | ||
| By Substrate Source | Municipal Wastewater/Industrial Effluents | |
| Agricultural Run-off | ||
| Marine Sediments | ||
| By Application | Wastewater Treatment and Energy Recovery | |
| Power Generation (Remote/Portable) | ||
| Biosensors and Environmental Monitoring | ||
| Others | ||
| By End-User | Industrial | |
| Municipal Utilities | ||
| Commercial and Residential | ||
| Research Institutions | ||
| By Geography | North America | United States |
| Canada | ||
| Mexico | ||
| Europe | Germany | |
| United Kingdom | ||
| France | ||
| Italy | ||
| NORDIC Countries | ||
| Russia | ||
| Rest of Europe | ||
| Asia-Pacific | China | |
| India | ||
| Japan | ||
| South Korea | ||
| ASEAN Countries | ||
| Rest of Asia-Pacific | ||
| South America | Brazil | |
| Argentina | ||
| Rest of South America | ||
| Middle East and Africa | Saudi Arabia | |
| United Arab Emirates | ||
| South Africa | ||
| Egypt | ||
| Rest of Middle East and Africa | ||


Key Questions Answered in the Report
How large is the microbial fuel cell market in 2025?
The microbial fuel cell market size reached USD 230.92 million in 2025 and is on track for a 5.08% CAGR to 2030.
Which region leads in microbial fuel cell deployment?
Asia-Pacific holds 45.1% of global revenue, reflecting strong policy support and cost-effective electrode manufacturing hubs.
What segment is growing fastest within microbial fuel cells?
Stackable modular designs register the highest segment CAGR at 8.5%, driven by utilities seeking scalable wastewater solutions.
Why do graphene electrodes matter for microbial fuel cells?
Graphene composites raise power density up to fourfold while declining prices make advanced anodes economically viable for large plants.
What is the main barrier to wider microbial fuel cell adoption?
Low power density versus competing technologies still limits large-load applications, pressing researchers to optimize electrode architecture and microbial consortia.
Page last updated on:


