Fuel Dispenser Market Size and Share
Market Overview
| Study Period | 2020 - 2030 |
|---|---|
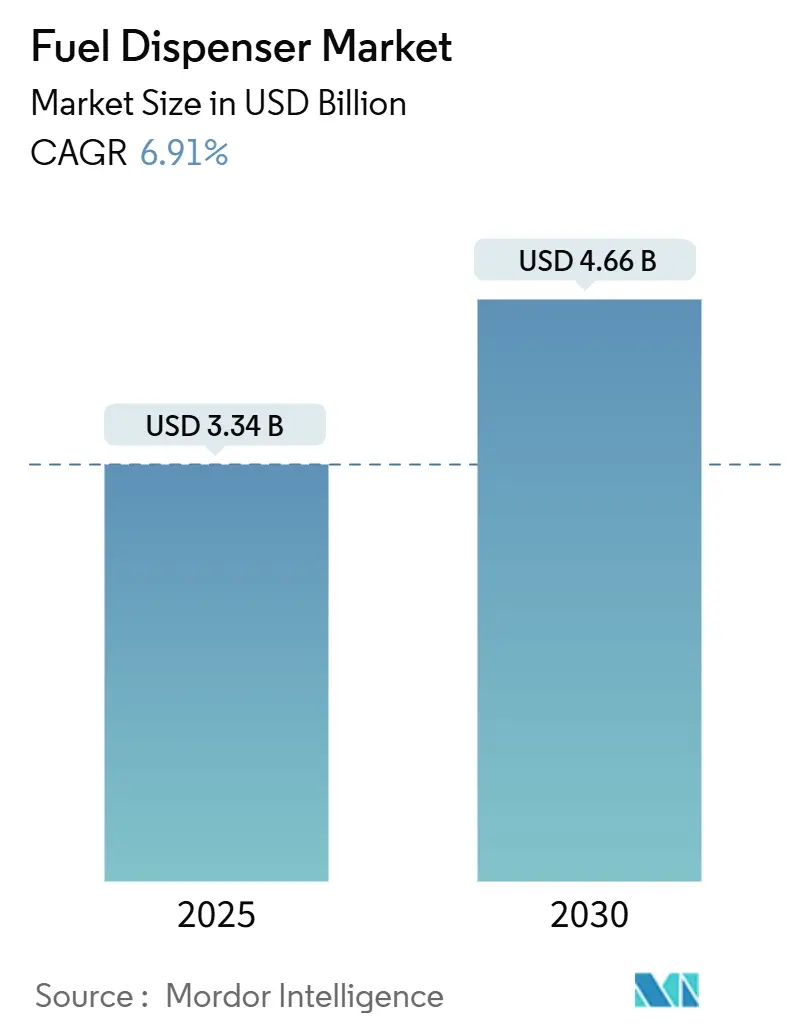
| Market Size (2025) | USD 3.34 Billion |
| Market Size (2030) | USD 4.66 Billion |
| Growth Rate (2025 - 2030) | 6.91% CAGR |
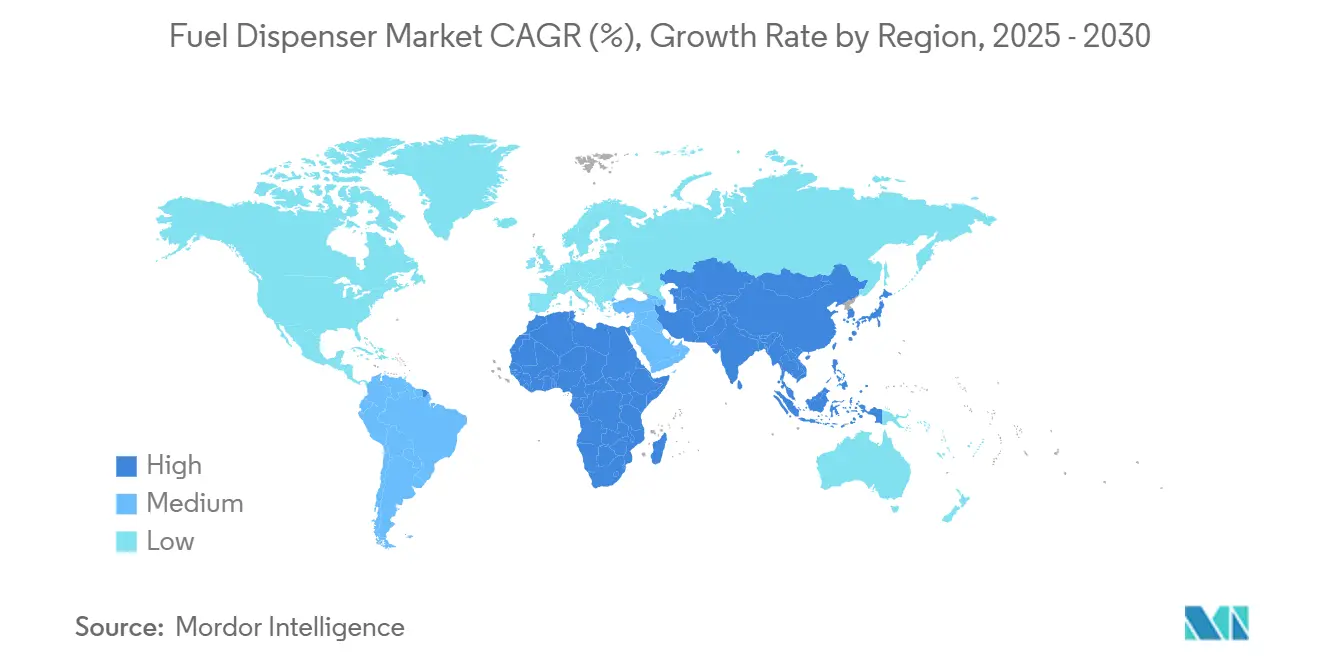
| Fastest Growing Market | Asia Pacific |
| Largest Market | Asia Pacific |
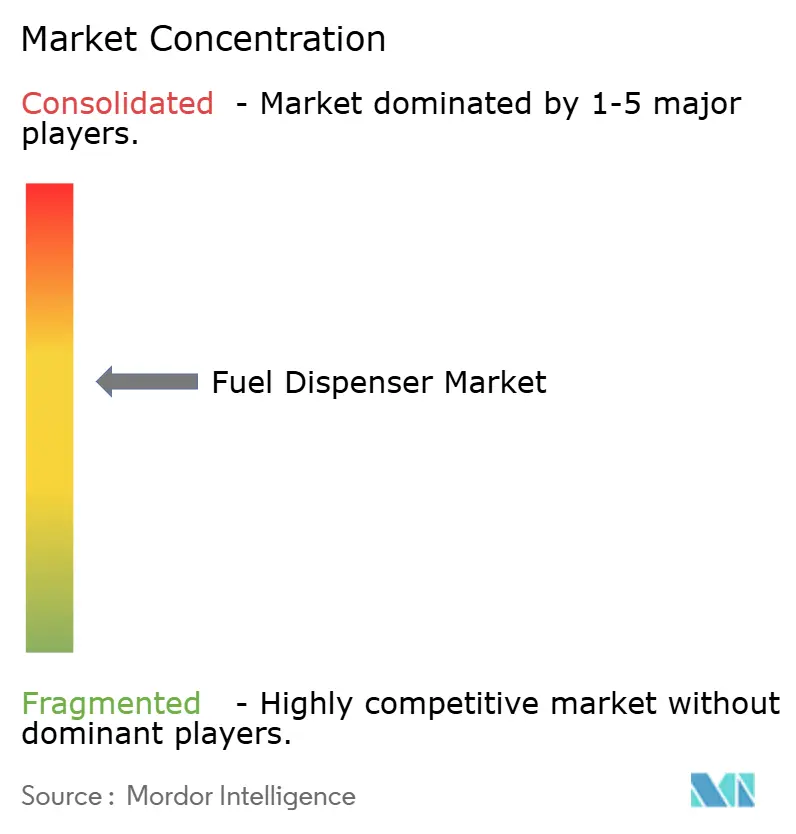
| Market Concentration | Medium |
Major Players *Disclaimer: Major Players sorted in no particular order Image © Mordor Intelligence. Reuse requires attribution under CC BY 4.0. | |
Fuel Dispenser Market Analysis by Mordor Intelligence
The Fuel Dispenser Market size is estimated at USD 3.34 billion in 2025, and is expected to reach USD 4.66 billion by 2030, at a CAGR of 6.91% during the forecast period (2025-2030).
Growth rests on parallel trends: emerging-economy spending on green-field fuel-retail networks, mandatory EMV and contactless payment upgrades, and the rapid deployment of hydrogen, renewable diesel, and data-rich smart dispensing platforms. Suppliers integrating alternative fuel handling with cloud-based analytics strengthen competitive positioning even as electrification in OECD markets dampens gasoline throughput. Supply-chain pressure on precision flow sensors and cybersecurity liabilities for connected forecourts temper near-term momentum but do not offset infrastructure programs tied to commercial transport demand and hydrogen roll-outs. Consequently, the fuel dispenser market invests in multi-fuel capability, edge analytics, and modular designs that shorten site commissioning time.
Key Report Takeaways
- By fuel type, hydrogen equipment held only a niche base in 2024 but is forecast to expand at a 116.5% CAGR to 2030, the fastest among all subsections of the fuel dispenser market.
- By technology, electronic and smart IoT-enabled dispensers led with 63.8% revenue share in 2024, while maintaining the highest segment CAGR at 7.3% through 2030, underscoring their pivotal role in the fuel dispenser market.
- By dispenser type, mobile and skid-mounted units posted the quickest pace at 8.5% CAGR between 2025 and 2030, reflecting rising fleet and temporary infrastructure needs across the fuel dispenser market.
- By mounting configuration, above-ground systems are projected to register a 7.9% CAGR as operators balance lower installation costs with easier maintenance in the fuel dispenser market.
- By flow rate, high-flow dispensers above 90 L/min are on track to grow 8.1% annually, driven by medium- and heavy-duty transport fueling patterns within the fuel dispenser market.
- By application, aviation and marine bunkering captured 8.9% CAGR potential toward 2030, reflecting specialized demand for alternative and low-sulfur fuels across the fuel dispenser market.
- By geography, Asia-Pacific accounted for the largest share, 39.7% in 2024, and is also likely to grow the fastest, at a CAGR of 7.5% through 2030.
Global Fuel Dispenser Market Trends and Insights
Drivers Impact Analysis*
| Driver | (~) % Impact on CAGR Forecast | Geographic Relevance | Impact Timeline |
|---|---|---|---|
| Expansion of fuel-retail infrastructure in emerging economies | +1.80% | Asia-Pacific, Middle East & Africa | Medium term (2-4 years) |
| Regulatory push for EMV/contactless payment upgrades | +1.20% | Global, with emphasis on North America & Europe | Short term (≤ 2 years) |
| Growing diesel demand from commercial transport fleets | +1.00% | Global, strongest in Asia-Pacific & North America | Medium term (2-4 years) |
| Integration of hydrogen & high-blend biofuels necessitating retrofits | +0.90% | North America & Europe, expanding to Asia-Pacific | Long term (≥ 4 years) |
| Monetization of dispenser IoT data for dynamic pricing & loyalty | +0.70% | Global, led by developed markets | Medium term (2-4 years) |
| Source: Mordor Intelligence | |||
Expansion of Fuel-Retail Infrastructure in Emerging Economies
Asia-Pacific alone accounts for 39.7% of 2024 revenues and continues to build green-field stations alongside planned refinery additions of up to 4.9 million barrels per day through 2028.(1)Source: U.S. Energy Information Administration, “International Energy Outlook,” eia.gov India’s oil marketing companies intend to add 35-40 million t of refining capacity by fiscal 2030, a capital plan that directly generates orders for metering pumps, remote management systems, and vapor-recovery hardware.(2)Source: CRISIL Ratings, “Oil and Gas Refining Capacity Outlook,” crisil.com Southeast Asia’s projected oil consumption growth from 5 mbpd to 6.4 mbpd by 2035 further underwrites dispenser demand. While China forecasts 20,000 outlet closures by 2030 due to lower refined-oil use, survivors are retrofitting with multi-energy islands requiring compliant dispensing lines for gasoline, hydrogen, LNG, and EV charging. These countervailing trends leave the fuel dispenser market positioned for healthy volume growth even as product mixes evolve toward alternative fuels.
Regulatory Push for EMV/Contactless Payment Upgrades
Global merchants face strict liability shifts for counterfeit-card fraud, driving rapid hardware replacement. U.S. fuel retailers have incurred only 40% compliance as of 2024, leaving a multi-year USD 7 billion retrofit pipeline. Gilbarco Veeder-Root’s FlexPay IV and Dover’s Tokheim Optinet illustrate modular payment stacks that shorten station downtime and enable add-on loyalty software. California extends Weights-and-Measures oversight to EV chargers, signaling a broader scope for device certification. Complementary cybersecurity directives for maritime and critical energy assets add incremental spending on authenticated firmware and isolated networks. Collectively, these reforms ensure the fuel dispenser market will substitute legacy card readers with unified, PCI-secure terminals capable of NFC and mobile-wallet transactions.
Growing Diesel Demand from Commercial Transport Fleets
Medium-duty truck revenues are projected to climb from USD 51.8 billion in 2023 to USD 85.31 billion by 2032, anchoring diesel pump utilization. Anticipated 2027 emissions rules that lift truck sticker prices by USD 25,000 are prompting fleet pre-buys, temporarily boosting diesel volume sales. India’s gasoil use remains the largest contributor to national oil demand growth, while renewable diesel consumption in U.S. fleets jumped 68% during 2023. Dispensers must accommodate conventional ULSD and B20-B100 biodiesel blends, pushing manufacturers to ship chemically compatible seals and advanced filtration. This dual-fuel capability reinforces revenue visibility for the fuel dispenser market.
Integration of Hydrogen & High-Blend Biofuels Necessitating Retrofits
The EU Alternative Fuels Infrastructure Regulation requires one hydrogen station every 200 km on the core TEN-T network by 2030. North America is following with a federal rollout starting in 2027. Dover Fueling Solutions has released H35 and H70 dispensers featuring IoT telemetry that transmits pressure, temperature, and usage metrics to cloud dashboards. Meanwhile, U.S. renewable diesel capacity is set to more than double to 384,000 bpd by 2025, necessitating biofuel-compatible gaskets and corrosion-resistant piping technical imperatives to sustain capital spending on fueling islands long after gasoline volume plateaus.
Restraints Impact Analysis*
| Restraint | (~) % Impact on CAGR Forecast | Geographic Relevance | Impact Timeline |
|---|---|---|---|
| Rapid EV adoption curbing gasoline volumes in OECD markets | -1.40% | North America & Europe primarily | Medium term (2-4 years) |
| High compliance costs for weights-and-measures re-certification | -0.80% | Global, most acute in developed markets | Short term (≤ 2 years) |
| Rising cyber-security liabilities for connected dispensers | -0.60% | Global, concentrated in connected infrastructure | Short term (≤ 2 years) |
| Shortage of precision metering chips & flow sensors | -0.50% | Global supply chain impact | Short term (≤ 2 years) |
| Source: Mordor Intelligence | |||
Rapid EV Adoption Curbing Gasoline Volumes in OECD Markets
Public EV charging sites in the United States grew by 704 fast-charge stations in Q2 2024 alone, attracting USD 6.1 billion in annual capital deployment. Analysts warn that 25% of North American gas stations could close by 2035 without diversified energy offers. Although leading oil majors co-locate chargers with liquid fuels, slower forecourt throughput weakens cash-flow cover for dispenser upgrades. Payback for DC fast chargers ranges from 7 to 10 years, complicating financing in regions with flat gasoline demand. As a result, the fuel dispenser market in OECD zones must pivot to a multi-energy format to sustain profitability.
High Compliance Costs for Weights-and-Measures Re-Certification
U.S. retailers must retest every dispenser biennially and archive delivery records for four years, driving up direct inspection expenses and downtime. Proposed amendments to NIST Handbook 44 will extend similar protocols to EV charging meters, placing hybrid stations under dual regimes. States like Arizona already run volumetric checks on 2,000 sites yearly, while California requires third-party Registered Service Agencies for liquid and electric metering devices. Compliance fees and technician labor inflate the total cost of ownership, reducing discretionary capex for new dispensers and restraining short-term growth in the fuel dispenser market.
*Our forecasts treat driver/restraint impacts as directional, not additive. The impact forecasts reflect baseline growth, mix effects, and variable interactions.
Segment Analysis
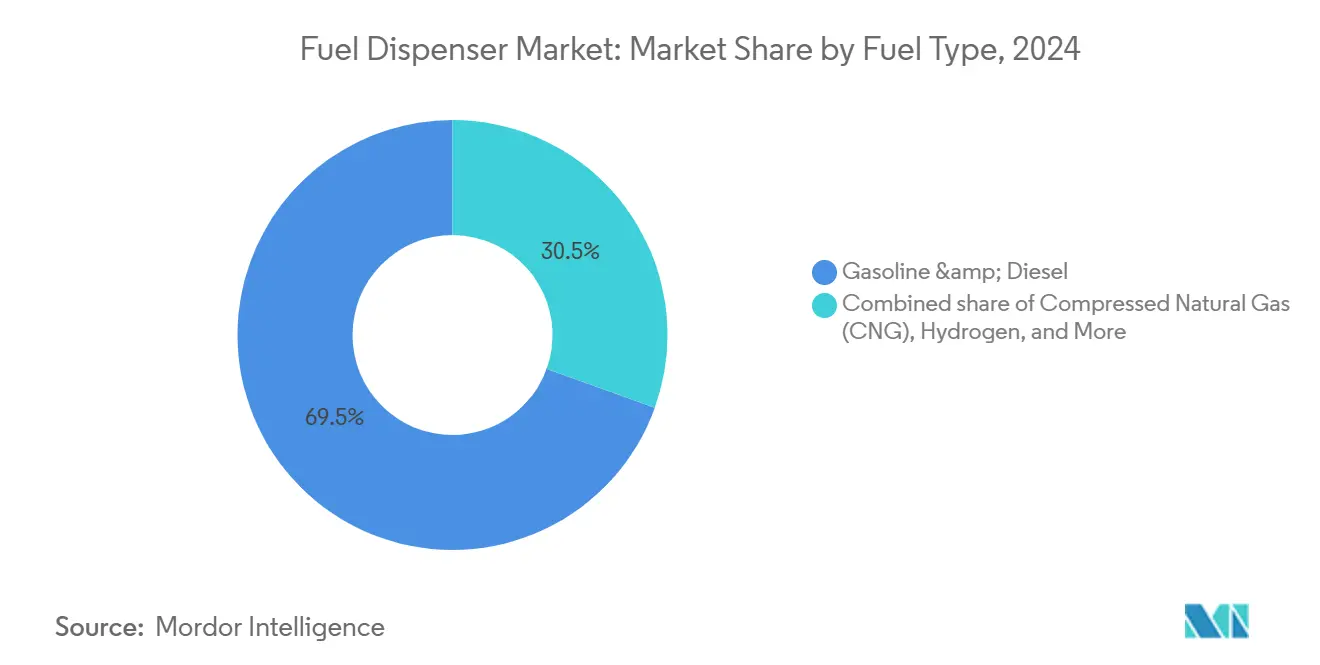
By Fuel Type: Hydrogen Dispensers Set the Pace
Hydrogen systems presently represent a minor slice of revenue, yet they command the strongest trajectory; the segment is forecast to surge at a 116.5% CAGR, well above gasoline and diesel’s combined 69.5% fuel dispenser market share in 2024. The fuel dispenser market size for hydrogen equipment is expected to widen sharply once the U.S. national network enters construction in 2027, providing multiple-pressure nozzles (H35 and H70) to accommodate light- and heavy-duty vehicle classes.
A growing slate of tax credits and zero-emission mandates in Europe and East Asia anchors demand visibility for hydrogen dispensers, while emerging renewable diesel policies boost interest in B100-rated pumps. In contrast, conventional gasoline and diesel lines still attract replacement spend in Africa, South Asia, and Latin America, preserving baseline volumes for established manufacturers within the fuel dispenser industry.


By Technology: Smart Connected Systems Dominate
Electronic and IoT-ready units held 63.8% of 2024 revenue, reflecting operator priority for real-time inventory reconciliation, contactless payment, and digital merchandising in the fuel dispenser market. Gilbarco Veeder-Root’s EMV-certified FlexPay IV suite and Dresser Wayne’s iX Media screens enable targeted promotions that grow in-store basket size.
Mechanical dispensers persist in ultra-price-sensitive channels but lose share as regulations tighten. Allied Electronics’ cloud-native payment gateway, which bypasses lengthy PCI certifications, illustrates how software upgrades now arrive faster than mechanical rebuild cycles. These innovations encourage recurring revenue streams from data services, a trend redefining competitive advantage inside the fuel dispenser market.
By Mounting Configuration: Above-Ground Installations Accelerate
In-ground submersible models controlled 72.9% of 2024 installations, yet above-ground systems are projected to expand at a 7.9% CAGR, supported by simplified maintenance and lower civil-works costs. Operators favor skid modules for brownfield sites and fleet depots where downtime must be minimized.
Hydrogen and LNG frequently adopt above-ground cabinets because high-pressure storage mandates easy inspection access and robust venting. The Department of the Interior’s aviation guidelines validate above-ground configurations for rapid fuel-quality checks. These attributes sustain a gradual mix shift within the fuel dispenser market.

By Dispenser Type: Mobile and Skid-Mounted Units Scale
Self-service islands retained a 65.4% share in 2024, but mobile units show an 8.5% CAGR through 2030 as logistics operators deploy on-site refueling to reduce mileage deadhead. SPATCO’s acquisition of Blue1 Energy broadened its DEF and renewable diesel portfolio, signaling investor confidence in modular equipment.
Full-service islands are declining in mature economies because self-checkout lowers operating costs. Nevertheless, premium urban forecourts maintain attendants to differentiate service, especially where EV charging requires customer education. The blend of permanent and mobile assets diversifies revenue channels for manufacturers in the fuel dispenser market.
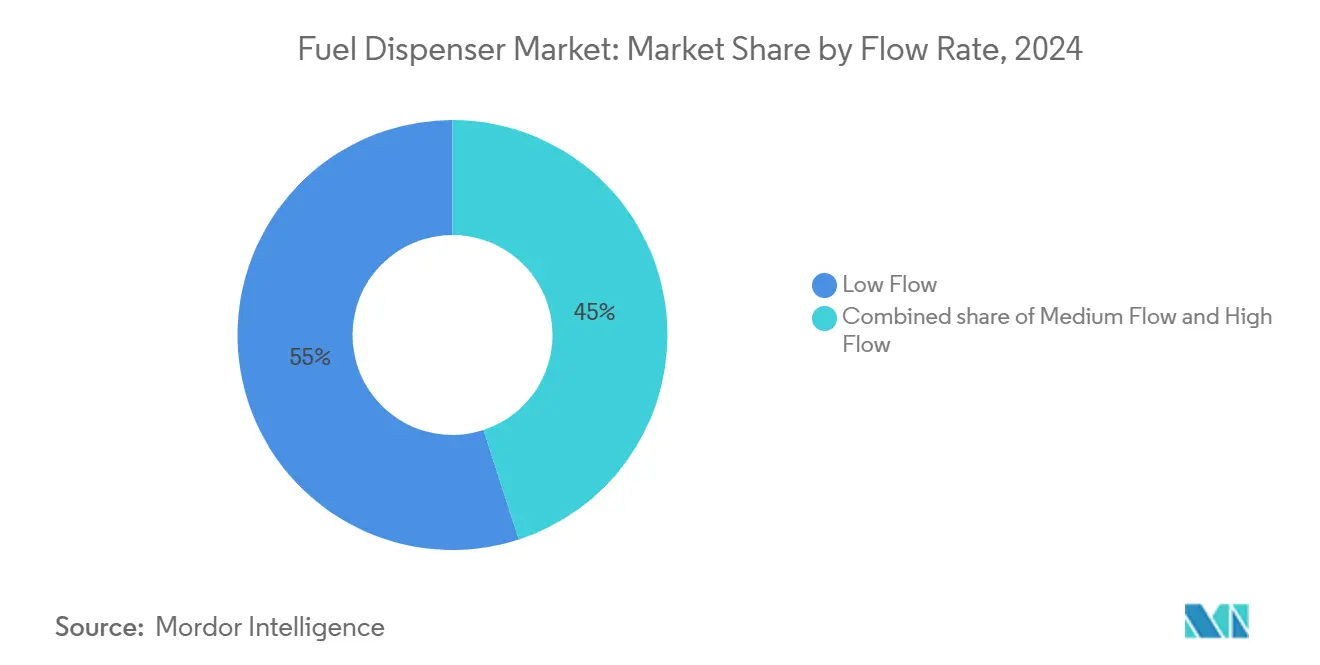
By Flow Rate: High-Flow Systems Support Heavy-Duty Needs
Low-flow dispensers below 40 L/min retained 55% of 2024 shipments, largely tied to passenger vehicles. High-flow devices above 90 L/min are expected to lead with an 8.1% CAGR as medium- and heavy-duty fleets scale their electrification-delayed refueling demand FLEETOWNER.COM. Europe’s Düsseldorf hydrogen hub, capable of 5 t/day, exemplifies infrastructure requiring rapid dispensing cycles.
Medium-flow ranges (40–90 L/min) will keep serving mixed-use corridors, yet regulatory clarity on renewable diesel blend limits may push more operators toward high-flow nozzles that can switch fuels on demand. Such flexibility enhances return on investment, strengthening the fuel dispenser market outlook.
By Application: Aviation and Marine Bunkering Gains Momentum
Retail outlets continue to account for 70.1% of 2024 consumption, but aviation and marine bunkering lines are on pace for an 8.9% CAGR as carriers explore SAF, methanol, and ammonia pathways. Dispensers used at airports must meet stringent filtration and static-control criteria, driving premium pricing and attractive margins.
Maritime operators add methanol and LNG dispensers to cope with IMO 2020 sulfur rules. Synthetic e-fuels for shipping and aviation are under pilot, requiring high-accuracy metering and temperature compensation. These specialized requirements create long-cycle replacement opportunities across the fuel dispenser market.
Geography Analysis
Asia-Pacific commands 39.7% of 2024 revenue and is set to post a 7.5% CAGR, propelled by refinery expansions, ongoing CNG station rollouts, and widening highway networks in India, Indonesia, and Vietnam. China’s forecasted closure of 20,000 stations by 2030 compels remaining outlets to upgrade into multi-energy hubs, lifting spend per site even as total outlet count falls.(3)“China’s Gas Station Consolidation Forecast,” caijing.com.cn
North America balances falling gasoline demand with robust hydrogen funding and a USD 7 billion EMV retrofit backlog; these factors partially offset EV substitution risk, keeping the regional fuel dispenser market resilient. Europe’s mandate for one hydrogen station every 200 km spurs cross-border procurement while parallel bunker fuel rules drive coastal LNG dispenser uptake.The
Middle East and Africa leverage large green-field refinery projects and national fleet growth to sustain conventional pump orders, whereas Latin America shows moderate demand linked to infrastructure modernization and renewable fuel policy adoption. Overall, regional divergences place the global fuel dispenser market in a two-speed pattern: volume-led expansion in emerging economies and technology-driven retrofits in developed countries.

Competitive Landscape
The sector sits at a moderate concentration level, with brands such as Dover Corporation, Gilbarco Veeder-Root, and Dresser Wayne maintaining scale advantages in global distribution, yet facing agile challengers in the hydrogen and data analytics niches. Dover’s Clean Energy & Fueling segment delivered USD 463 million in revenue in Q2 2024 and closed six acquisitions since 2022 to deepen cryogenic and alternative fuel capability.
Gilbarco Veeder-Root’s partnership with Shell to outfit nearly 13,000 sites illustrates how payment technology distribution magnifies share gain. SPATCO’s Petro Supply and Blue1 Energy purchases reflect a roll-up strategy aimed at regional dealer networks and specialty fluids, strengthening its aftermarket parts and services position.
Technology differentiation centers on mobile wallets, remote monitoring, and predictive maintenance algorithms. PDI Technologies’ 2025 acquisition of P97 Networks gives it a closed-loop payments stack across CITGO, ExxonMobil, and Shell, eroding traditional hardware vendor lock-in. As top players race to embed multi-fuel dispensers with connected payment ecosystems, mid-tier competitors target localized fleet and governmental contracts, keeping the fuel dispenser market competitively dynamic.
Fuel Dispenser Industry Leaders
Gilbarco Veeder-Root (Vontier)
Wayne Fueling Systems (Dover)
Tatsuno Corporation
Censtar Science & Technology
Bennett Pump Company
- *Disclaimer: Major Players sorted in no particular order

Recent Industry Developments
- July 2025: PDI Technologies acquired P97 Networks to extend mobile payment processing across CITGO, ExxonMobil, and Shell forecourts, creating omnichannel consumer paths within the fuel dispenser market.
- May 2025: SPATCO Energy Solutions purchased Petro Supply, a Mid-Atlantic petroleum equipment distributor founded in 1971, widening its depot network and service capacity.
- January 2025: Dover Corporation reported Q4 2024 revenue of USD 1.9 billion and highlighted six strategic acquisitions that elevate cryogenic components for its Clean Energy & Fueling segment.
- August 2024: Kian Capital-backed SPATCO Energy Solutions acquired Blue1 Energy Equipment, augmenting storage and dispensing offerings geared to diesel exhaust fluid solutions.


Global Fuel Dispenser Market Report Scope
| Gasoline/Diesel |
| Compressed Natural Gas (CNG) |
| Liquefied Natural Gas (LNG) |
| Hydrogen |
| Mechanical |
| Electronic/Smart (IoT-enabled) |
| In-ground (submersible) |
| Above-ground |
| Self-service |
| Full-service |
| Mobile/Skid-mounted |
| Low Flow (Below 40 L min) |
| Medium Flow (40 to 90 L min) |
| High Flow (Above 90 L min) |
| Retail Fuel Stations |
| Commercial and Fleet Refueling |
| Aviation and Marine Bunkering |
| North America | United States |
| Canada | |
| Mexico | |
| Europe | Germany |
| United Kingdom | |
| France | |
| Italy | |
| NORDIC Countries | |
| Russia | |
| Rest of Europe | |
| Asia-Pacific | China |
| India | |
| Japan | |
| South Korea | |
| ASEAN Countries | |
| Rest of Asia-Pacific | |
| South America | Brazil |
| Argentina | |
| Rest of South America | |
| Middle East and Africa | Saudi Arabia |
| United Arab Emirates | |
| South Africa | |
| Egypt | |
| Rest of Middle East and Africa |
| By Fuel Type | Gasoline/Diesel | |
| Compressed Natural Gas (CNG) | ||
| Liquefied Natural Gas (LNG) | ||
| Hydrogen | ||
| By Technology | Mechanical | |
| Electronic/Smart (IoT-enabled) | ||
| By Mounting Configuration | In-ground (submersible) | |
| Above-ground | ||
| By Dispenser Type | Self-service | |
| Full-service | ||
| Mobile/Skid-mounted | ||
| By Flow Rate | Low Flow (Below 40 L min) | |
| Medium Flow (40 to 90 L min) | ||
| High Flow (Above 90 L min) | ||
| By Application | Retail Fuel Stations | |
| Commercial and Fleet Refueling | ||
| Aviation and Marine Bunkering | ||
| By Geography | North America | United States |
| Canada | ||
| Mexico | ||
| Europe | Germany | |
| United Kingdom | ||
| France | ||
| Italy | ||
| NORDIC Countries | ||
| Russia | ||
| Rest of Europe | ||
| Asia-Pacific | China | |
| India | ||
| Japan | ||
| South Korea | ||
| ASEAN Countries | ||
| Rest of Asia-Pacific | ||
| South America | Brazil | |
| Argentina | ||
| Rest of South America | ||
| Middle East and Africa | Saudi Arabia | |
| United Arab Emirates | ||
| South Africa | ||
| Egypt | ||
| Rest of Middle East and Africa | ||


Key Questions Answered in the Report
What is the projected revenue of the fuel dispenser market by 2030?
It is estimated to reach USD 4.66 billion, expanding at a 6.91% CAGR between 2025 and 2030.
Which technology category leads current dispenser sales?
Electronic and smart IoT-enabled models accounted for 63.8% of 2024 revenue, reflecting widespread EMV compliance and data-analytics adoption.
Why are hydrogen dispensers gaining importance?
Hydrogen equipment is forecast to grow at a 116.5% CAGR through 2030 as governments fund zero-emission fueling networks and impose alternative fuel mandates.
How will EV adoption influence traditional dispensers?
Accelerating EV charging rollouts in OECD regions will reduce gasoline volumes, prompting forecourt operators to invest in multi-energy islands combining liquid fuels with chargers.
Which region represents the largest opportunity for new dispenser installations?
Asia-Pacific leads with 39.7% share in 2024 and is expected to post a 7.5% CAGR, driven by refinery expansions and green-field station construction.
Page last updated on:


