Biogas Market Size and Share
Market Overview
| Study Period | 2021 - 2031 |
|---|---|
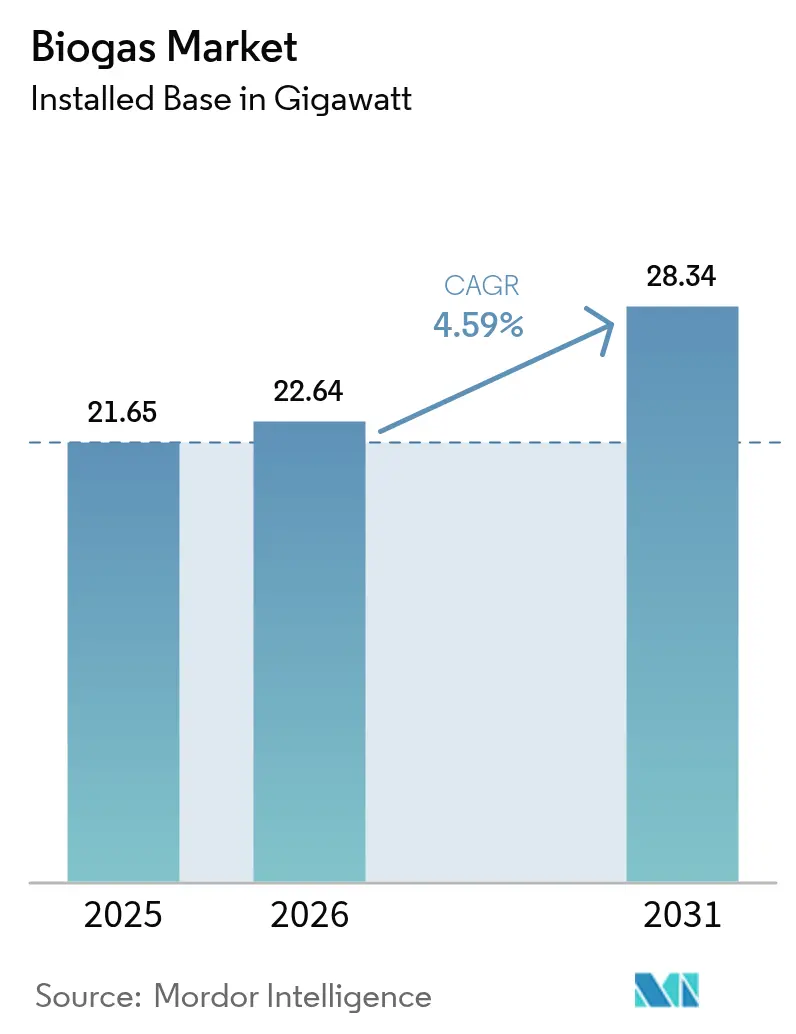
| Market Volume (2026) | 22.64 gigawatt |
| Market Volume (2031) | 28.34 gigawatt |
| Growth Rate (2026 - 2031) | 4.59% CAGR |
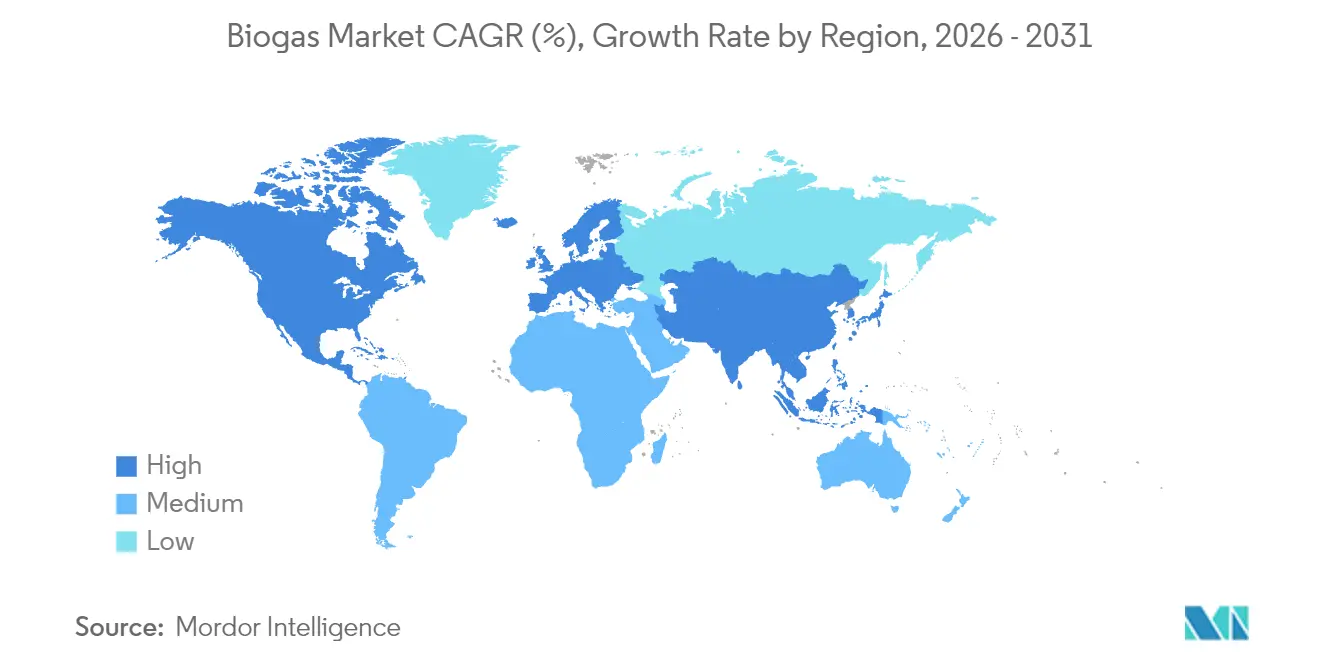
| Fastest Growing Market | South America |
| Largest Market | Europe |
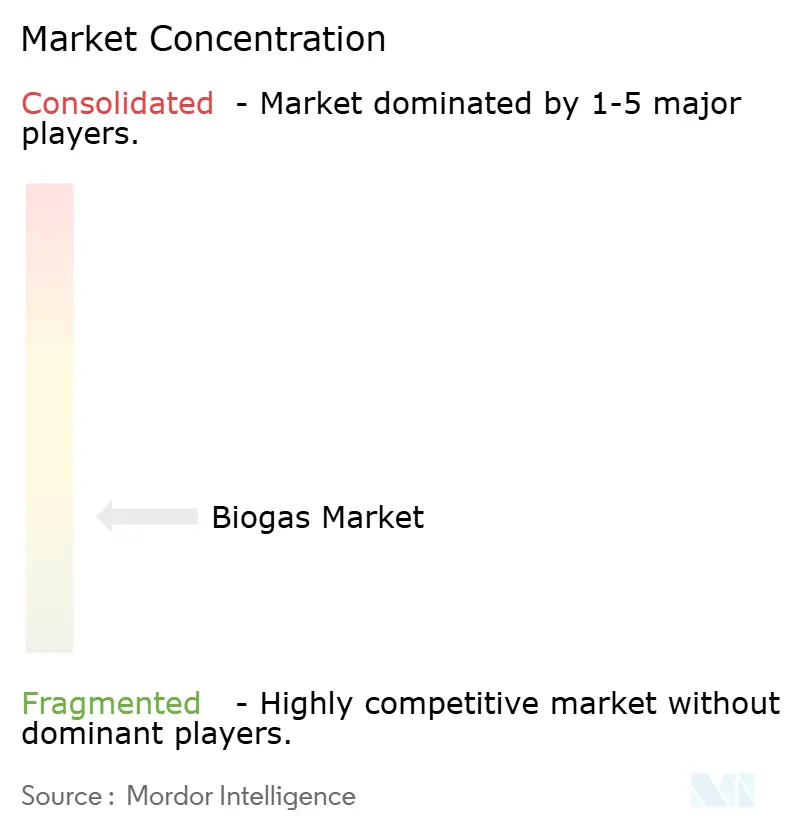
| Market Concentration | Low |
Major Players *Disclaimer: Major Players sorted in no particular order Image © Mordor Intelligence. Reuse requires attribution under CC BY 4.0. | |
Biogas Market Analysis by Mordor Intelligence
The Biogas Market size was valued at 21.65 gigawatt in 2025 and estimated to grow from 22.64 gigawatt in 2026 to reach 28.34 gigawatt by 2031, at a CAGR of 4.59% during the forecast period (2026-2031).
Maturing policy incentives, a pivot from power-only plants to renewable natural gas (RNG) upgrading, and rising corporate decarbonization commitments are re-shaping investment criteria. Transport fuel mandates reward the negative-carbon attributes of dairy and food-waste gas, while utilities integrate dispatchable biogas to stabilize solar- and wind-heavy grids. Europe retains first-mover advantage because of feed-in tariffs and grid-ready biomethane infrastructure, but South America’s 10% CAGR through 2030 underlines how fresh policy frameworks can accelerate late-entry regions. Mid-scale 0.5-2 MW facilities still dominate capacity additions, yet sub-0.5 MW community plants are scaling quickly where distributed-generation incentives cut connection queues. Competitive intensity remains high: established integrators such as EnviTec Biogas defend their share by self-funding capacity, whereas new entrants focus on modular upgrading and carbon capture add-ons to lift yields and secure premium offtake contracts.
Key Report Takeaways
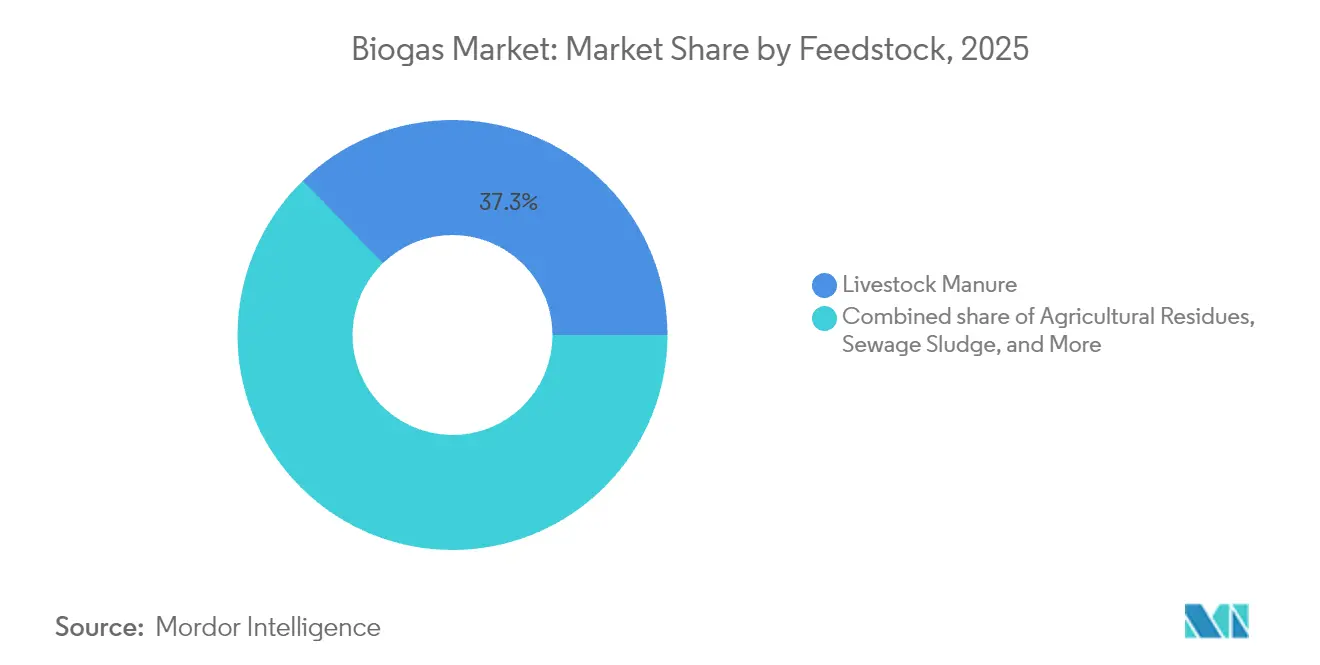
- By feedstock, livestock manure held a 37.25% share of the biogas market size in 2025; food waste is advancing at a 7.12% CAGR to 2031.
- By process technology, wet anaerobic digestion accounted for 59.10% installations in 2025; dry systems record the highest projected CAGR at 7.55% to 2031.
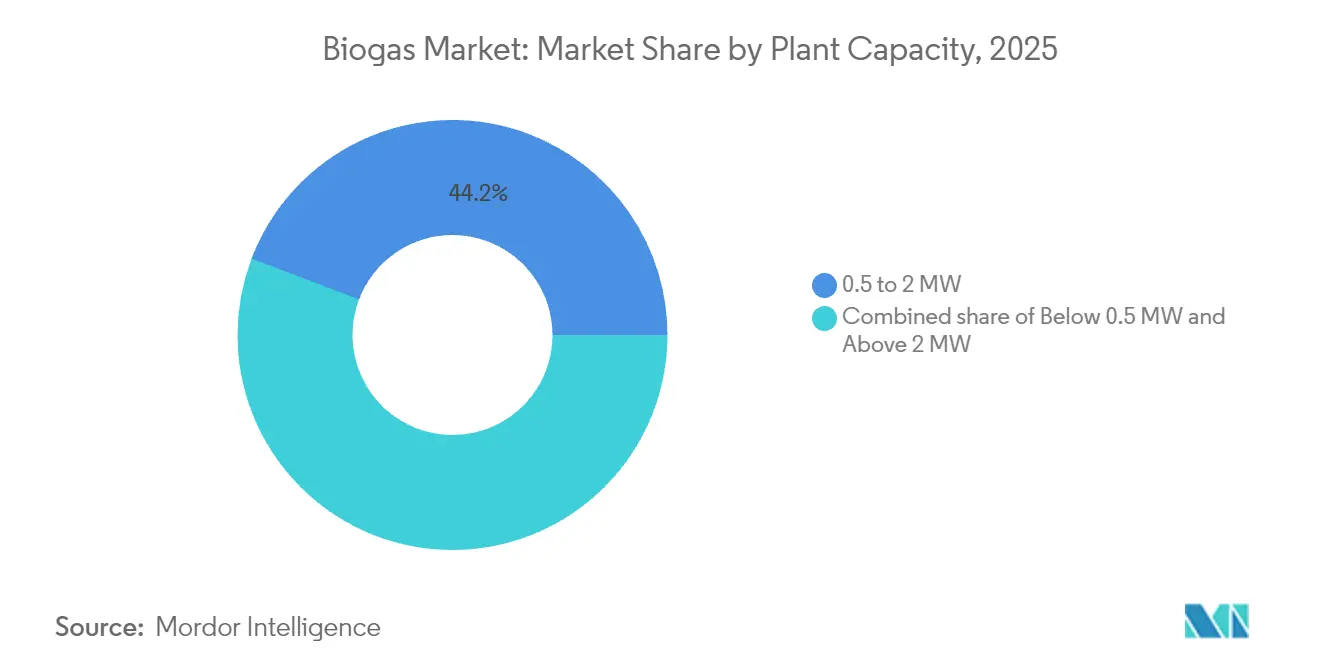
- By plant capacity, the 0.5-2 MW segment represented 44.20% of installations in 2025 in the biogas market, whereas sub-0.5 MW plants are rising at an 8.02% CAGR through 2031.
- By application, electricity generation led with 51.10% of the biogas market share in 2025, while vehicle fuel/RNG is forecast to expand at 8.58% CAGR through 2031.
- By geography, Europe commanded 65.10% market share in 2025; South America is the fastest-growing region at 9.45% CAGR to 2031.
Note: Market size and forecast figures in this report are generated using Mordor Intelligence’s proprietary estimation framework, updated with the latest available data and insights as of 2026.
Global Biogas Market Trends and Insights
Drivers Impact Analysis*
| Driver | (~) % Impact on CAGR Forecast | Geographic Relevance | Impact Timeline |
|---|---|---|---|
| Supportive government incentives & renewable energy mandates | 1.20% | Global, with strongest impact in EU, North America, and India | Medium term (2-4 years) |
| Decarbonisation targets of utilities & corporates | 0.80% | Global, led by Europe and North America | Long term (≥ 4 years) |
| Landfill diversion & circular-economy waste directives | 0.60% | EU, North America, with emerging impact in Asia Pacific | Medium term (2-4 years) |
| Rising demand for renewable natural gas (RNG) in transport | 0.90% | North America, Europe, with pilot programs in Asia Pacific | Short term (≤ 2 years) |
| Monetisation of digestate as certified bio-fertiliser | 0.40% | Global, with strongest adoption in agricultural regions | Long term (≥ 4 years) |
| Co-digestion synergies with wastewater treatment plants | 0.30% | Global, with early adoption in developed markets | Medium term (2-4 years) |
| Source: Mordor Intelligence | |||
Supportive Government Incentives & Renewable Energy Mandates
Production-based tax credits are replacing legacy feed-in tariffs, lengthening revenue visibility for developers. The 2025 U.S. biogas credit pivots projects toward RNG upgrading rather than electricity sales.[1]Staff Report, “U.S. Production Tax Credit Spurs RNG,” Bioenergy News, bioenergy-news.com India’s Compressed Bio-Gas scheme backs 5,000 plants with fixed offtake, and Poland’s FEnIKS program allocates USD 93 million, leveraging European Union funds to crowd-in further capital. These evolving instruments favor distributed plants that unlock rural income, close nutrient loops, and stabilize the grid.
Decarbonization Targets of Utilities & Corporates
Utilities now value biogas as a firming resource that fills evening demand gaps when solar output fades. Corporates procure RNG to cut Scope 3 emissions and lock in verifiable carbon credits. Negative-carbon intensity scores in California let dairy RNG trade at premiums 3-4 times fossil gas, raising project internal rates of return.[2] Third-party verification frameworks elevate demand for plants with transparent methane-capture accounting strengthening growth prospects in the biogas market.
Landfill Diversion & Circular-Economy Waste Directives
EU rules mandating separate organic waste collection by 2025 create stable feedstock channels and tipping-fee revenues that boost project cash flows. Municipal programs show food-waste digestion yields of 827 L biogas/kg volatile solids when C:N ratios stay within 20-25. Operators equipped for multi-feedstock blends earn more by mixing food scraps with manure to maximize yields and monetize digestate as certified fertilizer.
Rising Demand for Renewable Natural Gas in Transport
Heavy-duty fleets prefer RNG because it matches diesel range without the payload penalty of batteries. Long-term contracts shelter haulers from diesel volatility while meeting tightening emission rules. The TotalEnergies-Vanguard Renewables JV targeting 5 TWh of RNG by 2030 signals that oil majors treat biogas in the biogas market as a strategic avenue to decarbonize trucking corridors.
Restraints Impact Analysis*
| Restraint | (~) % Impact on CAGR Forecast | Geographic Relevance | Impact Timeline |
|---|---|---|---|
| High capex relative to solar & wind projects | -0.70% | Global, with strongest impact in emerging markets | Short term (≤ 2 years) |
| Sub-optimal feedstock logistics in rural areas | -0.50% | Global, particularly acute in developing regions | Medium term (2-4 years) |
| Price volatility of conventional natural gas affecting RNG offtake | -0.40% | North America, Europe, with emerging impact in Asia Pacific | Short term (≤ 2 years) |
| Limited grid-injection infrastructure in emerging markets | -0.60% | Asia Pacific, South America, Middle East and Africa | Long term (≥ 4 years) |
| Source: Mordor Intelligence | |||
High Capex Relative to Solar & Wind Projects
Installed costs of USD 3,000-5,000/kW outstrip utility-scale solar, complicating debt terms. EnviTec Biogas offsets this by self-funding EUR 100 million to add 300 GWh capacity, capturing economies of scale that smaller developers cannot. Because of feedstock volatility and operational complexity, lenders typically demand 15-20% equity.
Sub-optimal Feedstock Logistics in Rural Areas
Transporting dilute manure or crop residues beyond 30 km erodes margins in the biogas market. Collection plus storage already swallows up to 30% of operating budgets in dispersed farm regions.[3]Developers hedge by co-locating digesters on large farms, aggregating nearby waste, or installing satellite pre-treatment units to densify solids before haulage.
*Our forecasts treat driver/restraint impacts as directional, not additive. The impact forecasts reflect baseline growth, mix effects, and variable interactions.
Segment Analysis
By Feedstock: Livestock Manure Leadership Challenged by Food Waste Growth
Livestock manure delivered 37.25% of feedstock input in 2025 and anchors long-term supply agreements with farms. Yet food-waste volumes expand 7.12% CAGR as cities adopt landfill bans that shift organics toward digesters, adding tipping-fee revenue to energy income. Agricultural residues and sewage sludge are flexible co-digestion recipes that smooth seasonal imbalances.
Digesters blending manure with food scraps regularly hit 827 L/kg volatile solids yields in the biogas market, thanks to balanced C:N ratios. Municipal policy support means urban waste haulers actively seek digester partners, letting operators lock multi-year gate-fee contracts that strengthen balance sheets.


By Process Technology: Wet Anaerobic Digestion Maturity Versus Dry Innovation
Wet digestion systems owned 59.10% of 2025 installations, reflecting decades-long supplier ecosystems and lower capex. Dry digestion grows 7.55% CAGR to 2031 because it tolerates 25-35% solids and uses less water, ideal for arid locations or high-solids waste.
Technology selection correlates with feedstock profile: poultry litter, yard trimmings, or packaged food waste increasingly favors dry twin-digester lines that cut preprocessing steps and water bills. Two-stage thermophilic setups achieve up to 43% higher energy recovery, yet only sophisticated operators absorb the extra control-system costs. The biogas market, therefore, segments around fit-for-purpose designs rather than a single dominant process.
By Plant Capacity: Mid-Scale Optimization Challenged by Distributed Systems
The 0.5-2 MW band accounted for 44.20% of worldwide installations 2025 in the biogas market, balancing economies of scale with manageable feedstock catchment areas. Sub-0.5 MW systems post 8.02% CAGR because community-scale incentives shorten permitting and lower grid-connection deposits.
Distributed digesters improve rural resilience by trimming line losses and supplying farm micro-grids. California Energy Commission pilots show 0.35 kWh/m³ net energy surplus plus 90% biosolid reduction from small wastewater digesters. Modular containerized plants now ship factory-tested, compressing lead times to months, not years, thus attracting dairy cooperatives and food processors wanting fast compliance with waste rules.
By Application: Electricity Generation Dominance Faces RNG Disruption
Due to established grid-sale contracts, electricity plants captured a 51.10% share of the biogas market in 2025. However, RNG projects post 8.58% CAGR to 2031 as transport fuel premiums outstrip wholesale power prices. Combined heat and power (CHP) systems still find niche demand in European districts where thermal and electrical output reach 80%-plus overall efficiency.
The pivot toward transport fuel in the biogas market hinges on the superior energy density and rapid refueling attributes of compressed and liquefied biomethane. More than 95% of new U.S. project announcements in 2024 targeted RNG, underscoring the speed of market reallocation. Developers now channel capital into upgrading skids, carbon capture modules, and LCFS credit marketing rather than turbine maintenance.
Geography Analysis
Europe held 65.10% of the biogas market share 2025 as legacy feed-in tariffs and standardized biomethane injection codes derisk projects for lenders. Germany alone hosts more than 400 plants, and the REPowerEU goal of 35 bcm of biomethane by 2030 further lifts pipeline-quality gas demand. Denmark illustrates diversification: six biogas-to-marine-fuel plants supply liquefied bio-LNG to shipping lanes, marrying waste valorization with IMO carbon rules.
South America records the fastest expansion at 9.45% CAGR through 2031 as Brazil’s Petrobras issues biomethane tenders and Argentina adds 82 MW in 2024 under agricultural-waste incentives. However, pipeline access and credit risk still hamper scale-up, so developers often cluster near sugarcane mills or meat-packing hubs where waste is abundant and offtake immediate.
North America stands at an inflection point in the biogas industry: over 2,500 U.S. sites generated 1.4 million scfm in 2024, and agricultural projects exceeded landfill gas for the first time. Canada’s Clean Fuel Regulations mimic California’s LCFS, widening premium RNG catchment. In Asia-Pacific, India targets 5,000 compressed biogas plants by 2030, supported by guaranteed offtake, while China embeds biogas within rural revitalization plans, pairing digesters with grid-connected micro-grids for village electrification.

Competitive Landscape
The biogas market remains fragmented: the top five developers hold less than 25% combined output, leaving room for regional specialists. EnviTec Biogas and Scandinavian Biogas leverage vertical integration—design, build, own, operate—to win bankable contracts in Europe. In North America, TotalEnergies and Vanguard Renewables partner to aggregate dairy and food-processing feedstock, targeting 5 TWh by 2030.
Technology differentiation is sharpening. CycleØ’s 2024 acquisition of Biogasclean adds biological methanation expertise, enabling plants to convert residual CO₂ into methane and achieve 98% recovery without solvent wash energy penalties. Start-ups focus on containerized upgrading skids and nutrient-rich digestate pelletizers to open ancillary revenue streams.
Investment momentum surged 40% year-on-year in the United States biogas industry, reaching USD 3 billion in 2024, yet slumps in natural-gas futures periodically dent RNG offtake pricing. Developers hedge with long-dated LCFS contracts or embed carbon capture and storage to qualify for additional tax credits. Competitive positioning increasingly rewards firms that lock feedstock and offtake to insulate against commodity swings.
Biogas Industry Leaders
Engie SA
EnviTec Biogas AG
Bright Renewables BV
Hitachi Zosen Inova AG
PlanET Biogas Group
- *Disclaimer: Major Players sorted in no particular order

Recent Industry Developments
- February 2025: American Biogas Council reported USD 3 billion investment in new U.S. biogas systems during 2024, marking 40% growth on prior-year capital deployment.
- January 2025: Scandinavian Biogas Group invested EUR 90 million to add 240 GWh capacity in Germany, aided by SEK 154 million grant for a bio-LNG facility in Mönsterås.
- November 2024: Reliance Industries committed INR 65,000 crore (USD 7.8 billion) to build 500 compressed biogas plants in Andhra Pradesh within four years.
- October 2024: European Union activated Union Database sustainability certification for biomethane imports, tightening traceability and favoring domestic producers.


Global Biogas Market Report Scope
Biogas is a mixture made from methane (CH4) and carbon dioxide (CO2), along with water and traces of gases. These gases are produced by the breakdown of organic matter in the absence of oxygen.
The biogas market is segmented by application, feedstock, and geography. By application, the market is segmented into electricity generation, biofuel, and heat generation. By feedstock, the market is segmented into livestock manure, sewage, food waste, crop residues, and energy crops. The report also covers the market size and forecasts for the biogas market across major regions such as North America, Europe, Asia-Pacific, South America and Middle-East & Africa. For each segment except feedstock, the market sizing and forecasts have been done based on installed capacity (GW).
| Agricultural Residues |
| Livestock Manure |
| Sewage Sludge |
| Food and Beverage Waste |
| Energy Crops |
| Wet Anaerobic Digestion |
| Dry Anaerobic Digestion |
| Landfill Gas Recovery |
| Below 0.5 MW |
| 0.5 to 2 MW |
| Above 2 MW |
| Electricity Generation |
| Heat Generation |
| Vehicle Fuel/RNG |
| Combined Heat and Power (CHP) |
| North America | United States |
| Canada | |
| Rest of North America | |
| Europe | Germany |
| United Kingdom | |
| Italy | |
| France | |
| Czech Republic | |
| Rest of Europe | |
| Asia Pacific | China |
| Japan | |
| Thailand | |
| South Korea | |
| Malaysia | |
| Indonesia | |
| Australia | |
| Rest of Asia Pacific | |
| South America | Brazil |
| Argentina | |
| Chile | |
| Rest of South America | |
| Middle East and Africa | Israel |
| Iran | |
| South Africa | |
| Egypt | |
| Rest of Middle East and Africa |
| By Feedstock | Agricultural Residues | |
| Livestock Manure | ||
| Sewage Sludge | ||
| Food and Beverage Waste | ||
| Energy Crops | ||
| By Process Technology | Wet Anaerobic Digestion | |
| Dry Anaerobic Digestion | ||
| Landfill Gas Recovery | ||
| By Plant Capacity | Below 0.5 MW | |
| 0.5 to 2 MW | ||
| Above 2 MW | ||
| By Application | Electricity Generation | |
| Heat Generation | ||
| Vehicle Fuel/RNG | ||
| Combined Heat and Power (CHP) | ||
| By Geography | North America | United States |
| Canada | ||
| Rest of North America | ||
| Europe | Germany | |
| United Kingdom | ||
| Italy | ||
| France | ||
| Czech Republic | ||
| Rest of Europe | ||
| Asia Pacific | China | |
| Japan | ||
| Thailand | ||
| South Korea | ||
| Malaysia | ||
| Indonesia | ||
| Australia | ||
| Rest of Asia Pacific | ||
| South America | Brazil | |
| Argentina | ||
| Chile | ||
| Rest of South America | ||
| Middle East and Africa | Israel | |
| Iran | ||
| South Africa | ||
| Egypt | ||
| Rest of Middle East and Africa | ||


Key Questions Answered in the Report
What is the current size of the biogas market?
The biogas market size stood at 22.64 GW in 2026 and is forecast to reach 28.34 GW by 2031.
Which region dominates biogas industry production today?
Europe leads with 65.10% market share thanks to mature feed-in tariffs and extensive biomethane grid-injection networks.
Why is renewable natural gas gaining momentum in transport?
Negative-carbon intensity credits under programs such as California’s LCFS let dairy and food-waste RNG sell at 3-4 times fossil gas prices, making it an attractive diesel substitute for heavy-duty fleets.
What feedstock shows the fastest growth through 2031?
Food waste is expanding at a 7.12% CAGR as landfill bans and tipping-fee revenues incentivize separate organic waste collection.
How are capital costs affecting project pipelines?
Installed costs of USD 3,000-5,000/kW remain higher than solar or wind, so developers with strong balance sheets or integrated value-chains have a funding edge.
What plant size segment is expected to grow quickest?
Sub-0.5 MW community-scale digesters are projected to rise at 8.02% CAGR because they fit distributed-generation incentives and require simpler grid connections.
Page last updated on:


