Market Overview
| Study Period | 2021 - 2031 |
|---|---|
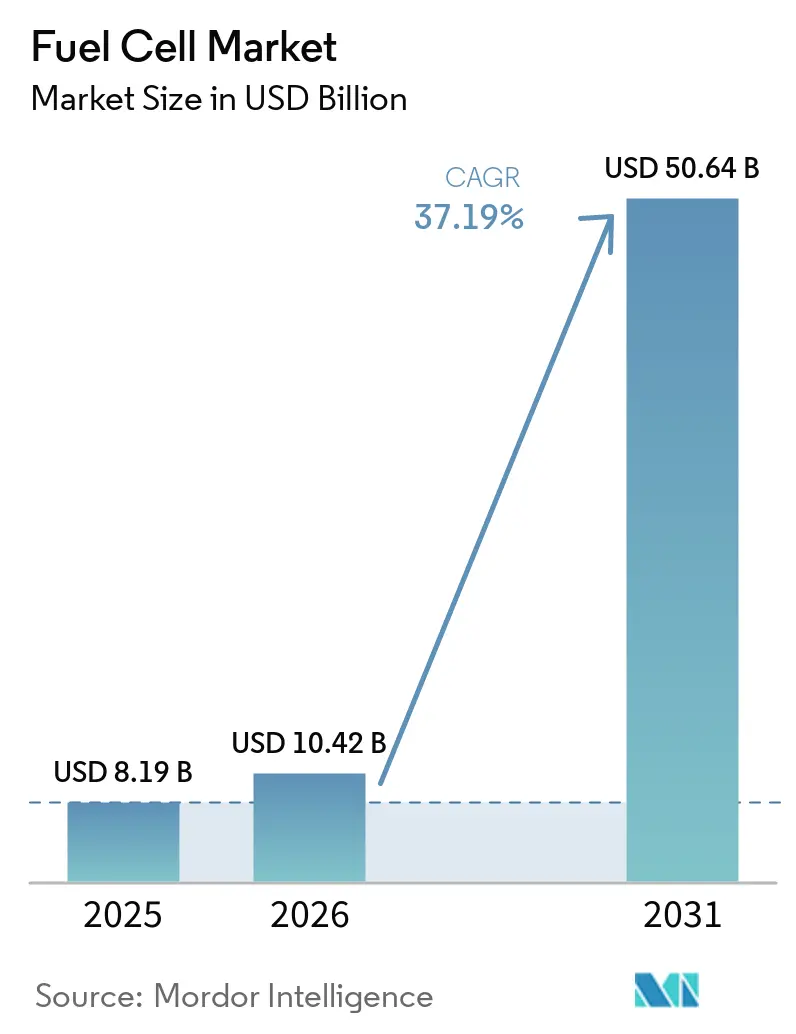
| Market Size (2026) | USD 10.42 Billion |
| Market Size (2031) | USD 50.64 Billion |
| Growth Rate (2026 - 2031) | 37.19% CAGR |
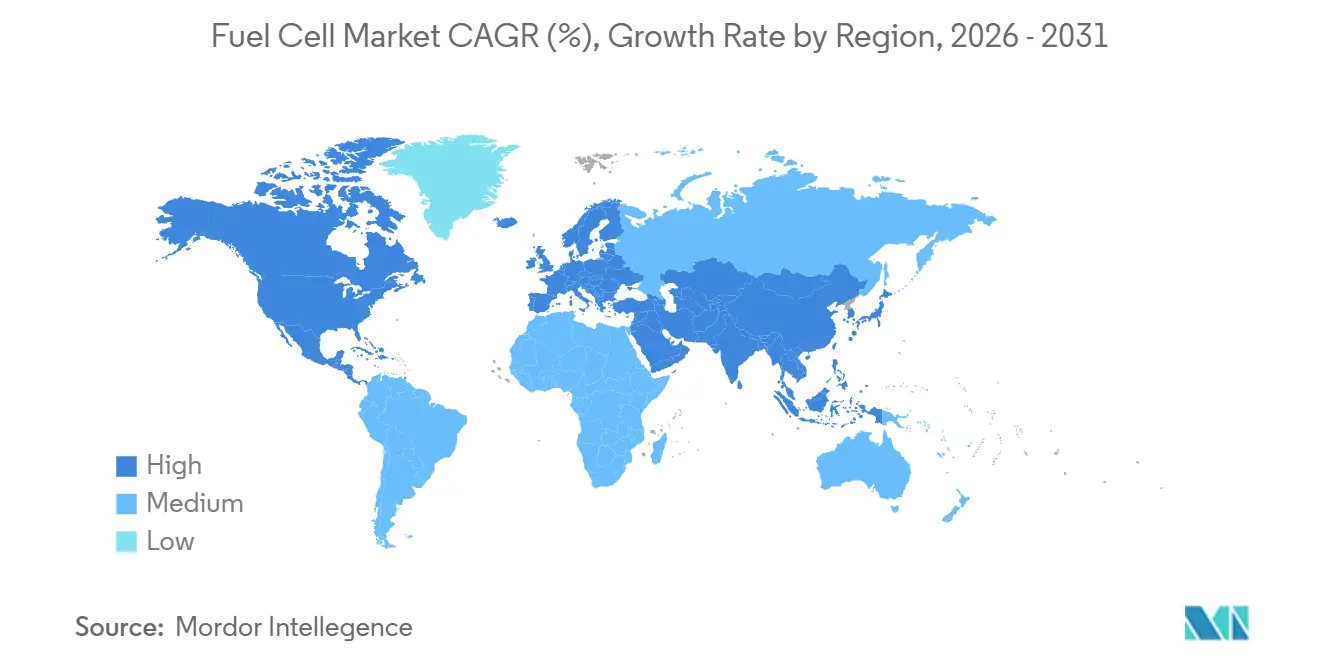
| Fastest Growing Market | Middle East and Africa |
| Largest Market | Asia Pacific |
| Market Concentration | Low |
Major Players *Disclaimer: Major Players sorted in no particular order Image © Mordor Intelligence. Reuse requires attribution under CC BY 4.0. | |
Fuel Cell Market Analysis by Mordor Intelligence
The Fuel Cell Market size was valued at USD 8.19 billion in 2025 and is estimated to grow from USD 10.42 billion in 2026 to reach USD 50.64 billion by 2031, at a CAGR of 37.19% during the forecast period (2026-2031).
Rapid cost declines in green and blue hydrogen, stringent zero-emission rules for heavy transport, and hyperscale demand for long-duration backup power are accelerating the fuel cell market transition from pilot initiatives to commercial deployment. Vehicular applications dominate revenue, yet stationary solid oxide systems are scaling quickly as utilities seek high-efficiency, fuel-flexible assets. Asia-Pacific remains the revenue center, while the Middle East and Africa promise the fastest upside because giga-scale green hydrogen projects will anchor local supply chains. Competitive intensity is high: the five largest vendors hold less than 35% of shipments, creating space for Chinese stack providers and European SOFC specialists to win niche opportunities.
Key Report Takeaways
- By technology, polymer electrolyte membrane platforms retained 70.1% revenue in 2025, whereas solid oxide solutions are projected to expand at a 48.1% CAGR to 2031.
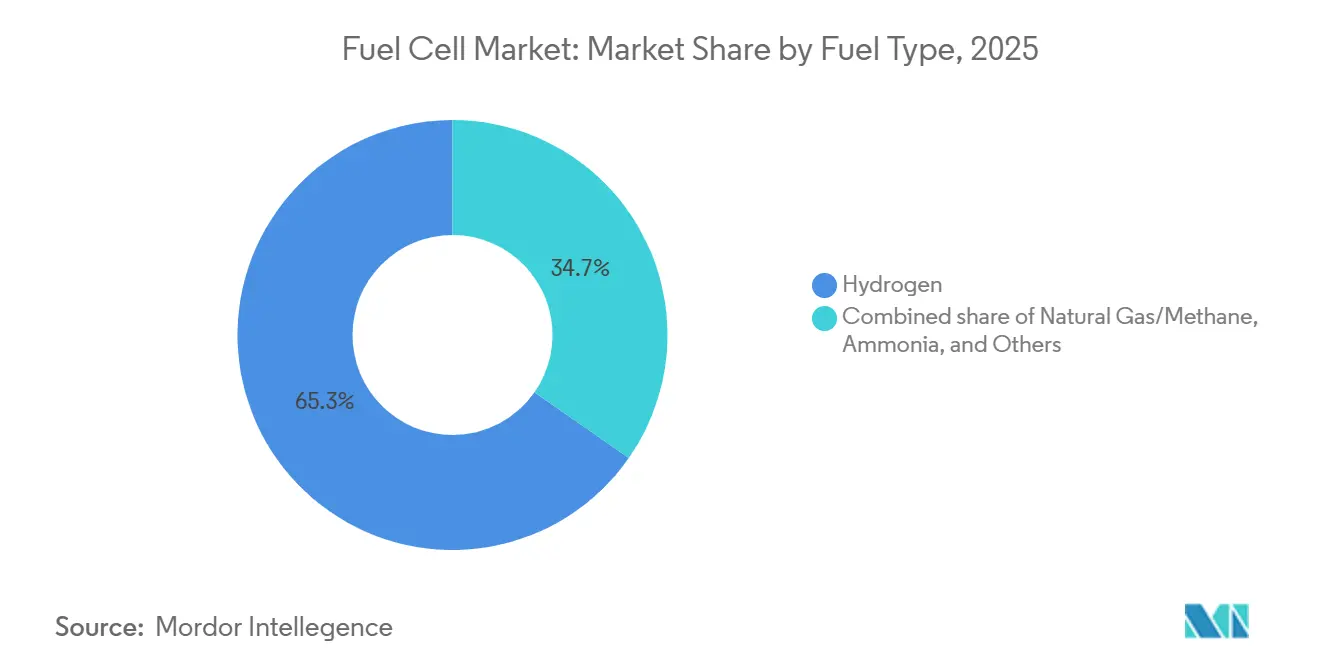
- By fuel type, hydrogen supplied 65.3% of the fuel cell market size in 2025, while ammonia-powered units are poised for a 51.8% CAGR over the outlook period.
- By application, vehicular systems accounted for 81.2% of fuel cell market share in 2025; stationary utilities are forecast to register a 44.3% CAGR through 2031.
- By end-user, transportation commanded 63.0% revenue in 2025; utilities will post the most rapid 44.3% CAGR through 2031.
- By geography, Asia-Pacific captured 57.5% revenue in 2025; the Middle East and Africa are forecast to achieve the highest 38.7% CAGR to 2031.
Note: Market size and forecast figures in this report are generated using Mordor Intelligence’s proprietary estimation framework, updated with the latest available data and insights as of January 2026.
Global Fuel Cell Market Trends and Insights
Drivers Impact Analysis*
| Driver | (~) % Impact on CAGR Forecast | Geographic Relevance | Impact Timeline |
|---|---|---|---|
| Falling Costs of Green & Blue Hydrogen Generation | 8.2% | Global, with early leadership in Middle East, Australia, Chile | Medium term (2-4 years) |
| Automaker Commitments to FCEVs in Asia-Pacific | 6.5% | Asia-Pacific core (Japan, South Korea, China), spillover to North America | Short term (≤ 2 years) |
| Government Zero-Emission Mandates in Heavy-Duty Transport (NA & EU) | 7.1% | North America & EU, with California and Germany as early adopters | Medium term (2-4 years) |
| Demand for Long-Duration Backup Power in Data Centers | 5.8% | Global, concentrated in North America, Northern Europe, Singapore | Short term (≤ 2 years) |
| Maritime Decarbonization Targets Accelerating Fuel Cell Adoption | 4.3% | Global, led by Europe (IMO compliance), Japan, South Korea | Long term (≥ 4 years) |
| Corporate Net-Zero Investment into On-Site Distributed Generation | 3.6% | North America, Europe, Japan | Medium term (2-4 years) |
| Source: Mordor Intelligence | |||


Falling Costs of Green & Blue Hydrogen Generation
Electrolyzer capital expenditure declined to USD 2,100 per kilowatt in 2025 and is projected to hit USD 1,494 by 2030, pushing levelized hydrogen prices below USD 2 per kilogram in solar-rich zones. This trajectory narrows the parity gap with diesel and natural gas, unlocking new opportunities for forklifts, telecom towers, and distributed generation. Blue hydrogen at USD 1.50-2.50 per kilogram remains viable where low-cost gas is available, offering a bridge until renewable supply scales. Sovereign-backed projects such as Saudi Arabia’s 600-tons-per-day NEOM complex de-risk early giga-scale facilities and create export benchmarks. Complementary renewable curtailment (California shed 2.4 TWh in 2024) provides negative-priced electricity windows that further lower hydrogen costs.[1]California ISO, “Monthly Load and Curtailment Report 2025,” caiso.com Together, these trends strengthen fuel cell market economics across mobility and stationary use cases.
Automaker Commitments to FCEVs in Asia-Pacific
Toyota targets 75,000 annual fuel cell units by 2030, and Hyundai is building a KRW 930 billion plant aiming for 30,000 units a year by 2027. These moves signal long-term confidence despite near-term retail softness; South Korean FCEV sales fell 27.2% in H1 2025. Third-generation Toyota stacks doubled durability to 10,000 hours and cut platinum loadings by 30%, trimming total cost of ownership for heavy trucks. Chinese provincial incentives of up to RMB 300,000 per vehicle partially offset the national subsidy phase-out, keeping captive bus and logistics fleets in play. Overall, committed production capacity anchors supply-chain investment and propels the fuel cell market toward scale.
Government Zero-Emission Mandates in Heavy-Duty Transport
The U.S. Environmental Protection Agency now requires 30% of vocational trucks and 40% of short-haul day cabs to be zero-emission by 2032, creating an addressable pool of 150,000 fuel cell trucks annually.[2]U.S. Environmental Protection Agency, “Clean Trucks Plan Final Rule 2024,” epa.gov Europe’s Regulation 2024/1610 imposes a 45% CO₂ cut for heavy vehicles by 2030 and 90% by 2040, pushing fleets to technologies with fast refuel times and high payload retention. California’s voucher program pays USD 240,000 per Class 8 fuel cell tractor, but rapid oversubscription underscores latent demand. Early movers like Nikola captured USD 58.2 million in vouchers for 72 trucks during Q3 2024. Mandates thus funnel public funds into vehicle subsidies and infrastructure, accelerating the fuel cell market uptake in freight corridors.
Demand for Long-Duration Backup Power in Data Centers
AI workloads are pushing rack densities toward 50-100 kW, exposing hyperscalers to grid constraints and diesel curtailment rules. Microsoft, Caterpillar, and Ballard validated a 1.5 MW hydrogen fuel cell system that delivered 48 hours of autonomy in January 2024.[3]Microsoft, “Hydrogen Fuel Cell Pilot Powers Datacenter,” microsoft.com Goldman Sachs estimates 8-20 GW of incremental power could migrate to fuel cells by 2030 if hydrogen logistics mature. Although PEM units are still priced at USD 1,800-2,000 per kW against diesel gensets at USD 450 per kW, net-zero targets and urban air-quality standards are driving pilots. Bloom Energy’s natural-gas SOFCs already serve 60% of North American stationary shipments, offering operators a transitional pathway. Collectively, these forces underpin a fast-growing data-center segment within the broader fuel cell market.
Restraints Impact Analysis*
| Restraint | (~) % Impact on CAGR Forecast | Geographic Relevance | Impact Timeline |
|---|---|---|---|
| Scarcity of Hydrogen Refueling Infrastructure Outside JP & KR | -5.4% | Global, most acute in North America (ex-California), Europe (ex-Germany), emerging Asia | Short term (≤ 2 years) |
| PGM & Nickel Price Volatility Inflating Stack Costs | -3.8% | Global, with supply concentration in South Africa (platinum), Russia (palladium, nickel) | Short term (≤ 2 years) |
| SOFC Performance Degradation in Maritime High-Sulfur Environments | -2.1% | Global maritime routes, particularly Asia-Europe and trans-Pacific | Long term (≥ 4 years) |
| Certification Gaps in US Building Codes Slowing Stationary Installations | -1.9% | United States (ex-California, New York), Canada | Medium term (2-4 years) |
| Source: Mordor Intelligence | |||
Scarcity of Hydrogen Refueling Infrastructure Outside Japan & South Korea
Japan operates 160 stations and South Korea 200, while the United States fields just 60, nearly all in California, and Europe tallies 250, with 40% in Germany. This uneven build-out confines passenger cars to fleet and pilot regions, suppressing broader adoption. China has 500 stations, but geography skews to coastal hubs, leaving inland provinces underserved. Capital costs of USD 2-4 million per site and high delivered hydrogen prices keep private investors cautious. California’s temporary closure of 15 stations during supply shortages in 2024 damaged consumer confidence, illustrating fragility at early rollout stages.[4]California Fuel Cell Partnership, “2024 Station Status Update,” cafcp.org
PGM & Nickel Price Volatility Inflating Stack Costs
Platinum swung from USD 950 to 1,100 per ounce between 2024-2025, while palladium spiked to USD 1,800 before settling under USD 1,000. PEM stacks use 0.3-0.5 g of PGMs per kW, so a 50% price shift lifts stack costs 15-20%. Nickel fluctuations, driven by Indonesian export policies, add further procurement risk. Supply concentration heightens geopolitical exposure, especially as sanctions threaten Russian palladium flows. Catalyst recycling and lower loading designs offer mitigation but need several years to permeate the installed base.
*Our forecasts treat driver/restraint impacts as directional, not additive. The impact forecasts reflect baseline growth, mix effects, and variable interactions.
Segment Analysis
By Technology: SOFC Gains on Efficiency Edge
Polymer electrolyte membrane designs delivered 70.1% of 2025 revenue by virtue of automotive dominance. However, solid oxide solutions are expected to realize a 48.1% CAGR to 2031, twice the pace of PEM, as utilities value 60% electrical efficiency and fuel flexibility. Bloom Energy’s platform operates on natural gas today and can transition to 100% hydrogen, lowering infrastructure hurdles. Alkaline systems hold a 4.2% share, confined to aerospace and submarine projects. Phosphoric acid, molten carbonate, and direct-methanol cells comprise the remainder but face competition from gas engines and lithium-ion storage. Innovations such as Ceres Power’s steel-cell architecture, which reduces manufacturing cost by 40%, are widening technology choices in the fuel cell market.
By Fuel Type: Ammonia Emerges for Maritime
Hydrogen supplied 65.3% of 2025 demand, undergirded by existing production infrastructure and broad stack compatibility. Natural-gas-derived hydrogen supports 26.9% of installations, mostly within North American stationary SOFC arrays, where pipeline availability lowers delivered costs. Ammonia, at an 8% baseline, is positioned for a 51.8% CAGR as maritime operators pivot toward zero-carbon bunkers. NYK Line and Samsung Heavy Industries expect to deploy ammonia-fueled SOFC vessels by 2028, leveraging a global ammonia trade network. Methanol and biogas occupy niche roles; each must overcome efficiency and impurity challenges before scaling within the wider fuel cell market.


By Application: Forklifts Anchor Vehicular Dominance
Vehicular systems represented 81.2% of the fuel cell market in 2025 and are forecast to post a 37.9% CAGR through 2031. Plug Power has deployed 70,000 hydrogen forklifts for Amazon and Walmart, leveraging three-minute refueling to outpace battery changeovers. Passenger cars now supply under 5% of volumes as OEMs shift focus toward buses, trucks, and specialized rail units. California and Germany each operate growing bus fleets, yet the total cost of ownership still needs subsidies to match diesel. Alstom’s 27 hydrogen trains in Lower Saxony exemplify traction where overhead electrification costs are prohibitive. Rail and marine remain modest today, but regulatory tailwinds indicate rising inclusion within the broader fuel cell market.
Stationary, portable, and micro-CHP solutions covered 18.8% of 2025 revenue and will expand at a 32.4% CAGR. Japan has installed 400,000 Ene-Farm residential units, but adoption elsewhere is limited by upfront prices near USD 15,000 per home. Data-center backup is the fastest-growing stationary niche, with Bloom Energy’s natural-gas system capturing 60% of North American shipments. Telecom towers and remote microgrids also contribute, though portable military systems remain a small slice. Overall, non-vehicular gains will help diversify the fuel cell market over the forecast horizon.
By End-User: Utilities Accelerate Fastest
Transportation commanded 63.0% revenue in 2025, spanning forklifts, buses, trucks, trains, and vessels. Utilities, however, will enjoy a 44.3% CAGR as grid operators adopt fuel cells for 100-1,000-hour storage that complements intermittent renewables. FuelCell Energy’s 40 MW Connecticut project demonstrates commercial viability using natural gas SOFCs. Commercial and industrial customers represent a 28.7% share, anchored by data-center and CHP installations. Defense and residential users contribute 8.3%: Japan’s Ene-Farm units illustrate mature micro-CHP, while U.S. programs rely on a 30% investment tax credit to boost residential uptake. These trends diversify demand across the fuel cell market.

Geography Analysis
Asia-Pacific secured 57.5% of revenue in 2025 and is forecast to compound at a 36.8% CAGR through 2031. Japan’s 160 refueling stations and 400,000 residential units spearhead adoption, while South Korea’s KRW 500 billion hydrogen roadmap backs domestic suppliers. China’s 500-station network and provincial subsidies sustain bus and logistics fleets amid retail softness. India and Southeast Asia trail in infrastructure, yet Australia’s renewable surplus positions it as a future export hub. Divergent OEM strategies - with Toyota expanding while Honda scales back - underscore uneven market confidence but collectively reinforce regional leadership within the fuel cell market.
North America accounted for 22.3% revenue in 2025 and is expected to grow at a 34.2% CAGR. California anchors infrastructure with 60 stations and USD 240,000 vehicle vouchers, complemented by the federal USD 3-per-kilogram hydrogen production credit. Plug Power’s forklift ecosystem dominates material handling, while Nikola targets long-haul freight. Canada’s 40% investment credit leverages hydro resources for green hydrogen, yet station networks outside Vancouver and Toronto remain sparse. Mexico’s early initiatives focus on cross-border trucking corridors. Policy continuity and electrolyzer cost declines will shape the region’s trajectory.
Europe held a 15.8% share in 2025. Germany’s 100 stations and IPCEI Hy2Tech funding underpin leadership, while Regulation 2024/1610 accelerates truck adoption. Nordic countries leverage renewable surpluses for export-oriented green hydrogen. Alstom’s trains in Lower Saxony and Lombardy validate rail traction. The UK and France trail in deployment density, reflecting fragmented strategies. The Middle East and Africa, at 4.4% share, will grow fastest at 38.7% CAGR, propelled by the USD 8.4 billion NEOM and USD 1 billion Masdar-ADNOC complexes that target 2026-2027 commissioning. South America, at a 2.5% share, remains an early stage, with Chile and Brazil positioning as export suppliers rather than domestic consumers.

Competitive Landscape
The fuel cell market remains fragmented, with the top five suppliers, Ballard, Plug Power, Bloom Energy, Toyota, and Hyundai, commanding under 35% of 2025 revenue. Plug Power leads North American forklifts, Bloom Energy controls 60% of stationary SOFC shipments, and automotive stacks cluster around Toyota and Hyundai. Strategic plays center on vertical integration and regional manufacturing: Ballard partnered with Linamar for Canadian stack output, Plug Power and Olin formed a U.S. electrolyzer joint venture, and Bloom Energy allied with SK ecoplant to localize Korean production. These collaborations secure supply continuity and tax-credit eligibility.
Technology disruptors target cost and performance gaps. Ceres Power’s metal-supported SOFC cuts manufacturing cost by 40%, PowerCell Sweden’s S3 stack achieves 4.4 kW per liter power density, and AFC Energy’s alkaline design reduces PGM dependence by 60%. Patent filings emphasize catalyst loading reduction, bipolar plate advances, and ammonia cracking. Market concentration is expected to rise as capital-heavy scale favors diversified conglomerates, yet specialized niches, marine, aerospace, and portable, will continue to support agile entrants.
The near-term pipeline includes Hyundai’s KRW 930 billion plant for 30,000 units annually by 2027, Toyota’s third-generation stack with 20% efficiency gains, and Canada’s 40% hydrogen production credit. These initiatives underscore an innovation cycle that is compressing costs and expanding addressable segments across the fuel cell market.
Fuel Cell Industry Leaders
Ballard Power Systems Inc.
Plug Power Inc.
FuelCell Energy Inc.
Bloom Energy Corporation
Doosan Fuel Cell Co., Ltd.
- *Disclaimer: Major Players sorted in no particular order

Recent Industry Developments
- May 2026: Researchers at the Institute of Science Tokyo have developed a machine-learning method to expedite the discovery of advanced fuel-cell catalysts.
- August 2025: At the 13th World Congress of the Econometric Society (ESWC 2025) in Seoul's COEX, Hyundai Motor Company showcased its expansive hydrogen vision alongside the introduction of its latest NEXO fuel cell electric vehicle (FCEV).
- June 2025: Honda kicked off production of the 2025 CR-V e:FCEV at its specialized Performance Manufacturing Center (PMC) in Marysville, Ohio. This marks the debut of America's first plug-in hydrogen fuel cell vehicle.
- April 2025: Honda, at the H2 & Fuel Cell Expo 2025 in Tokyo, showcased its next-gen fuel cell module. This module boasts a 150 kW output, is twice as durable, has triple the volumetric power density (enabling a more compact size), and is produced at half the cost of its predecessor.


Research Methodology Framework and Report Scope
Market Definitions and Key Coverage
According to Mordor Intelligence, the fuel cell market covers the revenue generated from newly manufactured electro-chemical devices that convert hydrogen, ammonia, methanol, or re-formed natural gas directly into electricity for stationary, vehicular, and portable power applications, while discharging only heat and water. Systems below 1 kW used in consumer gadgets and after-market retrofit kits are excluded.
Scope exclusion: electrolyzers, reformer-only skids, and battery-based range extenders fall outside our study.
Segmentation Overview
- By Technology
- Polymer Electrolyte Membrane Fuel Cell (PEMFC)
- Solid Oxide Fuel Cell (SOFC)
- Alkaline Fuel Cell (AFC)
- Others [Phosphoric Acid Fuel Cell (PAFC), Molten Carbonate Fuel Cell (MCFC), Direct Methanol Fuel Cell (DMFC)]
- By Fuel Type
- Hydrogen
- Natural Gas/Methane
- Ammonia
- Others (Methanol, Biogas)
- By Application
- Vehicular (Passenger Cars, Buses & Coaches, Trucks, Material Handling Equipment, Rail, Marine Vessels)
- Non-Vehicular (Stationary Power, Portable Power, Micro-Combined Heat & Power)
- By End-User Industry
- Transportation
- Utilities
- Commercial and Industrial
- Others (Defense, Residential)
- By Geography
- North America
- United States
- Canada
- Mexico
- Europe
- United Kingdom
- Germany
- France
- Spain
- NORDIC Countries
- Russia
- Rest of Europe
- Asia-Pacific
- China
- India
- Japan
- South Korea
- Malaysia
- Thailand
- Indonesia
- Vietnam
- Australia
- Rest of Asia-Pacific
- South America
- Brazil
- Argentina
- Colombia
- Rest of South America
- Middle East and Africa
- United Arab Emirates
- Saudi Arabia
- South Africa
- Rest of Middle East and Africa
- North America
Detailed Research Methodology and Data Validation
Primary Research
We validated secondary findings through interviews and structured surveys with stack manufacturers, membrane suppliers, mobility integrators, refuel-station developers, fleet operators, and government program managers across Asia-Pacific, North America, and Europe. These conversations clarified average selling prices, capacity utilization, subsidy pass-through rates, and real-world replacement cycles that desktop sources could not capture.
Desk Research
Our analysts began with multi-year data sets from tier-1 public sources such as the US Department of Energy's Hydrogen & Fuel Cell Office, the International Energy Agency's Hydrogen Tracking reports, Eurostat trade codes for HS-classified fuel-cell stacks, Japan's New Energy and Industrial Technology Development Organization, and patents mined through Questel. Company 10-K filings, investor decks, trade-association briefs (Hydrogen Council, Fuel Cell & Hydrogen Energy Association), and government subsidy ledgers rounded out the landscape. Select paid feeds, D&B Hoovers for OEM financials and Dow Jones Factiva for deal flow, gave timely revenue signals. This list is illustrative; many additional sources informed the evidence base.
Market-Sizing & Forecasting
The core model applies a top-down build that reconstructs demand from hydrogen vehicle parc counts, stationary MW additions, and portable shipment tallies, which are then priced using region-specific ASP curves. Supplier roll-ups and sample channel checks provide bottom-up sense checks, closing gaps caused by undisclosed private revenues. Five key variables, like FCEV stock, annual installed MW, global platinum index, refueling station count, and announced policy incentives, drive scenario inputs. Results are projected through 2030 via multivariate regression blended with ARIMA to reflect both policy shocks and price learning. Any regional data voids are bridged using nearest-market proxies that are subsequently stress-tested with expert respondents.
Data Validation & Update Cycle
Every draft passes anomaly scans and variance thresholds before a senior reviewer signs off. Models are refreshed annually, and interim updates are triggered by material events such as major subsidy revisions or stack price resets. A final desktop sweep occurs just before client delivery.
Why Mordor's Fuel Cell Baseline Stands Firm
Published estimates often diverge because firms stretch or shrink scope, convert currencies differently, or update at uneven cadences.
Key gap drivers here include whether portable chargers are counted, how learning-rate price declines are modeled, and if electrolyzer revenues are mixed in. Our disciplined scope alignment, annual refresh, and dual-check pricing keep Mordor's baseline dependable.
Benchmark comparison
| Market Size | Anonymized source | Primary gap driver |
|---|---|---|
| USD 8.19 B (2025) | Mordor Intelligence | - |
| USD 11.0 B (2025) | Global Consultancy A | Bundles electrolyzer sales and uses list prices, inflating totals |
| USD 5.66 B (2025) | Industry Analytics B | Counts stack hardware only; limited geographic coverage; constant-2023 USD |
| USD 12.75 B (2024) | Trade Journal C | Older base year and assumes uniform ASP decline without regional weighting |
In short, our model balances transparent scope, real transaction prices, and timely updates, giving decision-makers a baseline they can trace to concrete variables and replicate with confidence.


Key Questions Answered in the Report
What is the projected value of the fuel cell market by 2031?
The Fuel Cell Market size was valued at USD 8.19 billion in 2025 and is estimated to grow from USD 10.42 billion in 2026 to reach USD 50.64 billion by 2031, at a CAGR of 37.19% during the forecast period (2026-2031).
Which segment is expected to grow fastest within fuel cell applications?
Utilities are projected to expand at a 44.3% CAGR as operators seek multi-day storage solutions.
How fast will solid oxide fuel cell technology grow?
Solid oxide platforms are expected to register a 48.1% CAGR through 2031.
Which region currently leads revenue contribution?
Asia-Pacific captured 57.5% of global revenue in 2025.
What policy supports North American adoption?
The U.S. Inflation Reduction Act provides a USD 3-per-kilogram production credit for green hydrogen and generous investment tax credits for fuel cell projects.
Page last updated on:


