Renewable Fuel Market Size and Share
Market Overview
| Study Period | 2020 - 2030 |
|---|---|
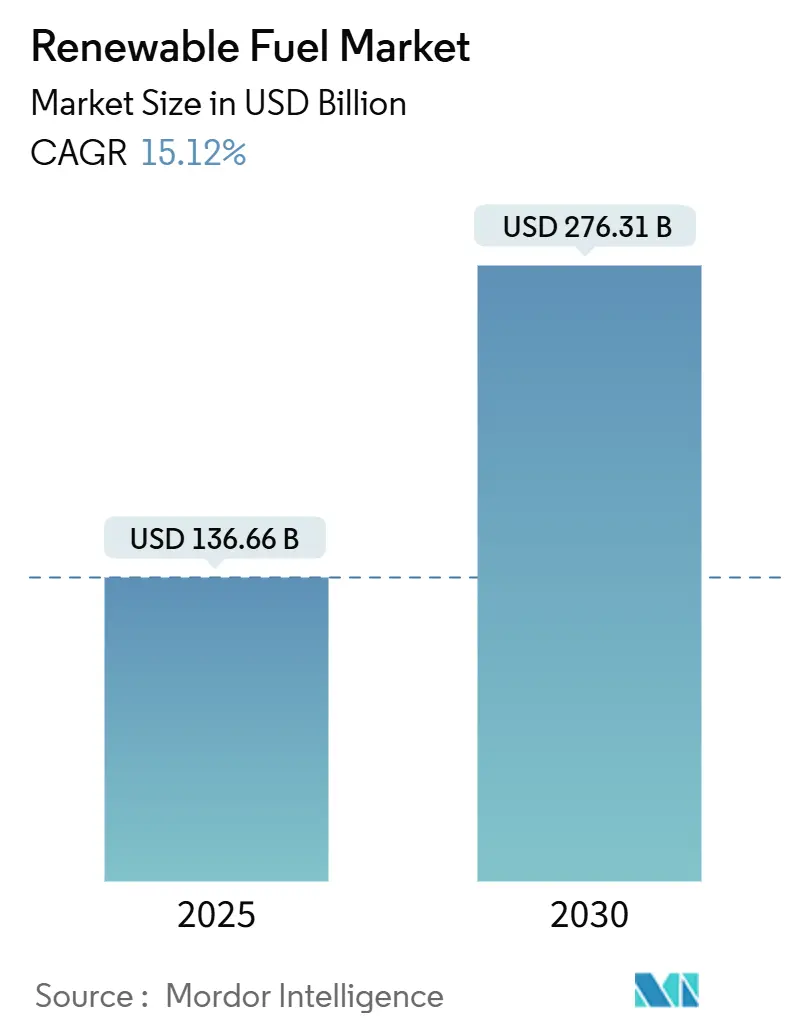
| Market Size (2025) | USD 136.66 Billion |
| Market Size (2030) | USD 276.31 Billion |
| Growth Rate (2025 - 2030) | 15.12% CAGR |
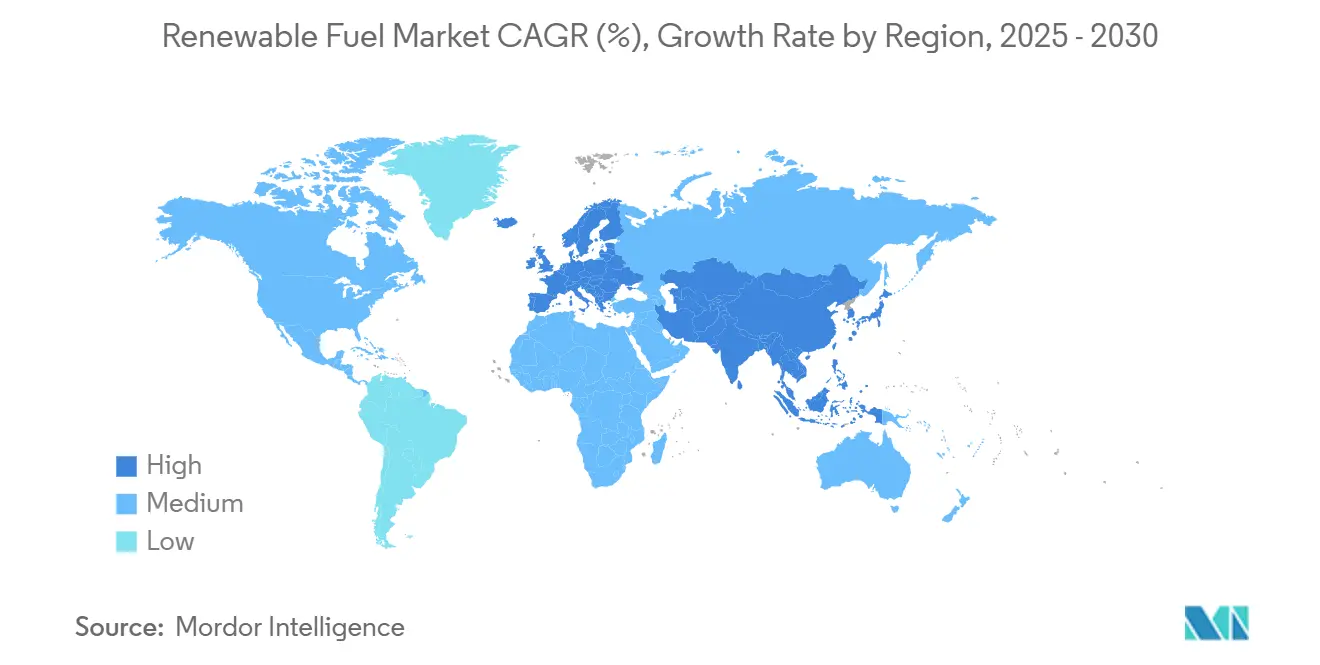
| Fastest Growing Market | Asia Pacific |
| Largest Market | North America |
| Market Concentration | Low |
Major Players *Disclaimer: Major Players sorted in no particular order Image © Mordor Intelligence. Reuse requires attribution under CC BY 4.0. | |
Renewable Fuel Market Analysis by Mordor Intelligence
The Renewable Fuel Market size is estimated at USD 136.66 billion in 2025, and is expected to reach USD 276.31 billion by 2030, at a CAGR of 15.12% during the forecast period (2025-2030).
This steady rise reflects how national energy-security goals now align with corporate decarbonization targets, giving producers the demand visibility that commodity markets rarely guarantee. Stringent policies in more than 75 countries and large, multi-year fuel contracts from aviation, shipping, and other hard-to-abate sectors help the market withstand swings in feedstock prices and evolving regulations. Several rules are reshaping competition. The Section 45Z clean-fuel credit takes effect in the United States in January 2025. California’s Low Carbon Fuel Standard seeks a 90% cut in fuel carbon intensity by 2045, and the European Union’s ReFuelEU plan will push sustainable aviation fuel content toward 63% by 2050. These measures unlock project financing for new capacity and create location-based cost advantages as policies diverge.
On the supply side, bioethanol still leads with a 45.3% share, yet green hydrogen is gathering pace as industries look beyond first-generation biofuels. Sugar crops account for roughly one-third of all feedstock, but waste-stream inputs expand faster because they earn sustainability premiums and face fewer regulatory hurdles. Road transport remains the backbone of demand at 85.7%, whereas aviation, growing at 36.7% a year, offers higher prices to suppliers that meet strict quality and emissions standards. Competition is heating up. Oil majors are repurposing existing refineries for renewable fuel, squeezing pure-play biofuel firms already coping with volatile feedstock costs. Technology pathways and regional markets stay fragmented; no company dominates, despite consolidation moves such as Waste Management’s takeover of Fulcrum BioEnergy’s assets following the latter’s bankruptcy. Key risks include swings in crop-oil prices, uncertainty around indirect land-use-change rules, and the need for upgraded infrastructure to distribute a wider array of low-carbon fuels.
Key Report Takeaways
- By fuel type, bioethanol led with 45.3% of the renewable fuel market share in 2024; green hydrogen is projected to expand at a 41.5% CAGR through 2030.
- By feedstock, sugar crops accounted for a 33.1% share of the renewable fuel market size in 2024, while the “Others” feedstock segment is forecast to grow at a 19.4% CAGR to 2030.
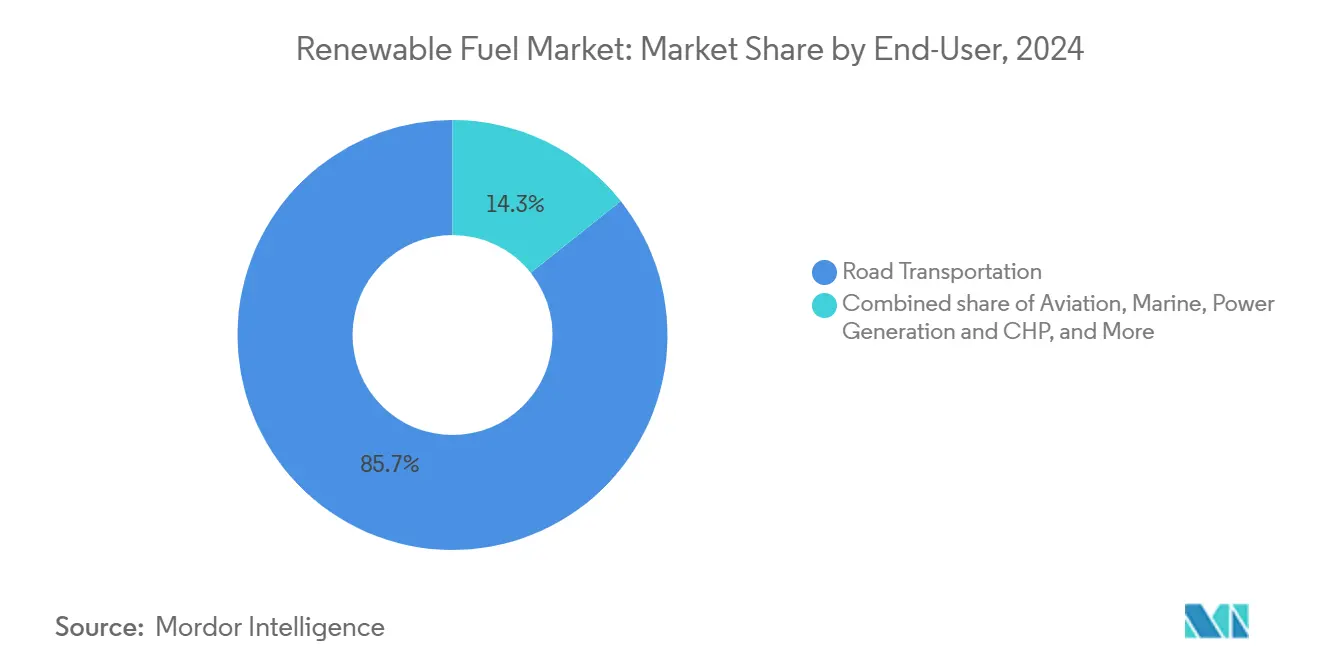
- By end-user, road transportation held an 85.7% share of the renewable fuel market in 2024; aviation demand is advancing at a 36.7% CAGR through 2030.
- By geography, North America commanded a 40.4% share of the renewable fuel market in 2024, whereas Asia-Pacific is on track for the highest regional growth at an 18.8% CAGR between 2025 and 2030.
Global Renewable Fuel Market Trends and Insights
Drivers Impact Analysis*
| Driver | (~) % Impact on CAGR Forecast | Geographic Relevance | Impact Timeline |
|---|---|---|---|
| Blending mandates expanding in >75 countries | 3.8% | Global, with early gains in EU, North America, ASEAN | Medium term (2-4 years) |
| Corporate net-zero commitments by hard-to-abate sectors | 2.9% | Global, concentrated in developed markets | Long term (≥ 4 years) |
| SAF tax credits & offtake agreements in U.S./EU | 2.1% | North America & EU | Short term (≤ 2 years) |
| Co-processing retrofits at existing refineries lower CAPEX | 1.7% | Global, with spillover to emerging markets | Medium term (2-4 years) |
| Drop-in renewable naphtha demand from petro-chemicals | 1.4% | Global, concentrated in petrochemical hubs | Medium term (2-4 years) |
| Blockchain-enabled feedstock traceability premiums | 0.9% | EU primary, spillover to North America | Long term (≥ 4 years) |
| Source: Mordor Intelligence | |||
Blending Mandates Expanding in Over 75 Countries
Over 75 national governments have enacted or tightened renewable fuel blending rules, making mandates the largest demand accelerator. The U.S. Environmental Protection Agency’s Set 2 rule raises domestic targets for 2026–2027 and cuts Renewable Identification Numbers for imports by 50% to favor local supply.(1)U.S. Environmental Protection Agency, “Renewable Fuel Standard: Extension of 2024 Compliance Deadline,” federalregister.gov British Columbia’s 2025 decision to double the diesel blending requirement to 8% and restrict non-Canadian supply underscores a trend toward domestic-content rules. Indonesia’s B30 biodiesel program and Malaysia’s parallel mandates anchor Southeast Asian demand and help insulate regional producers from price-driven export volatility. Collectively, these policies create predictable volumes that de-risk project financing and underpin capacity expansions. For producers, mandates translate into baseload demand even during commodity price downturns.
Corporate Net-Zero Commitments by Hard-to-Abate Sectors
Aviation, shipping, and energy-intensive industries are underwriting premium renewable fuel contracts to meet published net-zero roadmaps. Airlines have locked in more than USD 4 billion in SAF offtake agreements led by United, Delta, and American Airlines. Marine fuel demand is gathering momentum as the International Maritime Organization’s 2030 target approaches, while steel, cement, and chemicals players pilot bio-based process heat solutions. Long-dated offtake contracts give developers revenue certainty and improve debt terms. The resulting volume visibility attracts institutional capital that was previously hesitant to finance commodity-exposed biofuel plants. As hard-to-abate sectors internalize the price of carbon, premium demand segments are likely to command margin uplift relative to road-fuel pools.
SAF Tax Credits & Offtake Agreements in U.S./EU
The U.S. Section 45Z credit, worth USD 1.00 per gallon for transportation fuels and more for SAF, coupled with the EU’s ReFuelEU Aviation regulation mandating 2% SAF blending by 2025, has carved out a high-value niche within the renewable fuel market. Neste posted an 80% quarter-on-quarter jump in SAF volumes in Q1 2025, confirming the rapid demand ramp. U.S. developer USA Bioenergy secured a 20-year feedstock contract for its USD 2.8 billion Texas SAF plant, illustrating how policy clarity de-risks large build-outs. European airlines have begun passing SAF premiums to ticket prices, enhancing producer margins. Early movers capture policy-driven returns that will be harder to secure once capacity normalizes.
Co-Processing Retrofits at Existing Refineries Lower CAPEX
Retrofitting fossil refineries for renewable co-processing lowers capital intensity by leveraging installed utilities, hydrogen, and logistics systems. European majors have converted units in Germany, the Netherlands, and France, while U.S. companies such as Chevron Renewable Energy Group pursue similar paths. Operational flexibility allows plants to toggle between fossil and renewable slats based on feedstock pricing, smoothing earnings. The strategy narrows the cost gap versus greenfield biofuel plants and intensifies competition for standalone producers. As more refineries switch to dual-feed modes, global renewable fuel capacity could accelerate faster than headline project announcements suggest.
Restraints Impact Analysis*
| Restraint | (~) % Impact on CAGR Forecast | Geographic Relevance | Impact Timeline |
|---|---|---|---|
| Volatile feedstock prices linked to food-oil markets | -2.3% | Global, acute in Asia-Pacific and Europe | Short term (≤ 2 years) |
| Uncertain indirect land-use-change (ILUC) regulation | -1.8% | EU primary, spillover to North America | Medium term (2-4 years) |
| Slow ASTM approvals for novel SAF pathways | -1.2% | Global, concentrated in aviation markets | Medium term (2-4 years) |
| Pipeline & tank-farm material-compatibility issues | -0.8% | North America & Europe | Short term (≤ 2 years) |
| Source: Mordor Intelligence | |||
Volatile Feedstock Prices Linked to Food-Oil Markets
Used cooking and soybean oil prices hit multi-year highs in 2024, squeezing producer margins and driving Neste’s Q1 2025 renewable segment EBIT down to USD 310 per ton. Price spikes fuel the food-versus-fuel debate and invite regulatory scrutiny, as seen in California’s 2024 cap limiting seed oils to 20% of annual LCFS credits.(2)California Air Resources Board, “California Adopts Major LCFS Revisions,” arb.ca.gov Producers are countering volatility by diversifying into animal fats and waste oils, but collection infrastructure remains underdeveloped in many regions. Long-term supply contracts help mitigate risk but often require upfront capital for pre-processing facilities. Until large-scale advanced feedstocks reach commercial maturity, margin compression will remain a key earnings swing factor.
Uncertain Indirect Land-Use-Change (ILUC) Regulation
The European Union incorporates ILUC factors into renewable fuel sustainability scores, whereas U.S. policy—reinforced by the July 2025 “One Big Beautiful Bill Act”—excludes ILUC from Section 45Z calculations, creating policy asymmetry. Divergent standards complicate cross-border trade and limit the fungibility of compliance credits. Multinationals must design feedstock supply chains that satisfy the strictest market in which they operate, driving up compliance costs. Investors view ILUC uncertainty as a headline project risk, particularly for crop-based fuels in Europe. Harmonization efforts remain slow, exposing producers to regulatory whiplash when operating across jurisdictions.
*Our forecasts treat driver/restraint impacts as directional, not additive. The impact forecasts reflect baseline growth, mix effects, and variable interactions.
Segment Analysis
By Fuel Type: Hydrogen Disrupts Traditional Biofuel Hierarchy
Bioethanol held a 45.3% renewable fuel market share in 2024, reflecting entrenched blending mandates and mature supply chains. Green hydrogen, however, is forecast to deliver a 41.5% CAGR, the highest among all fuel types, supported by Morocco’s USD 32.5 billion mega-project and Australia’s USD 814 million Hydrogen Headstart program. Renewable diesel and SAF fetch premium margins thanks to drop-in compatibility with existing logistics systems and airline willingness to pay carbon-reduced premiums. European palm-oil phase-outs and tighter ILUC rules constrain biodiesel growth.
The renewable fuel market size for hydrogen is expected to eclipse biodiesel by 2029 as oil majors allocate multibillion-dollar budgets to electrolyzer-based production. Biogas and biomethane draw support from waste-management synergies, with Monterey Regional’s California landfill-to-RNG plant showcasing scalable economics. Bio-methanol remains niche, targeting marine dual-fuel engines. Overall, momentum is shifting toward fuels offering the largest lifecycle-emissions cuts per dollar of capital deployed.


By Feedstock: Waste Streams Command Premium Economics
Sugar crops supplied 33.1% of 2024 feedstock volumes, buoyed by Brazil’s sugarcane ethanol complex and European sugar-beet flexibility. Yet the “Others” feedstock bucket—covering municipal solid waste, algae, and novel residues—sports the fastest 19.4% CAGR as end-users reward low-ILUC pathways.
Renewable fuel market share derived from waste oils and animal fats is climbing despite collection bottlenecks that drive price spikes. Municipal solid waste conversion is proving bankable, evidenced by Enerkem’s Edmonton facility processing 40,000 tons a year into 5 million liters of ethanol.(3)Source: Enerkem, “Edmonton Waste-to-Biofuels Facility,” enerkem.com California and the EU Regulators are tightening seed-oil limits, further tilting economics toward non-food feedstocks. Producers who secure diversified supply contracts gain a structural cost advantage in volatile commodity cycles.
By End-User: Aviation Emerges as Premium Growth Vector
Road transportation absorbed 85.7% of renewable fuel demand in 2024, anchored by gasoline and diesel blending rules in the United States, Brazil, and the European Union. SAF, however, is forecast to grow at a 36.7% CAGR through 2030 as airlines lock in multiyear offtake deals to meet net-zero pledges.
Marine fuel adoption trails aviation but is accelerating in short-sea shipping lanes subject to regional carbon levies. Industrial heating and power-generation users adopt renewable molecules where electrification proves technically infeasible or capital-intensive. The renewable fuel market size for aviation is expected to quadruple by 2030, making it the fastest-growing demand pocket despite higher per-unit costs.
Geography Analysis
North America retained a 40.4% renewable fuel market share in 2024, buoyed by the U.S. Renewable Fuel Standard, California’s LCFS, and Canada’s Clean Fuel Regulation.(4)California Air Resources Board, “Final Statement of Reasons for LCFS Rulemaking,” arb.ca.gov Integrated supply chains and ready access to low-carbon feedstocks underpin competitive cost structures. The new Section 45Z producer credit provides price certainty through 2029, further incentivizing brownfield and greenfield expansions.
Asia-Pacific records the fastest regional growth on an 18.8% CAGR as Indonesia’s B30 biodiesel mandate scales, India advances toward a 20% ethanol blend by 2026, and China accelerates its green-hydrogen rollout. Japan and South Korea prioritize advanced fuels, including SAF and renewable diesel, to meet decarbonization targets in the aviation and maritime sectors.
Europe balances robust policy ambition with stringent sustainability filters. The Fit-for-55 package supports demand, but ILUC and palm-oil restrictions pressure crop-based pathways. Scandinavian refiners leverage abundant waste-oil supply chains, while Southern Europe focuses on lignocellulosic residues. South America capitalizes on sugarcane economics in Brazil and soy-derived biodiesel in Argentina, though export markets face tariff uncertainty. The Middle East and Africa remain nascent but show rising interest in green-hydrogen export hubs.

Competitive Landscape
The market remains moderately fragmented; the five largest players hold roughly 32% combined share, led by Neste, Valero (Diamond Green Diesel), Chevron Renewable Energy Group, ADM, and Cargill. Neste’s Rotterdam expansion will lift its renewable capacity to 6.8 million tons by 2027, reinforcing its position as the global leader. Valero reported USD 170 million operating income from renewable diesel in Q4 2024 despite feedstock inflation, underlining integrated refiners’ margin resilience.(5)Source: Valero Energy Corporation, “2024 Full-Year Results,” investorvalero.com
Strategic themes emphasize vertical integration and feedstock control. Darling Ingredients absorbed a USD 26.2 million Q1 2025 loss as its Diamond Green Diesel joint venture navigated the shift from blender to producer credits, highlighting policy-driven earnings sensitivity. Oil majors Shell, BP, and ExxonMobil are allocating material capital to green hydrogen and SAF, intensifying competition for project sites and feedstocks. Technology alliances, such as Honeywell-Johnson Matthey in SAF and LanzaTech-LanzaJet in alcohol-to-jet, are accelerating commercialization timelines. Start-ups focusing on municipal solid waste and algal feedstocks attract venture backing, but scaling remains hampered by capital intensity and permitting hurdles.
Renewable Fuel Industry Leaders
Neste
Valero
Chevron Renewable Energy Group
POET
TotalEnergies
- *Disclaimer: Major Players sorted in no particular order

Recent Industry Developments
- July 2025: The United States Congress enacted the “One Big Beautiful Bill Act,” expanding Section 45Z credits for SAF while restricting foreign feedstocks.
- July 2025: Neste posted EUR 174 million H1 2025 EBITDA, boosted by an 80% quarter-on-quarter rise in SAF volumes.
- June 2025: USA Bioenergy secured a 20-year feedstock contract for its USD 2.8 billion Texas SAF plant targeting 65 million gallons annually.
- May 2025: St1 Nordic launched the Gothenburg biorefinery and a biomethane joint venture targeting 3 TWh capacity by 2030.


Global Renewable Fuel Market Report Scope
| Bioethanol |
| Biodiesel |
| Renewable Diesel (HVO) |
| Sustainable Aviation Fuel (SAF) |
| Biogas/Biomethane |
| Green Hydrogen |
| Bio-methanol and Others |
| Sugar Crops (Sugarcane, Sugar Beet) |
| Starch Crops (Corn, Wheat, Cassava) |
| Oilseeds (Soy, Rapeseed, Palm) |
| Used Cooking Oil and Animal Fat |
| Lignocellulosic Agri-Residues |
| Algae |
| Municipal Solid Waste (MSW) |
| Others |
| Road Transportation |
| Aviation |
| Marine |
| Power Generation and CHP |
| Industrial Heating |
| North America | United States |
| Canada | |
| Mexico | |
| Europe | Germany |
| United Kingdom | |
| France | |
| Italy | |
| NORDIC Countries | |
| Russia | |
| Rest of Europe | |
| Asia-Pacific | China |
| India | |
| Japan | |
| South Korea | |
| ASEAN Countries | |
| Rest of Asia-Pacific | |
| South America | Brazil |
| Argentina | |
| Rest of South America | |
| Middle East and Africa | Saudi Arabia |
| United Arab Emirates | |
| South Africa | |
| Egypt | |
| Rest of Middle East and Africa |
| By Fuel Type | Bioethanol | |
| Biodiesel | ||
| Renewable Diesel (HVO) | ||
| Sustainable Aviation Fuel (SAF) | ||
| Biogas/Biomethane | ||
| Green Hydrogen | ||
| Bio-methanol and Others | ||
| By Feedstock | Sugar Crops (Sugarcane, Sugar Beet) | |
| Starch Crops (Corn, Wheat, Cassava) | ||
| Oilseeds (Soy, Rapeseed, Palm) | ||
| Used Cooking Oil and Animal Fat | ||
| Lignocellulosic Agri-Residues | ||
| Algae | ||
| Municipal Solid Waste (MSW) | ||
| Others | ||
| By End-User | Road Transportation | |
| Aviation | ||
| Marine | ||
| Power Generation and CHP | ||
| Industrial Heating | ||
| By Geography | North America | United States |
| Canada | ||
| Mexico | ||
| Europe | Germany | |
| United Kingdom | ||
| France | ||
| Italy | ||
| NORDIC Countries | ||
| Russia | ||
| Rest of Europe | ||
| Asia-Pacific | China | |
| India | ||
| Japan | ||
| South Korea | ||
| ASEAN Countries | ||
| Rest of Asia-Pacific | ||
| South America | Brazil | |
| Argentina | ||
| Rest of South America | ||
| Middle East and Africa | Saudi Arabia | |
| United Arab Emirates | ||
| South Africa | ||
| Egypt | ||
| Rest of Middle East and Africa | ||


Key Questions Answered in the Report
What is the projected value of the renewable fuel market in 2030?
The market is forecast to reach USD 276.31 billion by 2030, reflecting a 15.12% CAGR from 2025.
Which fuel type will grow the fastest through 2030?
Green hydrogen leads with a projected 41.5% CAGR, overtaking several conventional biofuels.
Which region is expected to record the highest growth?
Asia-Pacific is forecast to post the strongest regional expansion at an 18.8% CAGR thanks to rising mandates and large-scale hydrogen projects.
Why are SAF volumes accelerating so quickly?
SAF benefits from generous U.S. Section 45Z tax credits, mandatory EU blending targets, and multi-year airline offtake agreements that guarantee premium pricing.
How are refiners entering the renewable fuel space?
Conventional refiners retrofit existing units for co-processing, minimizing CAPEX while exploiting installed hydrogen, utilities, and logistics networks.
What is driving volatility in renewable fuel margins?
Rapid fluctuations in waste-oil and soybean-oil prices, coupled with evolving seed-oil usage caps, compress producer margins and heighten supply-chain risk.
Page last updated on:


