Second Generation Biofuels Market Size and Share
Market Overview
| Study Period | 2019 - 2030 |
|---|---|
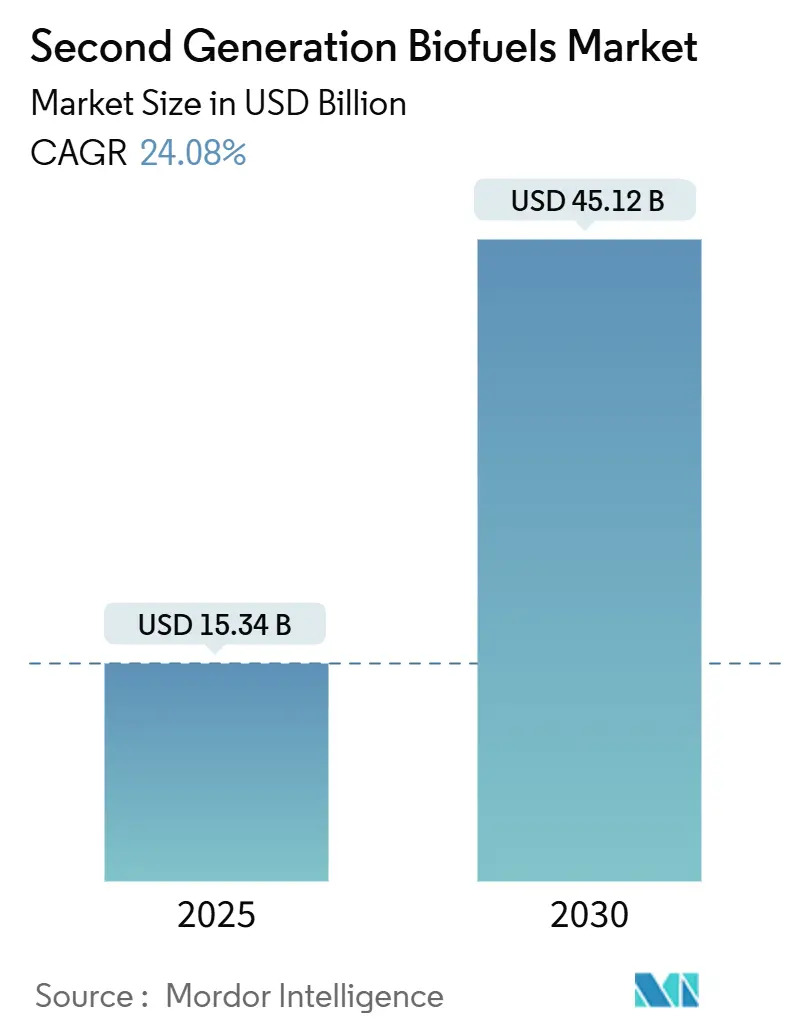
| Market Size (2025) | USD 15.34 Billion |
| Market Size (2030) | USD 45.12 Billion |
| Growth Rate (2025 - 2030) | 24.08% CAGR |
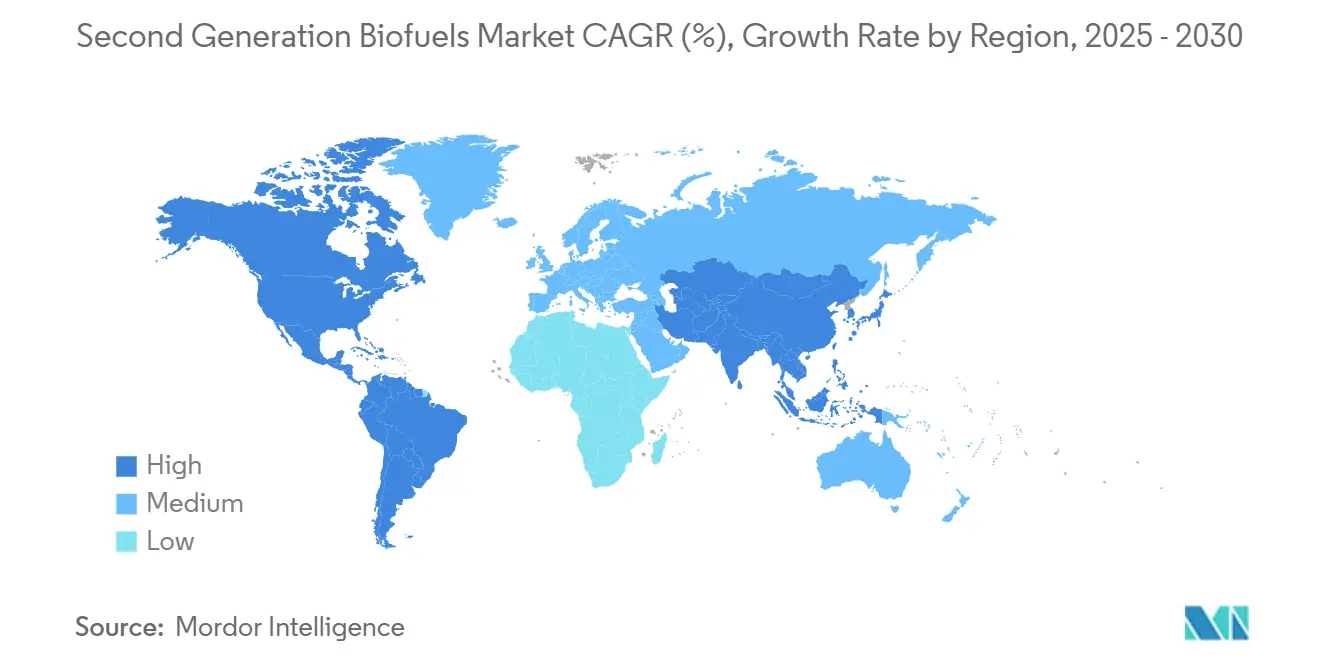
| Fastest Growing Market | Asia Pacific |
| Largest Market | North America |
| Market Concentration | Medium |
Major Players *Disclaimer: Major Players sorted in no particular order Image © Mordor Intelligence. Reuse requires attribution under CC BY 4.0. | |
Second Generation Biofuels Market Analysis by Mordor Intelligence
The Second Generation Biofuels Market size is estimated at USD 15.34 billion in 2025, and is expected to reach USD 45.12 billion by 2030, at a CAGR of 24.08% during the forecast period (2025-2030).
Rapid policy convergence, large airline offtake agreements, and 30% processing-cost declines in cellulosic pathways form the growth backbone. Binding mandates such as the EU RED III 5.5% advanced share requirement and Japan’s 10% SAF target guarantee a minimum demand floor, giving financiers unprecedented visibility.[1]DieselNet, “RED III and SAF Mandates,” dieselnet.com Technology gains in enzymatic hydrolysis, distributed preprocessing, and synthetic-biology lipid platforms are shrinking production costs while enabling smaller plants closer to residue sources. Simultaneously, BECCS credit monetization and rising carbon prices increase revenue streams, offsetting feedstock logistics risk. Consolidation among oil majors, exemplified by multibillion-dollar refinery conversions, signals that mainstream energy players now view second-generation biofuels as core decarbonization assets.
Key Report Takeaways
- By feedstock, lignocellulosic biomass led with 39.4% revenue share in 2024, whereas algae is forecast to expand at a 33.4% CAGR to 2030.
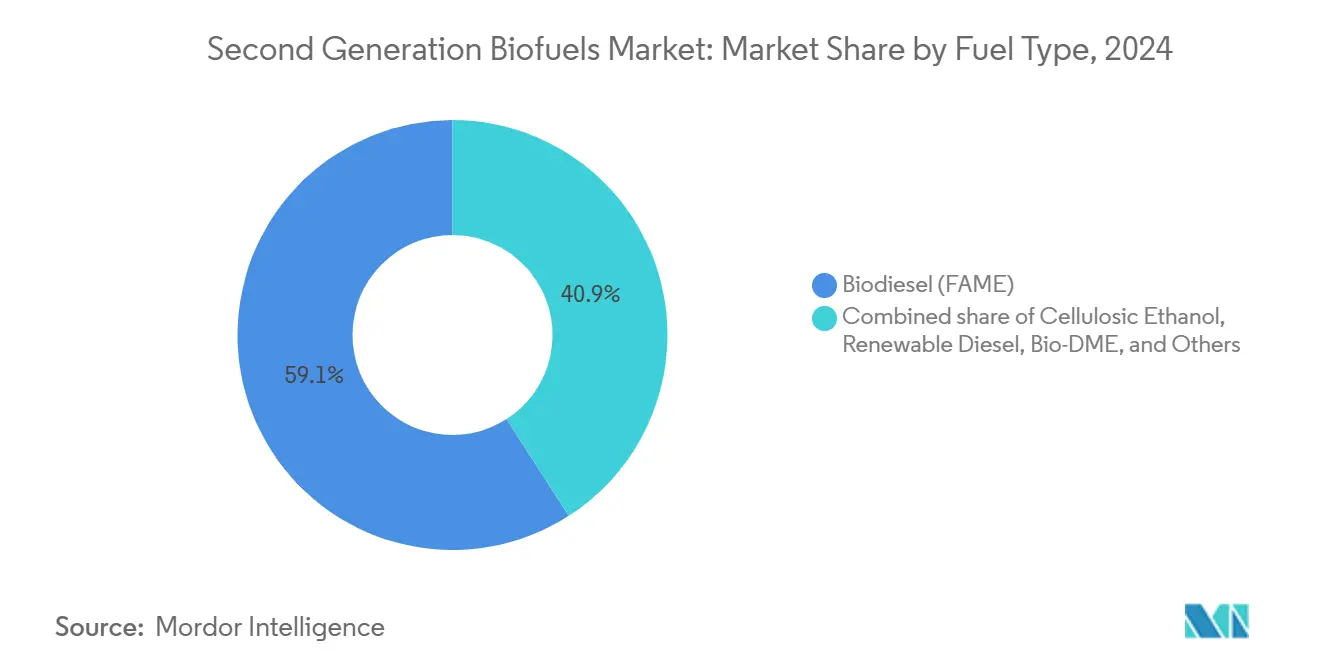
- By fuel type, biodiesel held 59.1% of the second-generation biofuels market share in 2024, while sustainable aviation fuel is projected to rise at a 32.2% CAGR through 2030.
- By end use, road transportation accounted for a 67.9% share of the second-generation biofuels market size in 2024, and aviation is advancing at a 30.5% CAGR to 2030.
- By geography, North America captured a 40.2% share in 2024, and Asia-Pacific is on track for the fastest 29.8% CAGR between 2025-2030
Global Second Generation Biofuels Market Trends and Insights
Drivers Impact Analysis*
| Driver | (~) % Impact on CAGR Forecast | Geographic Relevance | Impact Timeline |
|---|---|---|---|
| Government mandates & blending targets | 4.20% | EU, North America, Asia-Pacific | Medium term (2-4 years) |
| Decarbonization push in aviation | 3.80% | Global hubs | Long term (≥ 4 years) |
| Enzyme & pretreatment cost cuts | 3.10% | US, EU | Short term (≤ 2 years) |
| Lignocellulosic residue abundance | 2.90% | Agricultural regions worldwide | Medium term (2-4 years) |
| BECCS-linked credit revenues | 2.70% | EU, UK, North America | Long term (≥ 4 years) |
| Synthetic-biology lipid leaps | 4.50% | US, EU | Medium term (2-4 years) |
| Source: Mordor Intelligence | |||
Government Mandates & Blending Targets
Regulations in the EU, UK, Japan, and Singapore have removed demand uncertainty by establishing hard blending floors that exclude high-ILUC feedstocks. Doubled counting for advanced molecules lifts price realizations, encouraging capital deployment. Combined mandates exceed 15 million tonnes annually, equivalent to nearly half the 2024 global output. The mechanisms also enable credit stacking with carbon markets, widening project IRR cushions. Producers prioritize jurisdictions with clear compliance timelines because lenders assign lower risk premiums to such markets. The alignment of Asian and Western policies gives the second-generation biofuels market a globally harmonized baseline for the first time.
Decarbonization Push in Aviation (SAF Demand)
Airlines have signed binding offtake deals surpassing 60 billion gallons through 2030. SAF currently commands 2-4x the price of fossil jet fuel, but airlines accept the premium to safeguard slot access at airports imposing green-fuel quotas. ReFuelEU ratchets requirements to 63% by 2050, creating a long visibility window. United Airlines alone has contracted 1.5 billion gallons, catalyzing bankable project pipelines. These commitments redefine SAF from an ESG gesture to a compliance imperative, fundamentally shifting capital flows into the second-generation biofuels market.
Cost Reductions via Enzyme & Pretreatment Advances
Novel cellulases from the CelOCE program cut enzyme loads by 30%, and CELF pretreatment raises sugar yields to 90% while slashing energy demand by 25%.[2]Oak Ridge National Laboratory, “Billion-Ton Report 2023,” ornl.gov Such gains close the cost gap with fossil diesel to within 10 cents per liter. Lower energy intensity also means smaller reactors, enabling modular plants sized for 50-100 kiloton annual output. The technology leap lets developers colocate facilities with agricultural clusters, shrinking feedstock delivery radii and logistics costs.
Abundant Lignocellulosic Residue Availability
The 2023 DOE Billion-Ton Report confirms 564 million metric tons of accessible U.S. residues, adequate for 60-85 billion gallons of SAF.[3]National Institutes of Health, “Co-solvent Enhanced Lignocellulosic Fractionation Studies,” pmc.ncbi.nlm.nih.gov Brazil and Colombia add more than 100 million tons from bagasse and palm waste. The challenge lies in synchronizing harvest peaks with continuous plant operations. Distributed preprocessing hubs that pelletize residues have cut haulage expense by 40% and equalize monthly supply, unlocking higher plant utilizations even for the largest facilities.
Restraints Impact Analysis*
| Restraint | (~) % Impact on CAGR Forecast | Geographic Relevance | Impact Timeline |
|---|---|---|---|
| High CAPEX & scale-up risk | -3.20% | Global | Medium term (2-4 years) |
| Fragmented feedstock logistics | -2.80% | Developing regions | Short term (≤ 2 years) |
| Slow commercialization track record | -2.50% | North America, EU | Long term (≥ 4 years) |
| EU probes on Asian HVO imports | -1.70% | EU-Asia corridor | Short term (≤ 2 years) |
| Source: Mordor Intelligence | |||
High CAPEX & Scale-Up Risk of Cellulosic Biorefineries
Greenfield plants cost USD 200-300 million, with mega projects such as USA BioEnergy’s USD 2.8 billion Texas complex raising financing barriers. Lenders demand 20-30% contingency buffers to cover enzyme variability and feedstock heterogeneity. Thus, equity tickets are often restricted to oil majors, reducing competitive diversity.
Fragmented Feedstock Supply Logistics
Residue collection involves thousands of farmers within a 75-mile radius, elevating coordination expense. Low bulk density forces higher truck counts, lifting delivered cost 15-20%.[4]BioEnergy KDF, “Residue Logistics Costs,” bioenergykdf.netl.doe.gov Standardized bale specifications and preprocessing depots are alleviating but not eliminating the problem, particularly in emerging markets with limited rural roads.
*Our forecasts treat driver/restraint impacts as directional, not additive. The impact forecasts reflect baseline growth, mix effects, and variable interactions.
Segment Analysis
By Feedstock: Lignocellulosic Stability Meets Algae Upsurge
The second-generation biofuels market size for lignocellulosic routes is USD 6.04 billion in 2024, equal to 39.4% of overall revenue. Residue accessibility, mature pretreatment know-how, and co-location with grain belts keep the segment resilient, though seasonal bunching of corn stover and wheat straw necessitates large storage silos that push capex upward. Forestry offcuts supply a year-round alternative but require chipped-wood logistics solutions, adding 5-7 USD per ton. Municipal solid waste is becoming a credible EU feedstock after policy relaxation frees 44 million tons for fuel applications.
Algae contributes a much smaller base yet records a 33.4% CAGR, poised to outpace all residue classes from 2025 onward. Synthetic-biology improvements triple lipid productivity, while closed-loop photobioreactors cut land demand to one-tenth of open ponds. Country incentives in Singapore and the UAE now reimburse up to 30% of capex for seawater-based algae farms, narrowing the cost gap with residue routes. Multifeedstock flexibility is therefore emerging as a procurement hedge for refiners that aim to withstand future carbon score differentials and certification audits.
By Fuel Type: SAF Momentum Challenges FAME Supremacy
Biodiesel retained 59.1% revenue leadership in 2024 thanks to entrenched blending in road transport. Yet its growth moderates because many nations plateau at B20-B30 ceilings. Sustainable aviation fuel races ahead, turning a 32.2% CAGR into the second-generation biofuels market's biggest volume addition by 2030. Airlines willingly sign ten-year take-or-pay contracts, allowing developers to secure project finance at lower spreads. Renewable diesel (HVO) capitalizes on refinery retrofits that deliver drop-in compatibility without engine conversion, with planned global capacity set to double by 2026. Bio-butanol and bio-DME remain niche, constrained by tankage modifications and limited filling infrastructure.


By End Use: Aviation Surges Beyond Road
Road transport still contributes 67.9% revenue due to mandated diesel substitution, but expansion decelerates in regions adopting electric cars. Aviation eclipses other segments with a 30.5% CAGR, supported by ReFuelEU trajectories that escalate quota to 63% by mid-century. Marine fuel interest grows after IMO sulfur caps, spurring investments in renewable methanol bunkering along the Panama and Suez routes. Industrial heat remains opportunistic, leveraging low-grade residues in combined heat and power units where gas supply is intermittent.
Geography Analysis
North America leads with 40.2% share, strengthened by the U.S. Renewable Fuel Standard and USD 1.01 per gallon cellulosic credit. The region’s agricultural heartland provides dense residue catchments that minimize haulage. Clean Fuel Regulations in Canada add incremental pull, while Mexico’s nascent mandates open a contiguous logistics corridor from Manitoba to Veracruz. Yet prior scale-up misses temper investor appetites, compelling innovators like Gevo and LanzaTech to lock in sovereign-backed loan guarantees before final investment decisions.
Asia-Pacific exhibits the highest 29.8% CAGR and is expected to almost match North America in revenue by 2030. Japan’s 10% SAF rule, Singapore’s 1% biofuel obligation, and China’s 50,000-ton output target underpin the policy framework. Feedstock diversity, from Indonesian palm empty fruit bunches to Indian rice straw, reduces supply risk. Refining giants in South Korea and Malaysia are aggressively converting hydrocrackers to HVO, a move supported by lower labor and construction costs that trim capex 15-20% relative to Western builds.
Europe maintains a regulated though uncertain setting. RED III boosts the advanced quota to 5.5%, but anti-dumping screens on Asian imports distort price signals, potentially uplifting domestic residue routes. Carbon prices north of EUR 80 per ton improve project economics, and BECCS pilots in Sweden show 90% capture efficiencies with stable process yields. Nevertheless, limited regional feedstock pools keep Europe reliant on cross-border supply unless municipal waste conversion scales faster.

Competitive Landscape
Market structure is moderately fragmented, with the top five producers controlling roughly 35% of installed capacity. Oil majors such as BP, TotalEnergies, and Valero are absorbing independents to secure feedstock and certification expertise. Neste operates multi-continent pretreatment and refining hubs, using proprietary NEXBTL catalysts for superior yield. LanzaTech and Gevo license gas fermentation and alcohol-to-jet platforms, earning upfront fees and volume-based royalties that scale without heavy balance-sheet exposure.
The technology race remains intense. Enzyme suppliers partner with refiners to tie chemistry updates directly into offtake agreements. Start-ups leveraging synthetic biology gain traction by delivering double-digit yield improvements that retrofit seamlessly into existing units. Meanwhile, logistics aggregators build rural depot networks to bale, pelletize, and densify residues, selling ready feedstock under long-term contracts that de-risk supply for plants within 75 miles. Strategic alliances between these nodes are shrinking delivered cost curves and nudging the second-generation biofuels market toward mainstream commodity status.
M&A activity rose 40% in 2024, highlighted by PETRONAS-Enilive-Euglena’s USD 300 million Malaysian venture and Valero’s stake in a Texas cellulosic complex. Competitive pressure now hinges less on scale and more on carbon intensity scores. Facilities integrating BECCS or running on renewable power achieve lower lifecycle emissions, winning lucrative airline contracts that set minimum CI thresholds. Players without such features risk relegation to bulk diesel blending markets with tighter margins.
Second Generation Biofuels Industry Leaders
Neste Oyj
POET-DSM Advanced Biofuels
Clariant AG
Enerkem
DuPont Industrial Biosciences
- *Disclaimer: Major Players sorted in no particular order

Recent Industry Developments
- January 2025: LanzaTech announced a USD 50 million partnership with Microsoft to apply AI in gas fermentation optimization, targeting 15-20% cost reduction.
- December 2024: Gevo secured a USD 1.46 billion DOE loan guarantee for its Net-Zero 1 SAF plant in South Dakota.
- November 2024: Gevo secured a USD 1.46 billion DOE loan guarantee for its Net-Zero 1 SAF plant in South Dakota.
- November 2024: PETRONAS, Enilive, and Euglena unveiled a USD 300 million Malaysian biorefinery designed for 650,000 tonnes annual SAF output.


Global Second Generation Biofuels Market Report Scope
| Lignocellulosic Biomass |
| Agricultural Residues |
| Forestry Residues |
| Algae |
| Municipal Solid Waste |
| Cellulosic Ethanol |
| Biodiesel (FAME) |
| Renewable Diesel (HVO) |
| Bio-DME |
| Bio-Butanol |
| Sustainable Aviation Fuel (ATJ, HEFA) |
| Road Transportation |
| Aviation |
| Marine |
| Industrial and Power |
| North America | United States |
| Canada | |
| Mexico | |
| Europe | United Kingdom |
| Germany | |
| France | |
| Spain | |
| Nordic Countries | |
| Russia | |
| Rest of Europe | |
| Asia-Pacific | China |
| India | |
| Japan | |
| South Korea | |
| ASEAN Countries | |
| Australia and New Zealand | |
| Rest of Asia-Pacific | |
| South America | Brazil |
| Argentina | |
| Colombia | |
| Rest of South America | |
| Middle East and Africa | United Arab Emirates |
| Saudi Arabia | |
| South Africa | |
| Egypt | |
| Rest of Middle East and Africa |
| By Feedstock | Lignocellulosic Biomass | |
| Agricultural Residues | ||
| Forestry Residues | ||
| Algae | ||
| Municipal Solid Waste | ||
| By Fuel Type | Cellulosic Ethanol | |
| Biodiesel (FAME) | ||
| Renewable Diesel (HVO) | ||
| Bio-DME | ||
| Bio-Butanol | ||
| Sustainable Aviation Fuel (ATJ, HEFA) | ||
| By End-Use | Road Transportation | |
| Aviation | ||
| Marine | ||
| Industrial and Power | ||
| By Geography | North America | United States |
| Canada | ||
| Mexico | ||
| Europe | United Kingdom | |
| Germany | ||
| France | ||
| Spain | ||
| Nordic Countries | ||
| Russia | ||
| Rest of Europe | ||
| Asia-Pacific | China | |
| India | ||
| Japan | ||
| South Korea | ||
| ASEAN Countries | ||
| Australia and New Zealand | ||
| Rest of Asia-Pacific | ||
| South America | Brazil | |
| Argentina | ||
| Colombia | ||
| Rest of South America | ||
| Middle East and Africa | United Arab Emirates | |
| Saudi Arabia | ||
| South Africa | ||
| Egypt | ||
| Rest of Middle East and Africa | ||


Key Questions Answered in the Report
What is the projected revenue for second generation biofuels in 2030?
The second generation biofuels market is set to reach USD 45.12 billion by 2030.
Which fuel type is expanding fastest?
Sustainable aviation fuel records the highest 32.2% CAGR between 2025 and 2030.
How large is lignocellulosic feedstock’s current contribution?
Lignocellulosic biomass holds 39.4% revenue share in 2024.
Why are airlines investing in SAF despite higher cost?
Airline contracts secure supply to meet binding mandates, and premiums offset carbon compliance risks.
Which region is growing quickest?
Asia-Pacific leads growth with a projected 29.8% CAGR through 2030.
How do BECCS credits improve project economics?
Negative-emission payments add USD 50-80 per ton of captured CO₂, raising overall plant revenues.
Page last updated on:


