Market Overview
| Study Period | 2021 - 2031 |
|---|---|
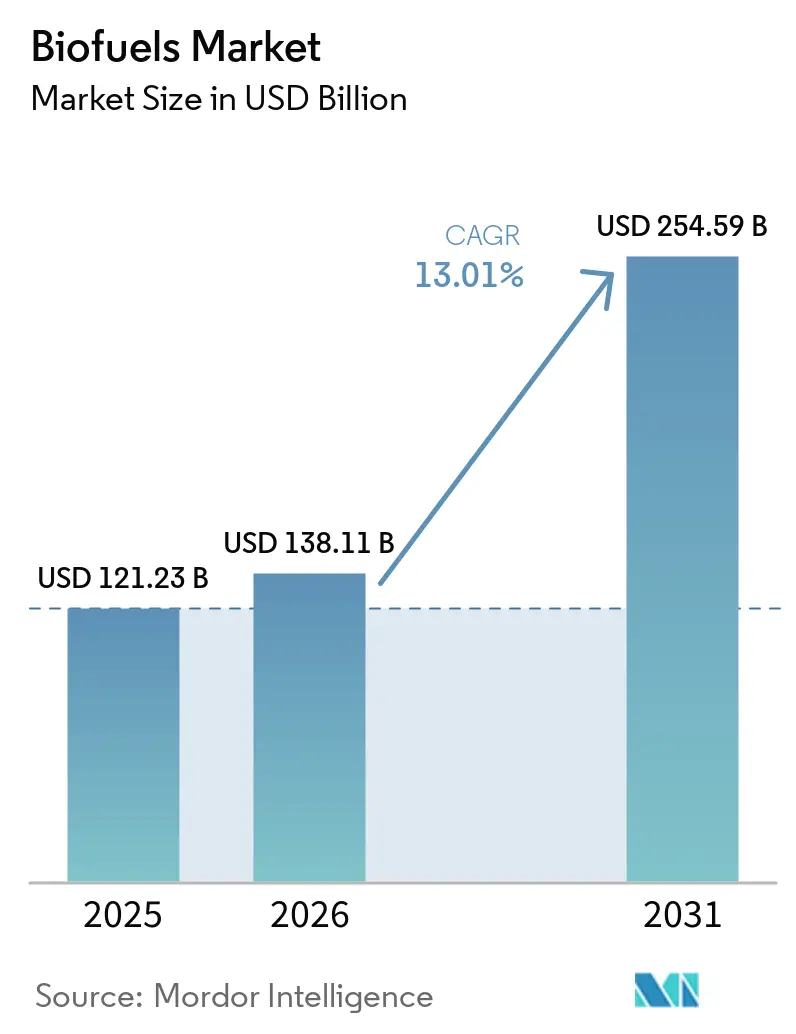
| Market Size (2026) | USD 138.11 Billion |
| Market Size (2031) | USD 254.59 Billion |
| Growth Rate (2026 - 2031) | 13.01% CAGR |
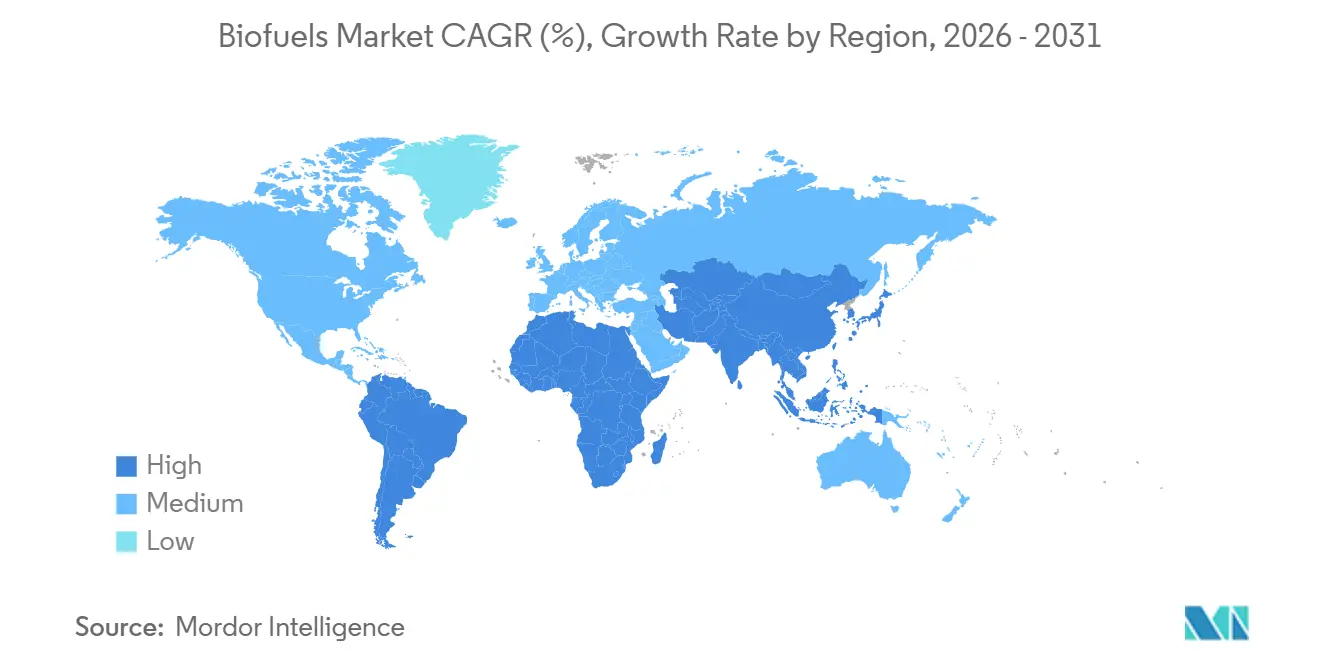
| Fastest Growing Market | Asia Pacific |
| Largest Market | North America |
| Market Concentration | Medium |
Major Players *Disclaimer: Major Players sorted in no particular order Image © Mordor Intelligence. Reuse requires attribution under CC BY 4.0. | |
Biofuels Market Analysis by Mordor Intelligence
The Biofuels Market size is projected to expand from USD 121.23 billion in 2025 and USD 138.11 billion in 2026 to USD 254.59 billion by 2031, registering a CAGR of 13.01% between 2026 to 2031.
Expansion stems from government blend mandates across Asia-Pacific and South America, escalating corporate offtake agreements for renewable diesel in North America, and strict European Union rules that exclude high-ILUC feedstocks. Airlines are accelerating sustainable aviation fuel procurement to comply with net-zero pledges, while refiners pivot toward hydrotreatment technology that yields high-cetane drop-in fuels. Venture-backed synthetic-biology platforms are entering commercial production, intensifying competition for used cooking oil and other waste streams. At the same time, feedstock substitution toward animal fats and algae is gaining momentum as producers seek compliance credits and double-counting benefits under RED III.
Key Report Takeaways
- By fuel type, bioethanol led with 51.4% of the global biofuels market share in 2025, while Sustainable Aviation Fuel (SAF) is projected to grow at 35.1% through 2031.
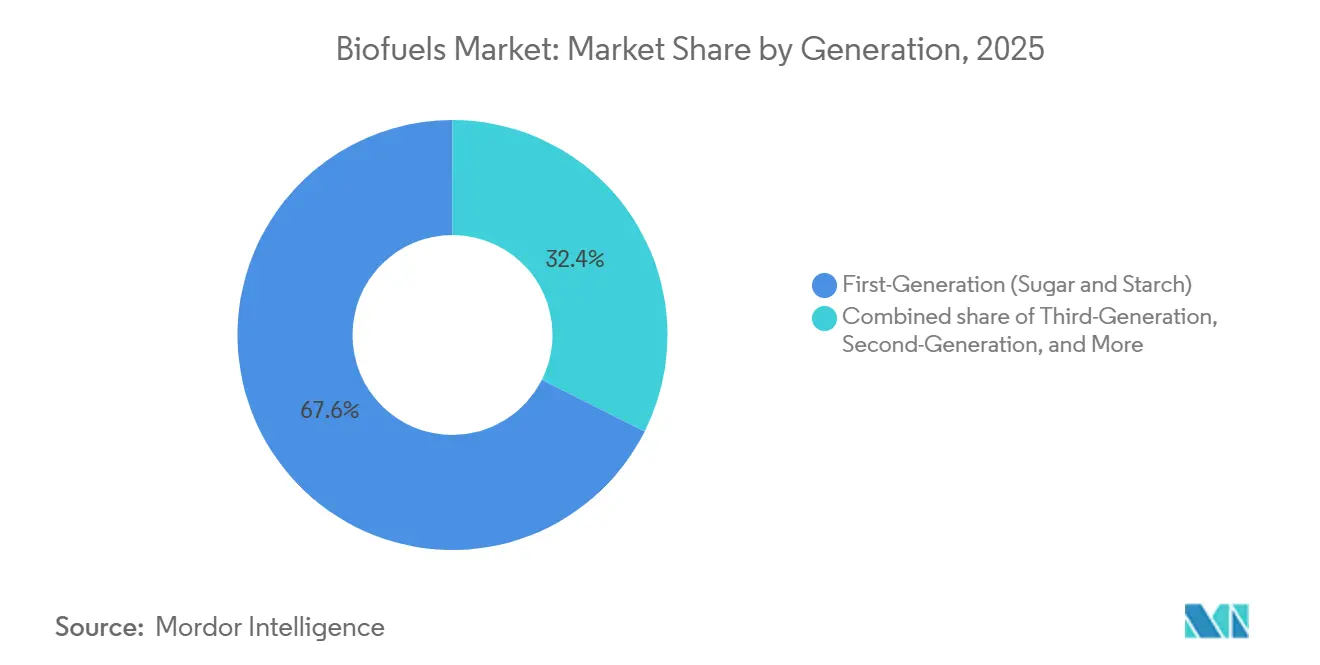
- By generation, first-generation (sugar & starch) accounted for 67.9% of the market in 2025, while third-generation (algae-based) is projected to expand at a 16.3% CAGR through 2031.
- By feedstock, sugar crops (sugarcane, sugar beet) held 35.5% of the global biofuels market share in 2025, and algae is projected to grow at 17.4% CAGR over the forecast period (2026-2031).
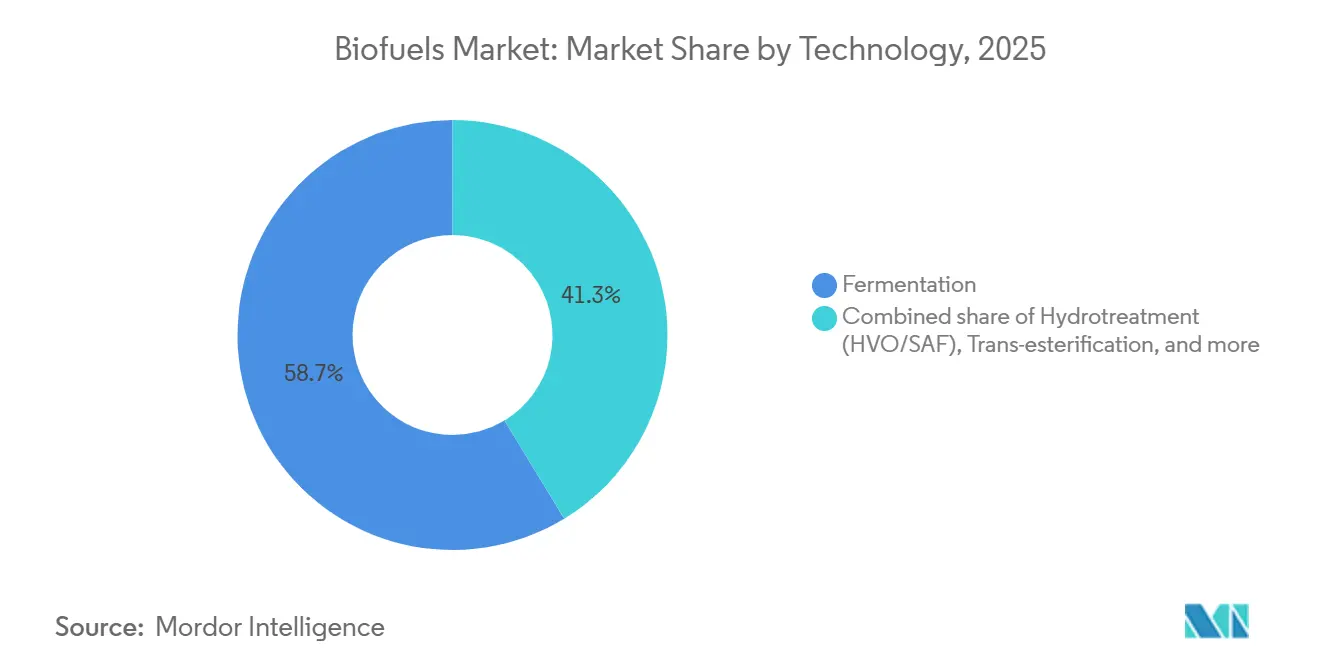
- By technology, the fermentation segment led the market with 58.7% share in 2025, while hydrotreatment (HVO/SAF) is expected to grow the fastest at 18.2% CAGR through 2031.
- By end-use sector, road transport captured 86.9% revenue share in 2025, while aviation is projected to post a 35.5% CAGR to 2031.
- By geography, North America held 37.8% of 2025 revenue; Asia-Pacific is expected to grow at 17.2% CAGR through 2031.
Note: Market size and forecast figures in this report are generated using Mordor Intelligence’s proprietary estimation framework, updated with the latest available data and insights as of 2026.
Global Biofuels Market Trends and Insights
Drivers Impact Analysis*
| Driver | (~) % Impact on CAGR Forecast | Geographic Relevance | Impact Timeline |
|---|---|---|---|
| Transport-sector blend mandates intensifying in Asia & South America | 3.20% | India, Indonesia, Thailand, Brazil, Argentina | Medium term (2-4 years) |
| Net-zero-aligned corporate PPAs driving renewable diesel demand in North America | 2.80% | United States, Canada | Short term (≤ 2 years) |
| SAF tax incentives in EU & U.S. Inflation Reduction Act | 3.50% | North America, Europe, Middle East hubs | Long term (≥ 4 years) |
| Phasing-out of palm-based feedstocks prompting algae & waste-oil investments in EU | 1.90% | Germany, France, Denmark, United States | Medium term (2-4 years) |
| Emergence of bio-naphtha for petro-chem feedstock decarbonization | 0.80% | Europe, Asia-Pacific clusters | Long term (≥ 4 years) |
| Source: Mordor Intelligence | |||
Transport-Sector Blend Mandates Intensifying in Asia & South America
India advanced its E20 ethanol target to 2025, lifting national blending to 12% in 2025 and sparking large-scale sugarcane and grain distillery investments.[1]Ministry of Petroleum and Natural Gas, “Ethanol Blending Status Report 2025,” petroleum.gov.in Indonesia’s B35 mandate absorbed about 9.5 million t of crude palm oil in 2025, shielding growers from global price swings.[2]Reuters, “Indonesia Implements B35 Mandate,” reuters.com Brazil maintained its E27 gasoline blend, while Argentina reinstated B10 biodiesel, redirecting 1.2 million t from export markets. Thailand approved four new cassava-to-ethanol plants totaling 400 million L y-1 in 2025 to meet B10 and E20 programs. These mandates secure long-term offtake, lower financing spreads, and underpin regional demand growth for the biofuels market.
Net-Zero-Aligned Corporate PPAs Driving Renewable Diesel Demand in North America
Corporate fleets locked in multi-year renewable diesel supply, with Neste reporting that 40% of 2025 North American sales flowed through power-purchase-style contracts.[3]Neste Corporation, “NEXBTL Technology Licensing Brochure 2025,” neste.com Chevron’s Diamond Green Diesel JV delivered over 1 billion gal in 2025, half under fixed-volume agreements to Amazon and UPS.[4]Chevron Corporation, “Soy Crush JV Announcement,” chevron.com California LCFS credits of USD 0.80-1.20 gal rewarded waste-oil-derived HVO, and Canada’s Clean Fuel Regulations spurred a 35% rise in U.S. renewable diesel imports during 2025. The PPA structure transfers volumetric risk from refiners to end users, stabilizing cash flows and accelerating hydrotreatment retrofits, reinforcing growth of the global biofuels market.
SAF Tax Incentives in EU & U.S. Inflation Reduction Act
The U.S. Section 40B credit provides USD 1.25-1.75 gal for SAF achieving ≥50% lifecycle emission cuts, catalyzing six new plant FIDs in 2025 totaling 1 billion gal y-1. Europe’s ReFuelEU Aviation rule mandates 2% SAF at EU airports by 2025, scaling to 70% by 2050, creating a captive 3-4 million t demand pool by 2030. Airlines responded: United contracted 1.5 billion gal over 20 years, and Air France-KLM secured 800 million L from TotalEnergies. Tax credits and mandates shrink the SAF green premium below USD 1 gal by 2026, accelerating uptake and supporting rapid expansion of the global biofuels market.
Phasing-Out of Palm-Based Feedstocks Prompting Algae & Waste-Oil Investments in EU
RED III capped high-ILUC feedstocks at 2019 levels and schedules a palm-oil phase-down to zero by 2030. UCO imports into the EU climbed 22% y-y to 3.2 million t in 2025. Neste processed 2.8 million t of waste and residue feedstocks, representing 92% of its 2025 slate. Eni’s Gela biorefinery eliminated virgin vegetable oils in 2024, and venture funding in algae lipid technology touched USD 420 million in 2025. Double-counting credits and stricter ILUC caps push European producers to diversify feedstocks, reinforcing the sustainability of the biofuels market.
Restraints Impact Analysis*
| Restraint | (~) % Impact on CAGR Forecast | Geographic Relevance | Impact Timeline |
|---|---|---|---|
| Volatile feedstock prices (soy, rapeseed, UCO) squeezing producer margins | -1.80% | North America, Europe, global spot markets | Short term (≤ 2 years) |
| Infrastructure bottlenecks in collecting agri-residues in India & Indonesia | -1.20% | India, Indonesia, Sub-Saharan Africa | Medium term (2-4 years) |
| Indirect land-use-change sustainability caps in Europe | -0.90% | Europe, South America, Southeast Asia exporters | Long term (≥ 4 years) |
| Competition from drop-in e-fuels in long-haul aviation | -0.70% | Europe, Middle East corridors | Long term (≥ 4 years) |
| Source: Mordor Intelligence | |||
Volatile Feedstock Prices Squeezing Producer Margins
Used cooking-oil quotations in Europe climbed to EUR 1,350-1,500 t in 2025 after anti-dumping probes constrained Chinese exports, tightening supply just as hydrotreaters ramped demand. Soybean-oil futures on the Chicago Board of Trade oscillated between USD 0.52 and 0.68 lb, peaking at USD 0.72 during South American droughts that reduced crush volumes by 8%. Rapeseed-oil benchmarks tracked similar volatility at EUR 950-1,150 t on shrinking Canadian canola flows and food-sector competition. Refining spreads narrowed to USD 0.15-0.25 gal in 2025, down from USD 0.40-0.50 in 2023, forcing three U.S. and EU biodiesel plants totaling 180 million gal y-1 to shut or idle. The margin squeeze is steering producers toward long-term offtake and backward integration, yet fragmented waste-oil collection keeps hedging options limited, tempering near-term growth of the biofuels market.
Infrastructure Bottlenecks in Collecting Agri-Residues in India & Indonesia
India’s cellulosic targets require 2-3 billion L of residue-based ethanol annually, yet transport from farm gate to distillery costs INR 2,500-3,500 t (USD 30-42), equal to 40-50% of the delivered price. Bharat Petroleum’s 100 million L Panipat plant operated at 60% utilization in 2025 because the straw supply dropped during the monsoon months and faced competition from brick kilns. Indonesia recovers less than 20% of its 80 million t annual palm residues, as smallholder estates lack aggregation hubs and weather-proof storage. Under-collection delays second-generation scale-up, prolonging dependence on first-generation sugar and starch feedstocks. Unless logistics subsidies and farmer co-ops mature quickly, residue bottlenecks will restrain the biofuels market through the late 2020s.
*Our forecasts treat driver/restraint impacts as directional, not additive. The impact forecasts reflect baseline growth, mix effects, and variable interactions.
Segment Analysis
By Fuel Type: SAF Surges as Drop-In Diesel Consolidates
Global sustainable aviation fuel recorded 600 million L in 2025 and is projected to grow at 35.1% CAGR, the fastest among all fuels, while bioethanol retained 51.4% of the biofuels market share in 2025. Biodiesel and renewable diesel together controlled about 35% of volume, but hydrotreatment is taking share from trans-esterification because of superior cold-flow and NOx performance. SAF uptake remains below 1% of jet-fuel pool, yet multidecade offtake deals totaling 1.5 billion gal by United Airlines alone confirm demand visibility.
Road fleets prefer renewable diesel because it uses existing pipelines and engines, eliminating blend walls that cap ethanol at E10-E15. California LCFS premiums allowed HVO to price at 30-40 c gal above FAME in 2025 without losing volume. Bio-naphtha lags at <2% but enjoys petrochemical interest as crackers seek low-carbon feed. The current fuel-type split signals a two-track future: mature ethanol and FAME plateau in saturated markets, while SAF and HVO drive incremental biofuels market size growth over the next decade.
By Generation: First-Gen Scale, Third-Gen Momentum
First-generation pathways kept 67.6% of the biofuels market share in 2025, reflecting entrenched sugarcane and corn value chains. Second-generation cellulosic fuels contribute under 10% amid high enzyme costs and straw logistics. Third-generation algae fuels are earning 16.3% CAGR as European refiners pilot photobioreactors that satisfy ILUC-free criteria.
Policy credits under RFS and RED III lift advanced categories, yet the capex of USD 4-6 gal of annual capacity stalls bankability. Venture equity is flowing into synthetic-biology routes that ferment steel off-gas to ethanol, but global output stays below 100 million L. The contrast shows a strategic tension: first-gen volume secures immediate compliance, whereas advanced generations promise longer-term resilience of the biofuels market once costs fall.


By Feedstock: Sugarcane Dominates, Waste Oils and Algae Expand
Sugar crops supplied 35.5% of feedstock in 2025, led by Brazil’s 400 million t cane crush, feeding the ethanol program. Starch crops, corn, wheat, and cassava stood near 25%, anchored in U.S. Midwest ethanol plants processing 5.4 billion bushels. Oilseeds filled roughly 22%, but palm oil lost EU market access under ILUC rules, shifting volume to Asian biodiesel.
Used cooking oil and animal fats captured 12-14% and qualify for double credits, narrowing their cost gap despite tight supply. Algae lipids, though <1% today, post the segment’s quickest rise at 17.4% CAGR on photobioreactor scale-ups funded by EUR-denominated green bonds. Feedstock diversity improves supply security and aligns with stricter sustainability audits, underpinning future biofuels market size expansion.
By Technology: Hydrotreatment Leads Advanced Build-Out
Fermentation retained 58.7% of production in 2025 because corn and cane ethanol plants offer low capex of USD 1.5-2 gal capacity. Hydrotreatment units for HVO and SAF, however, are scaling at 18.2% CAGR as refiners retrofit existing diesel hydrotreaters and license processes like Neste’s NEXBTL that convert waste oils into high-cetane fuel.
Trans-esterification lingers at 18-20% volume but loses share as FAME’s cold-flow limits curb high-latitude use. Gasification-FT and pyrolysis deliver niche outputs; capital intensity of USD 6-10 gal capacity restricts widespread adoption despite feedstock flexibility. Technology migration toward hydrotreatment secures drop-in compatibility, boosting biofuels market share within heavy-duty and aviation segments.
By End-Use Sector: Aviation Gains on Flat Road Demand
Road transport consumed 86.9% of biofuels in 2025, yet growth is flattening as electric vehicles captured 18-20% of new car sales in Europe and China. Aviation’s slice is modest today but rises at 35.5% CAGR, with ReFuelEU mandating 2% SAF in 2025 and 6% by 2030. Marine bunkering trials of B30-B50 blends proceed, but ISO 8217 limits keep penetration below 5%.
Heavy-duty trucks embrace renewable diesel because it substitutes 100% for petroleum diesel, smoothing fleet decarbonization without engine modification. Long-haul airlines treat SAF as the only near-term route to net-zero before e-fuels scale, driving contractual offtakes that underpin new plant financing. Power generation and heating demand are shrinking in Europe as wind and solar undercut biomass, though Brazilian bagasse cogeneration remains profitable. The sectoral pivot means aviation will contribute an outsized share of incremental biofuels market size growth from 2026 onward.
Geography Analysis
North America retained the largest regional position with 37.8% of global revenue in 2025, supported by a biofuels market size of USD 52 billion and LCFS credit prices that averaged USD 150-180 t CO₂e in California. U.S. renewable diesel capacity rose by 1.2 billion gal between 2024 and 2025 after Marathon, Chevron, and Phillips 66 completed refinery conversions, while Canada’s Clean Fuel Regulations lifted U.S. exports 35% in the same period. Federal Section 40B tax credits worth up to USD 1.75 gal pushed six SAF projects to final investment decision, locking in offtake agreements with United Airlines and Alaska Airlines that cover more than 1 billion gal through 2045. Mexico’s 2024 energy market reform opened the door for renewable diesel imports along the Bajío corridor, yet the lack of domestic incentives means penetration will trail the United States and Canada this decade. Altogether, the region’s strong policy architecture stabilizes the biofuels market despite slower gasoline demand as electric-vehicle sales accelerate.
Asia-Pacific is forecast to lead growth at 17.2% CAGR through 2031, expanding its biofuels market size from USD 28 billion in 2026 to USD 63 billion by 2031. India lifted ethanol blending to 12% in 2025 and advanced its E20 target to 2025, requiring 10-12 billion L of annual supply and stimulating investment in grain-based distilleries and residue ethanol plants. Indonesia’s B35 program absorbed 9.5 million t of palm oil in 2025 and is evaluating B40 for public-transport fleets in Jakarta and Surabaya. Thailand approved four cassava-to-ethanol distilleries totaling 400 million L y-1, and China’s National Development and Reform Commission cleared four cellulosic plants to tap corn stover in Heilongjiang. Japan and South Korea remain import-dependent, contracting SAF from Singapore and the U.S. Gulf Coast to meet voluntary airline pledges.
Europe contributed 22-24% of 2025 revenue yet saw blend volumes plateau as rising electric-vehicle adoption curbed gasoline demand; however, the region still commanded 28% of global SAF offtake contracts thanks to ReFuelEU Aviation. RED III’s palm-oil phase-out forced refiners toward used cooking oil and animal fats, lifting UCO imports 22% y-y to 3.2 million t. TotalEnergies converted its La Mède refinery to 500 000 t y-1 of renewable diesel and SAF, and Eni completed a similar transition in Livorno. Scandinavia channels surplus forestry residues into renewable heat and exports HVO, while the U.K. doubled RTFO rewards for SAF post-Brexit. The Middle East and Africa together held about 5% of the biofuels market share in 2025, anchored by South African sugarcane ethanol and Egyptian jatropha pilots, but SAF demand is rising at Gulf hubs as Emirates and Qatar Airways source compliant fuel for EU departures.

Competitive Landscape
Integrated oil majors and pure-play specialists form a moderately concentrated field, with the five largest producers controlling about 38% of global renewable diesel and SAF capacity. Neste leverages its proprietary NEXBTL hydrotreatment process to supply more than 2.8 million t of waste-based feedstock in 2025 and licenses the technology to Marathon Petroleum, securing recurring royalties. Chevron deepened vertical integration by acquiring Renewable Energy Group and by launching a USD 600 million soy-crush joint venture with Bunge that will feed its Geismar biorefinery from 2027. TotalEnergies and Eni converted legacy refineries in France and Italy to renewable diesel and SAF, locking in 15-year offtake with Air France-KLM and European carriers.
Emerging disruptors employ synthetic-biology and waste-gas fermentation to undercut incumbent cost structures. LanzaTech commissioned a 50 million L plant in Belgium that converts ArcelorMittal’s blast-furnace CO into ethanol, while Gevo secured a USD 1.5 billion DOE loan guarantee for its Net-Zero 1 corn-to-SAF project in South Dakota that will achieve net-negative life-cycle emissions of –40 g CO₂e MJ. Fulcrum BioEnergy’s Nevada facility gasifies municipal solid waste into jet fuel, validating an alternative pathway that avoids agricultural feedstocks. Ørsted and European Energy are piloting 50 000 t y-1 bio-methanol that blends electrolysis hydrogen with biogenic CO₂, targeting Maersk’s methanol-powered fleet.
Technology differentiation is sharpening competitive moats. Patent filings in low-cost enzymatic hydrolysis jumped 18% in 2025, led by Novozymes-Chr. Hansen and DuPont, as developers, try to cut enzyme cost below USD 0.30 gal ethanol, a tipping point for cellulosic viability. Compliance platforms that trace waste oil provenance via blockchain are becoming table stakes for securing premium buyers under ISO 22095 and ISCC; Neste, Eni, and Cargill have each rolled out digital chain-of-custody systems. Smaller regional players such as Verbio, Aemeti,s and Pacific Biodiesel carve niches through local feedstock networks or location-specific policy advantages, but long-term competitiveness hinges on sustainable, low-carbon feedstock access.
Biofuels Industry Leaders
Archer Daniels Midland Co.
POET LLC
Neste Oyj
BP p.l.c. / BP Bunge Bioenergia
Valero Energy Corp.
- *Disclaimer: Major Players sorted in no particular order


Recent Industry Developments
- January 2026: Corteva and BP announced the formation of a 50:50 joint venture, Etlas™, to produce crop-based oils such as canola, mustard, and sunflower for sustainable aviation fuel (SAF) and renewable diesel. Etlas aims to produce up to 1 million tons per year of feedstock by the mid-2030s, addressing global renewable fuel demand and enhancing agricultural feedstock supply chains.
- June 2025: EQT entered exclusive negotiations to acquire a majority stake in Waga Energy, a French producer of renewable natural gas (RNG/biomethane) that converts landfill gas into grid-ready biomethane. The proposed deal, involving approximately 54.1% of shares and 65.9% of voting rights, aims to accelerate Waga Energy’s global expansion and strengthen its position in the low-carbon bioenergy sector.
- April 2025: VARO Energy reached an agreement to acquire Preem, Sweden’s largest energy company with substantial renewable fuel production capabilities. This acquisition accelerates VARO’s growth in advanced renewable fuels, increasing its renewable diesel and SAF co-processing capacity. The combined assets and feedstock capabilities position VARO to become one of Europe’s leading renewable fuel producers.
- January 2025: Bayer acquired camelina germplasm, intellectual property, and materials from Smart Earth Camelina Corp to advance biofuel feedstock development. Camelina, a low-carbon intermediate oilseed crop, supports the production of renewable diesel and SAF while providing farmers with additional revenue opportunities and contributing to transportation decarbonization efforts.


Global Biofuels Market Report Scope
Biofuels usually refer to liquid fuels and blending elements produced from biomass materials called feedstocks. Most biofuels are used as transportation fuels, but they may also be used for heating and electricity generation. Due to its replenishable attributes, biofuel is considered a renewable energy source. It is affordable and an alternative to petroleum or other fossil fuels. It can be used as an energy source for vehicles and industrial applications. The global biofuel market scope includes:
By Fuel Type
| Bioethanol |
| Biodiesel (FAME) |
| Renewable Diesel / HVO |
| Sustainable Aviation Fuel (SAF) |
| Bio-naphtha and Other Drop-in Biofuels |
By Generation
| First-Generation (Sugar & Starch) |
| Second-Generation (Cellulosic) |
| Third-Generation (Algae-based) |
| Fourth-Generation (Synthetic Biology/Photobiological) |
By Feedstock
| Sugar Crops (Sugarcane, Sugar Beet) |
| Starch Crops (Corn, Wheat, Cassava) |
| Oilseeds (Soy, Rapeseed, Palm) |
| Used Cooking Oil and Animal Fat |
| Lignocellulosic Agri-Residues |
| Algae |
By Technology
| Fermentation |
| Trans-esterification |
| Hydrotreatment (HVO/SAF) |
| Gasification and FT-Synthesis |
| Pyrolysis and Upgrading |
By End-use Sector
| Road Transport |
| Aviation |
| Marine |
| Power Generation and Heating |
By Geography
| North America | United States |
| Canada | |
| Mexico | |
| Europe | Germany |
| France | |
| United Kingdom | |
| Denmark | |
| Rest of Europe | |
| Asia-Pacific | China |
| India | |
| Japan | |
| South Korea | |
| ASEAN Countries | |
| Rest of Asia-Pacific | |
| South America | Brazil |
| Argentina | |
| Chile | |
| Rest of South America | |
| Middle East and Africa | Saudi Arabia |
| United Arab Emirates | |
| South Africa | |
| Egypt | |
| Rest of Middle East and Africa |
| By Fuel Type | Bioethanol | |
| Biodiesel (FAME) | ||
| Renewable Diesel / HVO | ||
| Sustainable Aviation Fuel (SAF) | ||
| Bio-naphtha and Other Drop-in Biofuels | ||
| By Generation | First-Generation (Sugar & Starch) | |
| Second-Generation (Cellulosic) | ||
| Third-Generation (Algae-based) | ||
| Fourth-Generation (Synthetic Biology/Photobiological) | ||
| By Feedstock | Sugar Crops (Sugarcane, Sugar Beet) | |
| Starch Crops (Corn, Wheat, Cassava) | ||
| Oilseeds (Soy, Rapeseed, Palm) | ||
| Used Cooking Oil and Animal Fat | ||
| Lignocellulosic Agri-Residues | ||
| Algae | ||
| By Technology | Fermentation | |
| Trans-esterification | ||
| Hydrotreatment (HVO/SAF) | ||
| Gasification and FT-Synthesis | ||
| Pyrolysis and Upgrading | ||
| By End-use Sector | Road Transport | |
| Aviation | ||
| Marine | ||
| Power Generation and Heating | ||
| By Geography | North America | United States |
| Canada | ||
| Mexico | ||
| Europe | Germany | |
| France | ||
| United Kingdom | ||
| Denmark | ||
| Rest of Europe | ||
| Asia-Pacific | China | |
| India | ||
| Japan | ||
| South Korea | ||
| ASEAN Countries | ||
| Rest of Asia-Pacific | ||
| South America | Brazil | |
| Argentina | ||
| Chile | ||
| Rest of South America | ||
| Middle East and Africa | Saudi Arabia | |
| United Arab Emirates | ||
| South Africa | ||
| Egypt | ||
| Rest of Middle East and Africa | ||


Key Questions Answered in the Report
What is the current size of the global biofuels market?
The market is valued at USD 138.11 billion in 2026 and is projected to reach USD 254.59 billion by 2031.
How fast is sustainable aviation fuel growing compared with legacy blends?
SAF is projected to expand at 35.1% CAGR through 2031, far outpacing the flat growth of ethanol and biodiesel.
What policy mechanisms drive North American biofuel demand today?
The Renewable Fuel Standard, California's Low Carbon Fuel Standard and Canada's Clean Fuel Regulations together mandate or incentivize about 18-20 billion gal of blending each year.
Why is hydrotreatment overtaking trans-esterification for diesel substitutes?
Hydrotreatment produces renewable diesel with high cetane and cold-flow properties that meet ASTM fuel specs without blending limits, enabling 100% substitution in existing engines.
What restraints could slow biofuel expansion in Asia?
High logistics costs for collecting agricultural residues in India and Indonesia, plus volatile palm-oil prices, can delay advanced-fuel projects and compress producer margins.
Is the global biofuels market concentrated or fragmented?
The top five producers hold about 38% of capacity, giving the sector a moderate concentration level.
Page last updated on:


