Robo Taxi Market Size and Share
Market Overview
| Study Period | 2019 - 2031 |
|---|---|
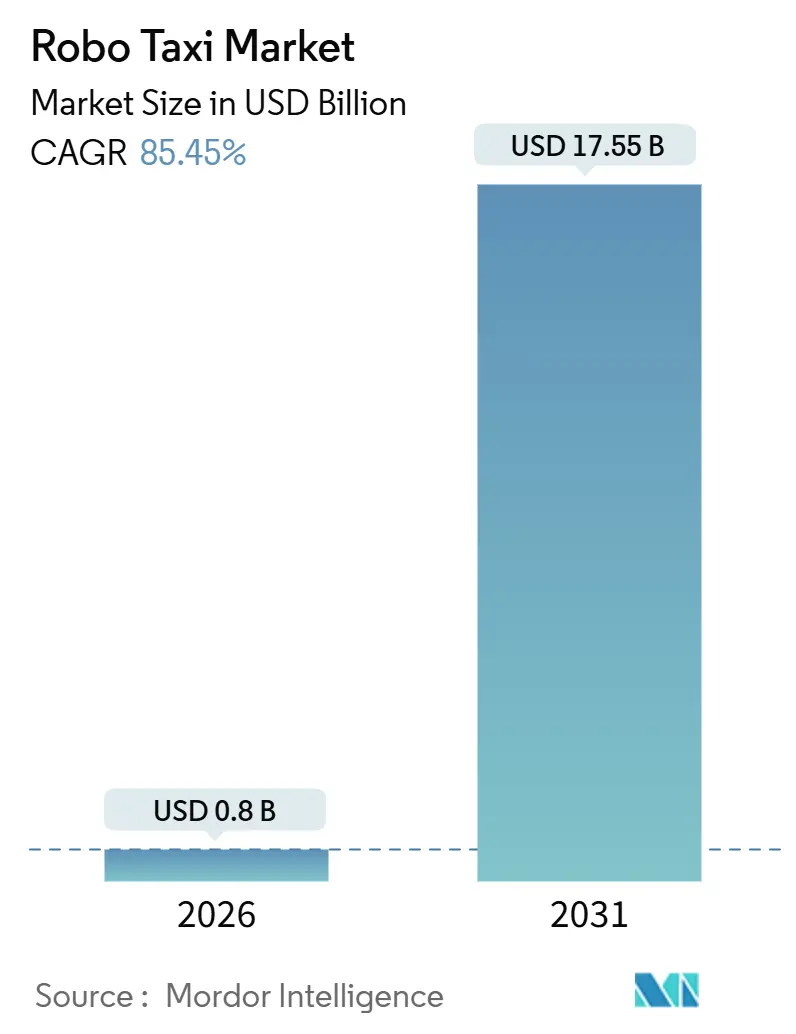
| Market Size (2026) | USD 0.8 Billion |
| Market Size (2031) | USD 17.55 Billion |
| Growth Rate (2026 - 2031) | 85.45% CAGR |
| Fastest Growing Market | Asia Pacific |
| Largest Market | Asia Pacific |
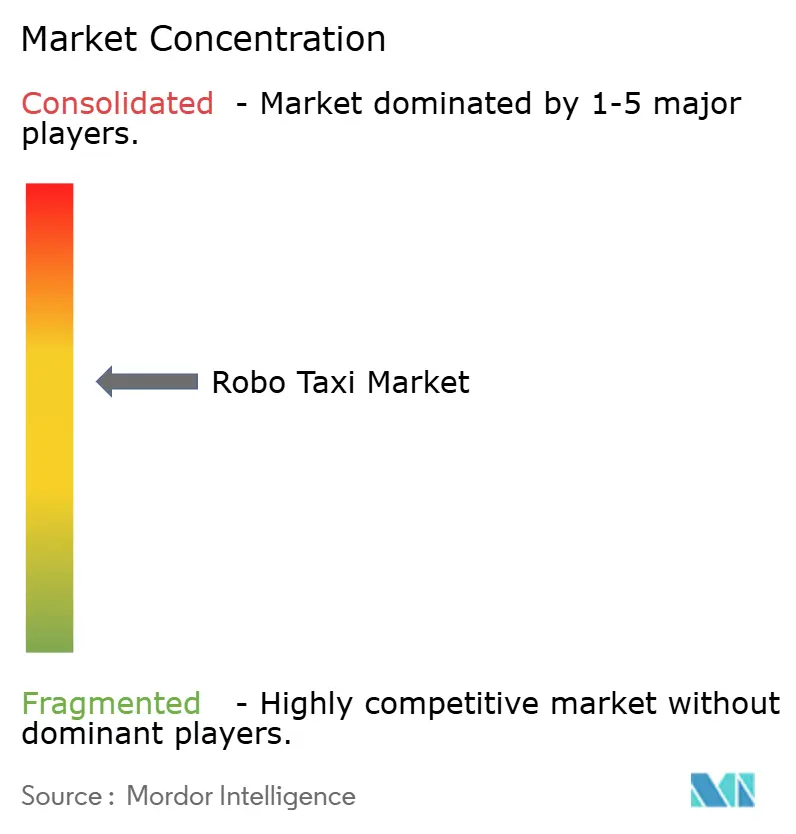
| Market Concentration | Medium |
Major Players *Disclaimer: Major Players sorted in no particular order Image © Mordor Intelligence. Reuse requires attribution under CC BY 4.0. | |
Robo Taxi Market Analysis by Mordor Intelligence
The robo taxi market size reached USD 0.80 billion in 2026 and is projected to touch USD 17.55 billion by 2031, advancing at an 85.45% CAGR over the forecast period. A rapid shift from pilot tests toward commercial scale is unfolding as sensor costs fall, regulatory sandboxes shorten approval cycles, and purpose-built vehicle designs replace legacy retrofits. Asia-Pacific currently accounts for a notable share of global demand, while North America and Europe are accelerating deployments through high-profile exemptions and urban emissions mandates. Fleet operators are concentrating resources on anchor cities to secure purchasing leverage in perception hardware and simulation infrastructure, creating widening unit-economics gaps between leaders and late entrants. Public trust remains the core hindrance to adoption, yet capital inflows and MaaS platform integrations are increasing ride density, which in turn reduces per-mile costs and fosters user familiarity—setting up a positive feedback loop that favors early movers.
Key Report Takeaways
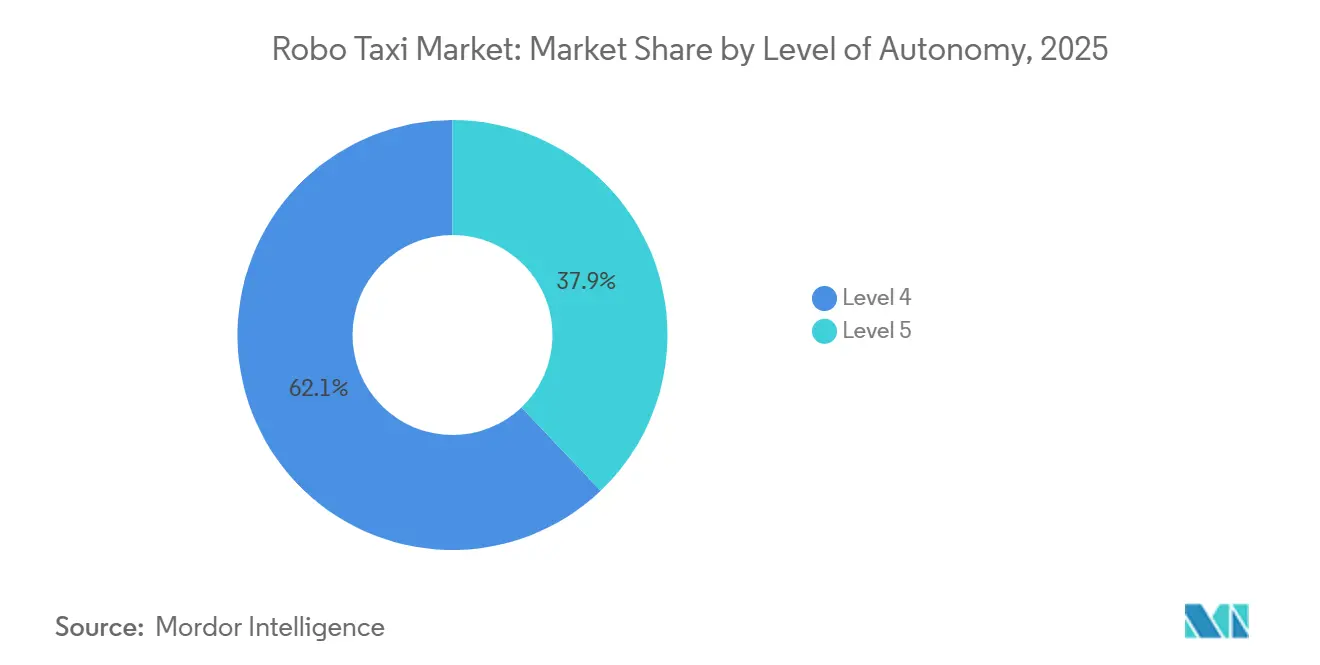
- By level of autonomy, Level 4 captured 62.05% of the robo taxi market share in 2025, while Level 5 is forecast to post the fastest 88.02% CAGR through 2031.
- By propulsion, battery-electric vehicles commanded 72.13% of the robo taxi market size in 2025 and are projected to expand at an 87.14% CAGR by 2031.
- By vehicle type, cars dominated with a 68.22% share in 2025; however, vans/shuttles are set to register an 86.03% CAGR to 2031.
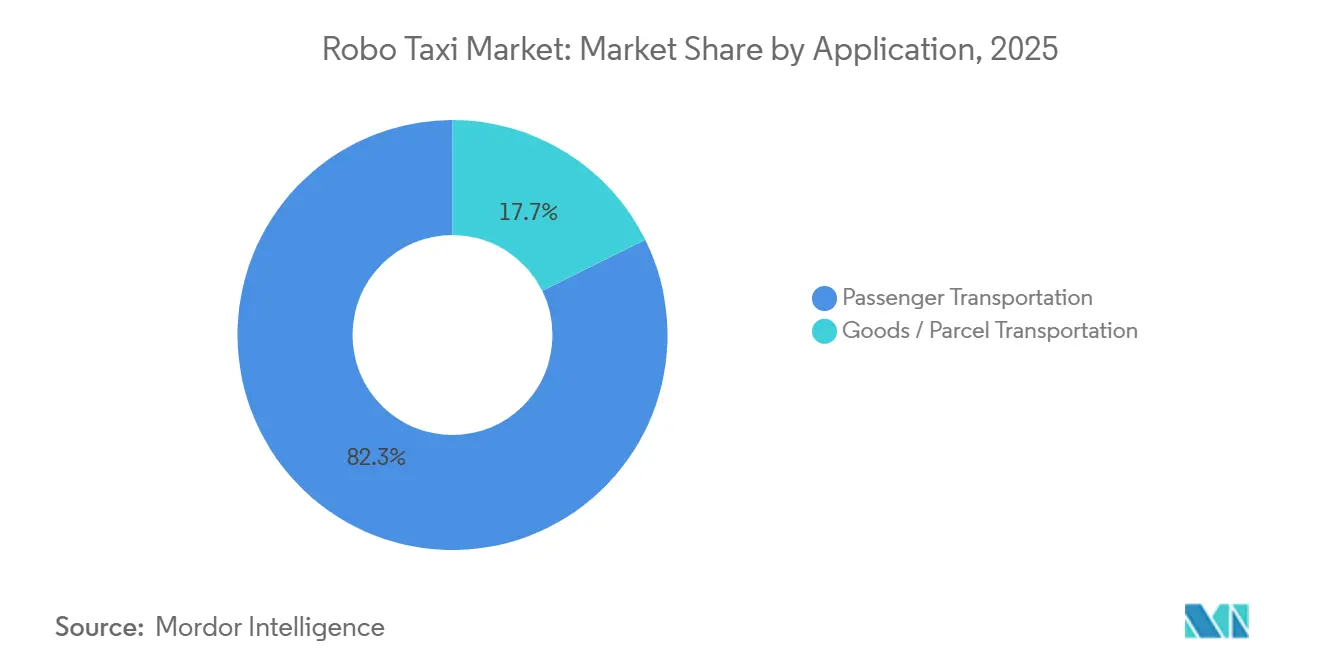
- By application, passenger transportation accounted for 82.34% of the robo taxi market size in 2025 and is expected to grow at a 90.17% CAGR through 2031.
- By service type, rental-based free-floating services led with a 55.12% share of the robo taxi market in 2025, and are expected to grow at a 87.55% CAGR.
- By business model, B2C held 54.25% of the Robo Taxi Market share in 2025, yet B2B contracts are poised for the highest 89.11% CAGR through 2031.
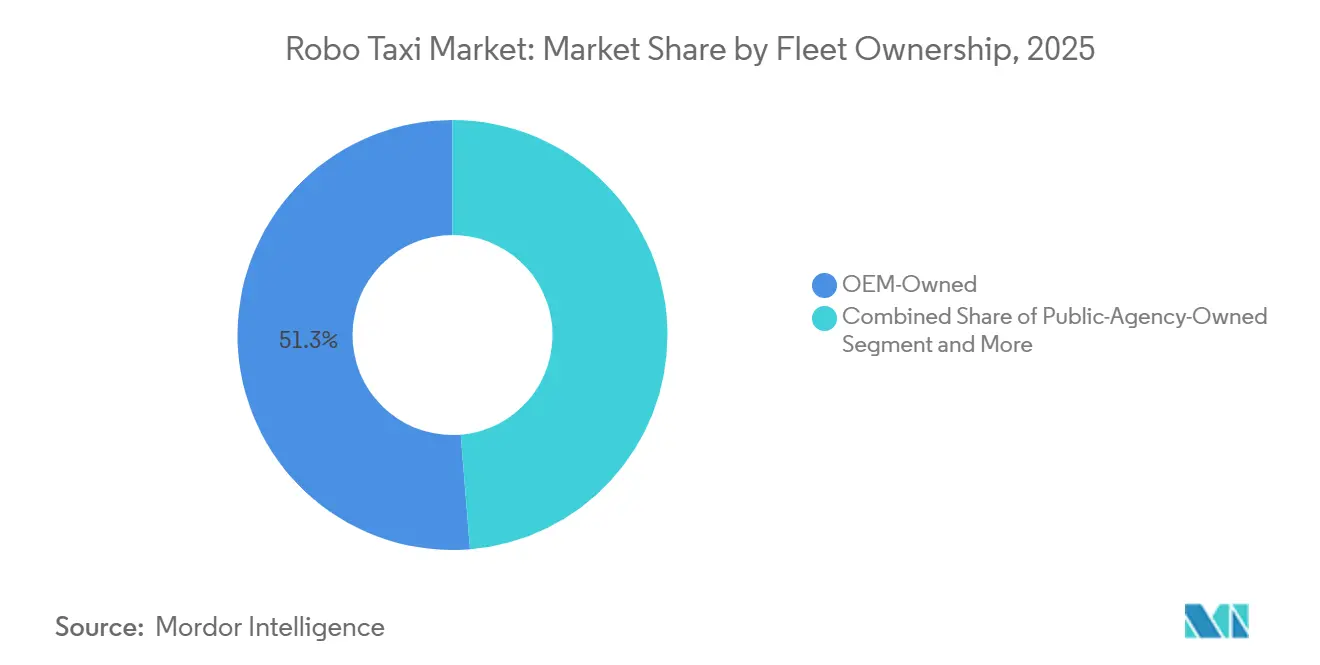
- By fleet ownership, OEM-controlled fleets represented 51.26% in 2025, while operator-owned fleets are expected to expand at an 86.41% CAGR to 2031.
- By operating environment, urban cores delivered 63.42% of revenue in 2025 in the Robo Taxi Market, but highway and inter-city corridors are expected to surge at an 89.62% CAGR.
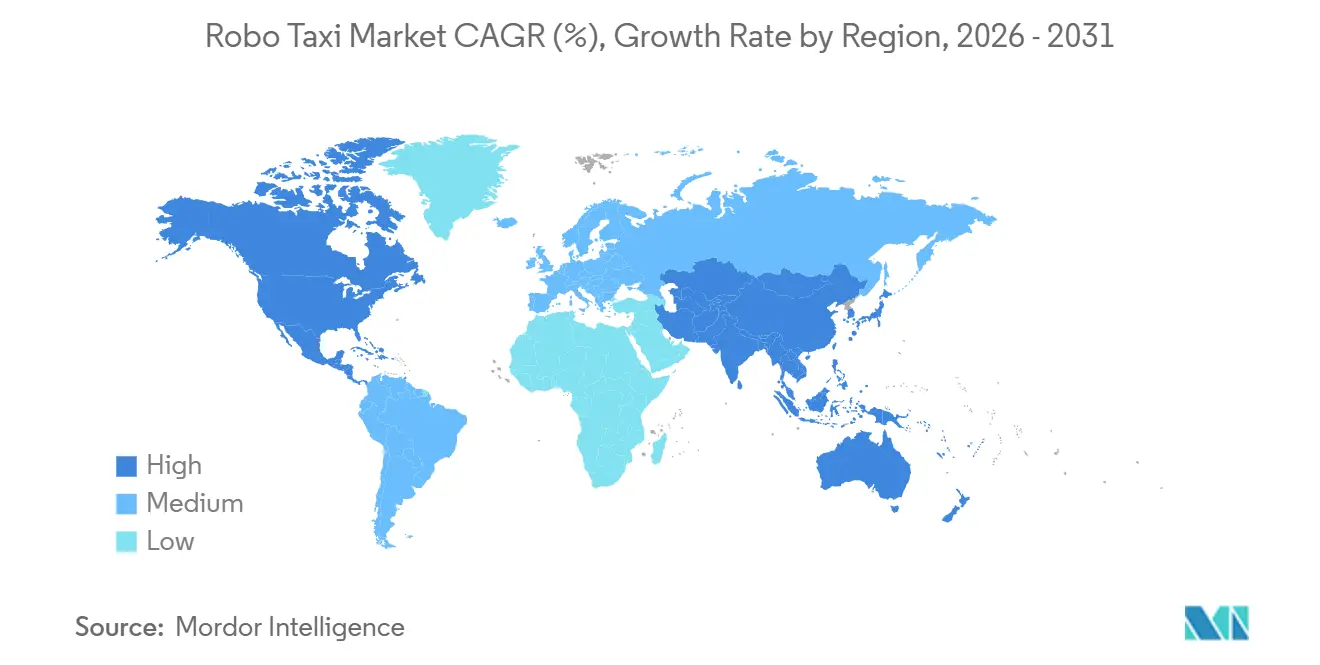
- By geography, the Asia-Pacific region held a 46.09% share in 2025 and is expected to grow at an 85.79% CAGR through 2031.
Note: Market size and forecast figures in this report are generated using Mordor Intelligence’s proprietary estimation framework, updated with the latest available data and insights as of January 2026.
Global Robo Taxi Market Trends and Insights
Drivers Impact Analysis*
| Driver | (~) % Impact on CAGR Forecast | Geographic Relevance | Impact Timeline |
|---|---|---|---|
| Government Pilots and Regulatory Sandboxes | +15.8% | North America, EU, China, Middle East | Short term (≤ 2 years) |
| Capital Inflows into Mobility | +14.1% | Global; concentrated in United States and China | Short term (≤ 2 years) |
| Declining Sensor and Computing Costs | +12.5% | Global; strongest in China, North America | Medium term (2-4 years) |
| MaaS Integration Driving Fleet Utilization | +11.3% | Global; early traction in United States and China | Short term (≤ 2 years) |
| Autonomous Architectures for Last-Mile Logistics | +9.7% | North America, China, Europe | Medium term (2-4 years) |
| Congestion Pricing Nudging Shared Autonomy | +8.2% | Europe, Asia-Pacific, select cities in the United States | Medium term (2-4 years) |
| Source: Mordor Intelligence | |||
Government AV Pilots and Regulatory Sandboxes
Conditional exemptions enable the use of real-world data to substitute for theoretical models, thereby reducing validation timelines in the Robo Taxi Market. In August 2025, Zoox became the first recipient of a demonstration exemption from the National Highway Traffic Safety Administration under the Automated Vehicle Exemption Program (AVEP). This milestone enables Zoox's American-built, purpose-designed automated vehicle to operate without conventional manual controls, provided that certain specified conditions are met [1].“Exemption No. 22066—Zoox Inc. Low-Occupancy Vehicle,” National Highway Traffic Safety Administration, nhtsa.govChina’s Ministry of Transport has permitted fully driverless public trials across multiple tier-1 cities since mid-2024, enabling millions of passenger-carrying miles. Abu Dhabi authorized commercial operations without safety drivers in November 2025, setting the stage for regional leapfrog adoption. Operators use early approvals to accrue safety records that ease expansion into more conservative markets.
On August 6, 2025, NHTSA granted Zoox the first-ever demonstration exemption under the Automated Vehicle Exemption Program (AVEP) for an American-built purpose-built automated vehicle, enabling operation without traditional manual controls under specified conditions.”
Record Capital Inflows into Autonomous-Mobility Ventures
In October 2024, Waymo secured a USD 5.6 billion funding round, spearheaded by Alphabet and bolstered by external investors. This move highlighted the escalating investor confidence in the imminent commercialization of the Robo Taxi Market. Meanwhile, Waabi raised substantial capital to enhance its AI-driven simulation platform, significantly reducing the need for extensive on-road testing. As major IPOs and strategic spin-outs emerge, they're centralizing resources among a select few leaders, intensifying the prevailing scale advantages.
Declining AD-Sensor and Computing Costs
In recent years, the cost of LiDAR, radar, and camera suites has significantly decreased, making it more feasible for operators to recover their investments quickly under high-utilization scenarios in the Robo Taxi Market. Mobileye’s EyeQ6 processor, now in mass production, supports multiple cameras while maintaining low power consumption. This advancement reduces hardware size and minimizes thermal and integration challenges. Baidu’s Apollo Go RT6 robo-taxi, by eliminating traditional driving components, demonstrates how design-for-autonomy can effectively lower production costs. Luminar’s Iris LiDAR, with its extended range, enables deployment at highway speeds for large-scale fleets. These advancements in cost efficiency are encouraging operators to expedite fleet upgrades with purpose-built platforms.
Maas Platform Integration Unlocking Fleet Utilization
Embedding autonomous rides within established ride-hailing apps removes the need for costly customer acquisition in the Robo Taxi Market. In October 2023, Waymo partnered with Uber, enabling Phoenix riders to request Waymo rides directly through the Uber app, thereby broadening its user base. Similar integrations by Apollo Go and Pony.ai leverage Uber’s scale to bypass the “cold-start” hurdle. Higher occupancy per vehicle cuts per-mile operating costs, allowing aggressive price promotions that further stimulate demand.
Restraints Impact Analysis*
| Restraint | (~) % Impact on CAGR Forecast | Geographic Relevance | Impact Timeline |
|---|---|---|---|
| High Capex Uncertain Payback | -11.2% | Global; acuter for new entrants | Short term (≤ 2 years) |
| Public Trust Safety Gaps | -8.9% | Global; higher skepticism in Europe, United States | Medium term (2-4 years) |
| Liability and Safety Regimes | -7.6% | Global; fragmented in United States, EU, China | Long term (≥ 4 years) |
| V2X Cyber Security Vulnerabilities | -5.4% | Global; heightened in developed markets | Medium term (2-4 years) |
| Source: Mordor Intelligence | |||
High Upfront CAPEX and Uncertain Payback
In most cities, breakeven periods for purpose-built vehicles and sensor suites are significantly long due to their high costs in the Robo Taxi Market. In December 2024, General Motors discontinued its autonomous ride-hailing venture after incurring substantial cumulative losses. Even with highly optimized designs, like Baidu's RT6, considerable upfront investment is required before these vehicles can enter service. A persistent challenge remains: off-peak hours experience significant underutilization, which dampens overall returns.
Persistent Public-Trust and Safety-Perception Gap
In 2024, autonomous readiness was assessed as being at a relatively low level in the Robo Taxi Market. A significant portion of those surveyed expressed a demand for increased safety data. A peer-reviewed study revealed that consumers tend to hold car manufacturers more accountable, even when the autonomous vehicle is not at fault, leading to inflated insurance premiums. Furthermore, both elderly users and residents in rural areas have consistently voiced greater discomfort with autonomous vehicles. This sentiment has limited the adoption of vehicles beyond densely populated metropolitan areas and has slowed revenue growth in suburban regions.
*Our forecasts treat driver/restraint impacts as directional, not additive. The impact forecasts reflect baseline growth, mix effects, and variable interactions.
Segment Analysis
By Level of Autonomy: Level 5 Momentum Builds Behind Cost Parity
Level 4 systems accounted for 62.05% of 2025 deployments; however, Level 5 is projected to outpace this with an 88.02% CAGR to 2031, as safety-driver wages are expected to disappear from operating ledgers. Waymo’s expansion to freeway routes in late 2025 showed that on-ramp merging and high-speed lane changes are within current perception-and-planning capabilities.
Wider operational design domains will unlock airport runs, rural coverage, and inter-city corridors, raising revenue miles per vehicle. Zoox has obtained a steering-wheel-free exemption from the NHTSA, indicating that regulators will certify Level 5 once redundant braking, steering, and perception layers achieve safety equivalency. As remote operations centers supervise 50-plus vehicles per human, labor overhead falls below the cost of retaining in-car safety operators, tipping economics toward full autonomy.


By Propulsion: Battery-Electric Economics Dominate Utilization-Heavy Fleets
Battery-electric platforms held a 72.13% share in 2025, reflecting the influence of zero-emission zone incentives and low per-mile energy costs. Hybrid alternatives carry dual-powertrain maintenance and fail to qualify for congestion-pricing exemptions in multiple capitals. The robo taxi market share for battery-electric vehicles is forecast to expand with a 87.14% CAGR through 2031 as pack prices decrease and city councils tighten emissions regulations.
Baidu's RT6, designed for a purpose, achieves an impressive range by optimizing energy efficiency through the removal of driver-centric hardware. This approach aligns its performance with hybrid sedans while reducing energy costs. Zoox claims that its purpose-built vehicle, equipped with a 133 kWh battery, can go over 16 hours on a single charge. This enables full-day service with designated charging intervals. However, fuel-cell prototypes face challenges due to the limited availability of hydrogen infrastructure and higher associated costs.
By Vehicle Type: Vans and Shuttles Unlock Logistics and Campus Corridors
Passenger cars accounted for 68.22% of rides in 2025, driven by comfort benchmarks and existing sedan supply chains. Vans and shuttles, however, are forecast to grow at 86.03% CAGR, propelled by parcel contracts and fixed-route campus services. Nuro’s third-generation cargo pod runs suburban grocery loops with notable daytime utilization, demonstrating higher asset productivity than peak-biased passenger use cases.
EasyMile’s EZ10 and Navya’s Autonom Shuttle log over 1 million commercial kilometers across airports and business parks, validating low-speed autonomy as a fast-track regulatory entry point. Reconfigurable interiors permit day-night mode switching, maximizing revenue per chassis.
By Application: Passenger Rides Lead, Goods Delivery Scales Faster
Passenger mobility accounted for 82.34% of 2025 turnover and is projected to grow at a 90.17% CAGR through 2031, as consumers shift from ownership to on-demand access. Waymo's operations span three metros within the United States, demonstrating the significance of reliability and coverage in achieving scale.
Though smaller in scale, goods delivery encounters less regulatory oversight, especially in industrial zones and gated communities. Walmart and Nuro's grocery routes consistently meet rapid fulfillment windows, maintaining high levels of customer satisfaction. The interplay between ride-sharing and delivery services enhances round-the-clock utilization, bolstering the economics of the fleet.
By Service Type: Free-Floating Dominance Meets Station-Based Niche
Rental-style, free-floating services held a 55.12% share in 2025, mirroring the familiar ride-hailing experience. This segment is expected to retain its dominance and grow at a 87.55% CAGR through 2031. Apollo Go embeds rides inside the Uber app across pilot cities, granting immediate access to millions of active users.
Station-based models thrive where demand flows are predictable—such as suburbs, campuses, and airports—eliminating repositioning and deadhead miles. Operators deploy hybrid fleets, with free-floating vehicles in dense urban cores and hub-to-hub shuttles in outer suburban areas. Doing so balances vehicle availability against utilization thresholds needed for profitability.
By Business Model: B2B Contracts Accelerate Revenue Visibility
B2C bookings remain the dominant, with a 54.25% share in 2025; however, B2B service agreements are expected to expand at a faster rate, with a 89.11% CAGR. Retailers and corporations value guaranteed capacity and are willing to pay premium rates secured through multi-year contracts. Gatik’s middle-mile vehicles hit unit-level profitability sooner than passenger services by serving Walmart store runs with fixed schedules.
Public transit agencies in Singapore have ordered autonomous buses for a 2026 rollout, highlighting their interest in extending network reach without incurring proportional labor cost growth. Enterprise demand shields operators from seasonality and raises fleet utilization beyond consumer-only peaks.
By Fleet Ownership: Operator Models Rise as TNCs Avoid Heavy Assets
OEMs controlled 51.26% of fleets in 2025; however, operator-owned models are set to expand at an 86.41% CAGR by 2031, driven by transportation network companies that supply riders but outsource vehicle ownership. Uber’s partnerships with Waymo, Apollo Go, and WeRide illustrate a pivot to asset-light aggregation. This alignment lets OEMs monetize hardware without bearing full operational risk, while TNCs capture platform fees and data value.
Public agencies may bankroll fleets in select markets, treating robo-taxis as infrastructure akin to buses or trams. Abu Dhabi’s concession with WeRide exemplifies the government's willingness to co-invest where mobility access aligns with policy targets.

By Operating Environment: Highway Corridors Offer Speed and Revenue Density
Urban cores generated 63.42% of the 2025 revenue, while highway and inter-city segments are expected to expand at a rate of 89.62% through 2031. Structured lanes, lower pedestrian density, and longer average trip lengths improve safety margins and revenue per vehicle hour. In 2025, Waymo introduced rider-only freeway trips within its service areas, including Los Angeles, highlighting progress in highway driving within defined operational domains.
Campus and suburban loops serve as proving grounds for fixed-route shuttles, building public familiarity and refining the handling of edge cases. As sensor range and compute headroom increase, mixed-use district coverage will follow, unlocking the full potential of the network effect.
Geography Analysis
The Asia-Pacific region led the robo taxi market with a 46.09% share in 2025 and is projected to grow at an 85.79% CAGR through 2031. China’s Ministry of Transport has authorized fully driverless services in multiple tier-1 cities, accelerating cumulative ride counts beyond nine million for Apollo Go by January 2025 [2]“Notice on High-Level Autonomous Driving Pilots,” Ministry of Transport of the People’s Republic of China, mot.gov.cn. Pony.ai’s city-wide permit in Shenzhen covers a significant number of autonomous cars, demonstrating the region’s regulatory momentum. Japan and South Korea leverage domestic manufacturing strength to push local pilots, while India attracts interest for congestion relief despite slower policy progress.
North America ranks second, led by Waymo’s multi-city operations, which now include freeway segments. NHTSA’s willingness to exempt purpose-built vehicles without steering wheels signals federal support, even as state-level insurance requirements remain uneven. Canadian pilots in Toronto and Vancouver concentrate on cold-weather validation to expand operational design domains.
Europe trails in volume due to conservative type-approval processes and fragmented liability norms. Nevertheless, Germany’s Level 4 statute clarifies manufacturer responsibility, drawing pilot fleets from domestic OEMs. Autonomous campus shuttles from EasyMile and Navya have logged over 1 million kilometers, highlighting lower-speed niches as entry points. The Middle East emerges as a leapfrog region: Abu Dhabi hosts the first fully driverless commercial service, and Dubai plans to significantly expand its fleets, backed by government concessions that share revenue with operators.

Competitive Landscape
The robo taxi market is moderately concentrated, with Waymo and Apollo Go leading in North America and China, respectively. Both command large fleets and have raised multi-billion-dollar capital, allowing for price competition while smaller peers struggle to finance safety validation and hardware procurement. Waymo’s USD 5.6 billion capital infusion in 2024 gives it unmatched sensor-volume purchasing power. Apollo Go benefits from Baidu’s search-and-mapping ecosystem, which lowers ride-matching costs.
Late-stage attrition is evident: General Motors exited after Cruise posted significant losses, showing capital depth alone cannot offset unresolved cost curves [3]“Q4 2024 Form 8-K – Cruise Strategic Review,” General Motors Company, gm.com. Strategy bifurcates into vertically integrated stacks—such as Waymo, Baidu, and Zoox—that own hardware, software, and operations, and aggregator models—like Uber and Lyft—that integrate multiple autonomous providers while remaining asset-light. Technology differentiation centers on sensor fusion philosophy and simulation scale; Waabi’s AI-first virtual testing claims significant reduction in on-road miles, hinting at a potential step-change in development velocity.
White-space growth lies in B2B logistics and inter-city corridors. Nuro’s cargo focus earned a USD 6 billion valuation, proving goods delivery can reach profitability ahead of passenger services. Geographic diversification remains limited; no operator has yet achieved seamless cross-border coverage, keeping regional champions insulated by local policy expertise.
Robo Taxi Industry Leaders
Waymo LLC
Apollo Go
AutoX Inc.
Pony.ai
Zoox, Inc.
- *Disclaimer: Major Players sorted in no particular order

Recent Industry Developments
- December 2025: Didi’s autonomous division began 24/7 driverless trials in Guangzhou, covering stations, schools, and malls, with in-car remote-support links available.
- November 2025: WeRide launched the first fully driverless commercial robo-taxi fleet in Abu Dhabi under a revenue-sharing concession with the Emirate.
- July 2025: Lucid, Nuro, and Uber have unveiled a premium robotaxi program that combines Lucid’s software-defined architecture, Nuro’s Level 4 system, and Uber’s fleet management, with a 2026 launch planned in the United States.
- July 2025: Apollo Go partnered with Uber to roll out robo-taxis in Abu Dhabi, aiming at further Middle Eastern expansion.


Global Robo Taxi Market Report Scope
The scope includes segmentation by level of autonomy (level 4, and level 5), propulsion (battery-electric vehicles, hybrid-electric vehicles, and fuel cell electric vehicles), vehicle type (car, and van/shuttle), application (passenger transportation, and goods/parcel transportation), service type (rental-based, and station based), business model (B2C (direct to riders), B2B (corporate / logistics contracts), and public-transit integration), fleet ownership (OEM-owned, operator-owned (TNCs and start-ups), and public-agency-owned), and operating environment (urban core, sub-urban / campus, highway / inter-city, mixed-use zones). The analysis also covers regional-level segmentation, including North America, South America, Europe, Asia-Pacific, and the Middle East and Africa. Market size and growth forecasts are presented by value in USD.
| Level 4 |
| Level 5 |
| Battery-Electric Vehicles |
| Hybrid-Electric Vehicles |
| Fuel-Cell Electric Vehicles |
| Car |
| Van / Shuttle |
| Passenger Transportation |
| Goods / Parcel Transportation |
| Rental-Based (free-floating) |
| Station-Based (hub-to-hub) |
| B2C (direct to riders) |
| B2B (corporate / logistics contracts) |
| Public-Transit Integration |
| OEM-Owned |
| Operator-Owned (TNCs and start-ups) |
| Public-Agency-Owned |
| Urban Core |
| Sub-Urban / Campus |
| Highway / Inter-city |
| Mixed-Use Zones |
| North America | United States |
| Canada | |
| Rest of North America | |
| South America | Brazil |
| Argentina | |
| Rest of South America | |
| Europe | Germany |
| United Kingdom | |
| France | |
| Italy | |
| Spain | |
| Russia | |
| Rest of Europe | |
| Asia-Pacific | China |
| Japan | |
| India | |
| South Korea | |
| Rest of Asia-Pacific | |
| Middle East and Africa | Turkey |
| Saudi Arabia | |
| United Arab Emirates | |
| South Africa | |
| Nigeria | |
| Rest of the Middle East and Africa |
| By Level of Autonomy | Level 4 | |
| Level 5 | ||
| By Propulsion | Battery-Electric Vehicles | |
| Hybrid-Electric Vehicles | ||
| Fuel-Cell Electric Vehicles | ||
| By Vehicle Type | Car | |
| Van / Shuttle | ||
| By Application | Passenger Transportation | |
| Goods / Parcel Transportation | ||
| By Service Type | Rental-Based (free-floating) | |
| Station-Based (hub-to-hub) | ||
| By Business Model | B2C (direct to riders) | |
| B2B (corporate / logistics contracts) | ||
| Public-Transit Integration | ||
| By Fleet Ownership | OEM-Owned | |
| Operator-Owned (TNCs and start-ups) | ||
| Public-Agency-Owned | ||
| By Operating Environment | Urban Core | |
| Sub-Urban / Campus | ||
| Highway / Inter-city | ||
| Mixed-Use Zones | ||
| By Geography | North America | United States |
| Canada | ||
| Rest of North America | ||
| South America | Brazil | |
| Argentina | ||
| Rest of South America | ||
| Europe | Germany | |
| United Kingdom | ||
| France | ||
| Italy | ||
| Spain | ||
| Russia | ||
| Rest of Europe | ||
| Asia-Pacific | China | |
| Japan | ||
| India | ||
| South Korea | ||
| Rest of Asia-Pacific | ||
| Middle East and Africa | Turkey | |
| Saudi Arabia | ||
| United Arab Emirates | ||
| South Africa | ||
| Nigeria | ||
| Rest of the Middle East and Africa | ||


Key Questions Answered in the Report
How large could global robo taxi services become by 2031?
The segment is projected to reach USD 17.55 billion by 2031.
What annual growth rate do analysts expect through 2031?
The compound growth pace is forecast at 85.45% a year from 2026 to 2031.
Which region is in front on deployments today?
Asia-Pacific holds 46.09% of 2025 volume, led by China’s city-wide driverless approvals.
Question What remains the biggest obstacle to widespread roll-out?
Public trust and perceived safety gaps continue to temper adoption despite growing real-world mileage.
Page last updated on:


