Medical Equipment Repair Software Market Size and Share
Market Overview
| Study Period | 2019 - 2030 |
|---|---|
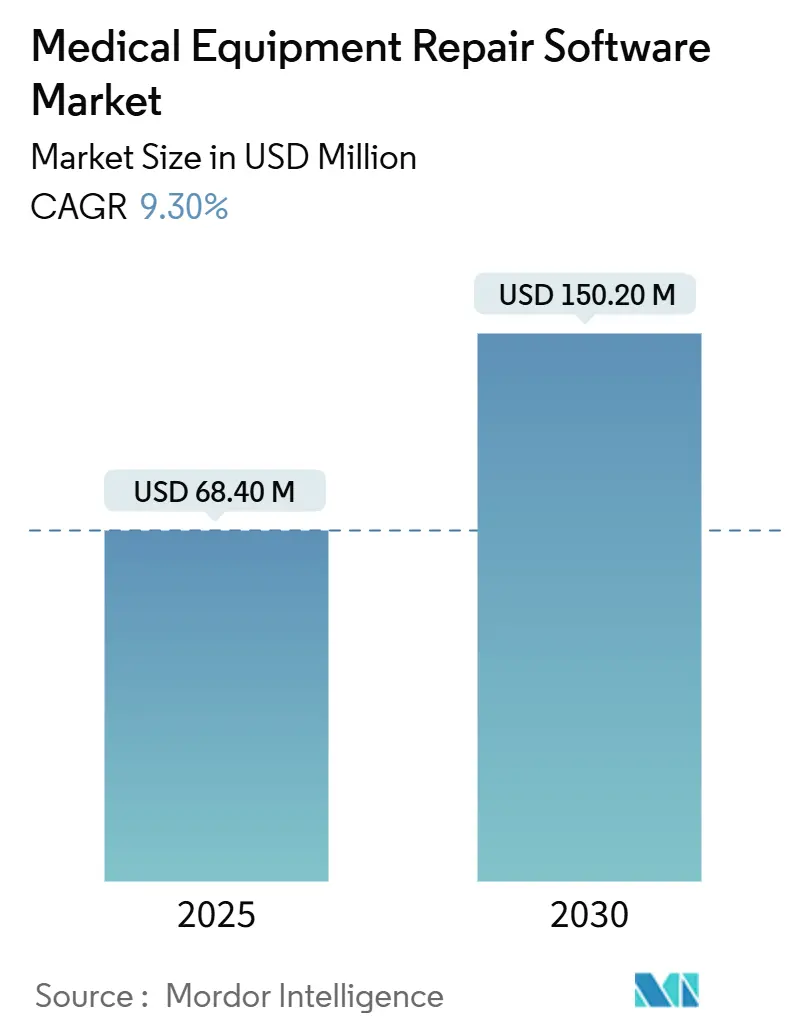
| Market Size (2025) | USD 68.40 Million |
| Market Size (2030) | USD 150.20 Million |
| Growth Rate (2025 - 2030) | 9.30% CAGR |
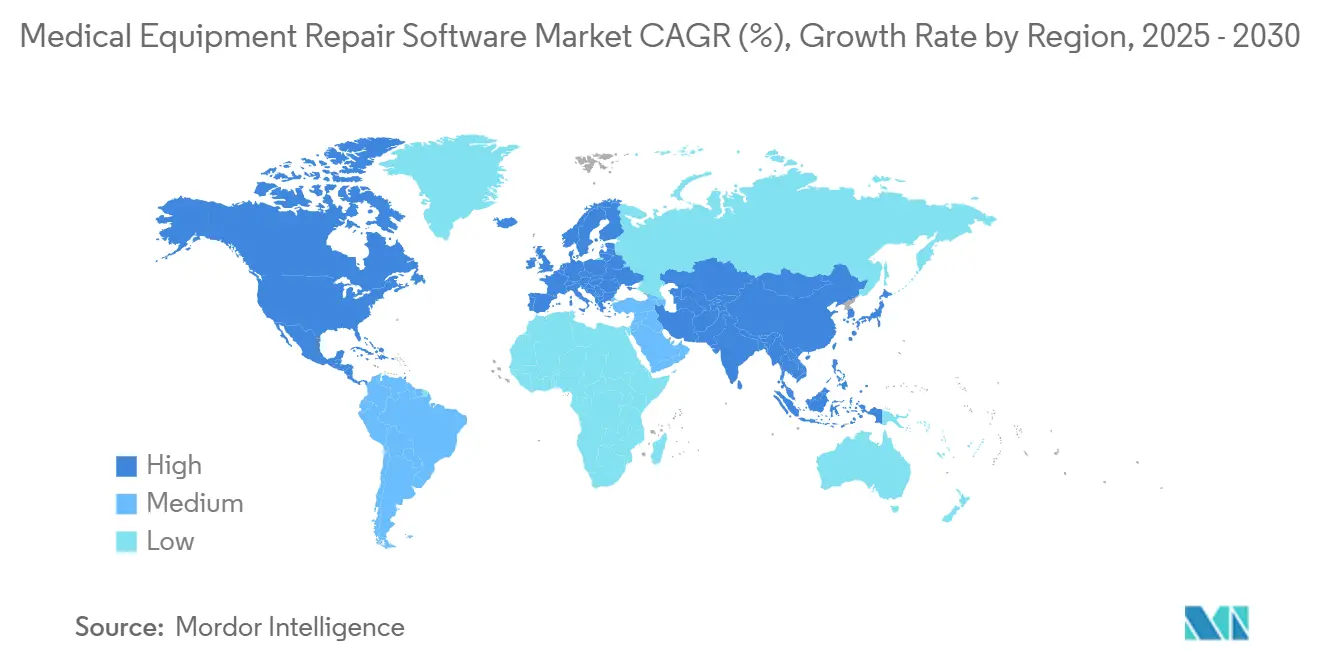
| Fastest Growing Market | North America |
| Largest Market | Asia Pacific |
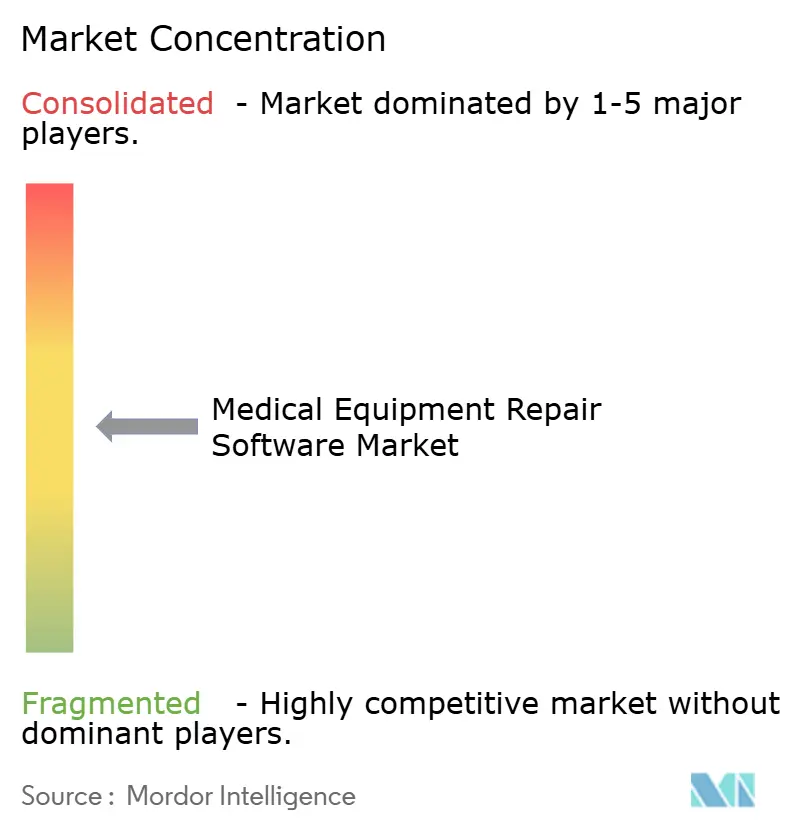
| Market Concentration | Medium |
Major Players *Disclaimer: Major Players sorted in no particular order Image © Mordor Intelligence. Reuse requires attribution under CC BY 4.0. | |
Medical Equipment Repair Software Market Analysis by Mordor Intelligence
The medical equipment repair software market size stands at USD 68.4 million in 2025 and is forecast to reach USD 150.2 million by 2030, advancing at a 9.30% CAGR. Growth momentum is anchored in the transition from reactive to predictive maintenance, accelerated by AI-driven analytics, IoT-enabled device fleets, and value-based reimbursement models that penalize downtime. North America remains the revenue leader thanks to early technology adoption and stringent cyber-safety rules, while Asia Pacific records double-digit expansion on the back of hospital build-outs and government digital-health policies. Vendor differentiation tilts toward cloud-native platforms, API-first architectures, and cybersecurity toolkits that harden connected devices. Competitive intensity is moderate as enterprise asset-management suites square off against niche healthcare specialists, and both camps chase subscription pricing that compresses capex barriers and widens addressable demand.
Key Report Takeaways
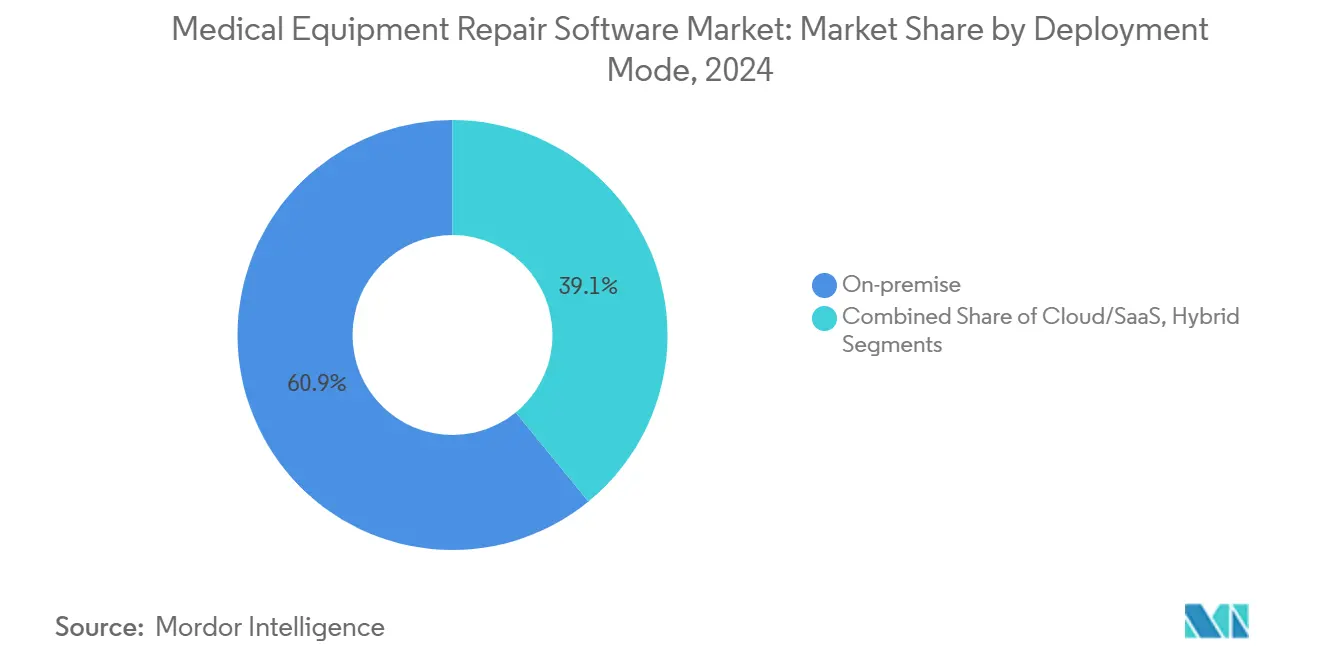
- By deployment mode, on-premise solutions led with 60.9% of the medical equipment repair software market share in 2024; cloud/SaaS platforms are projected to expand at a 19.3% CAGR through 2030.
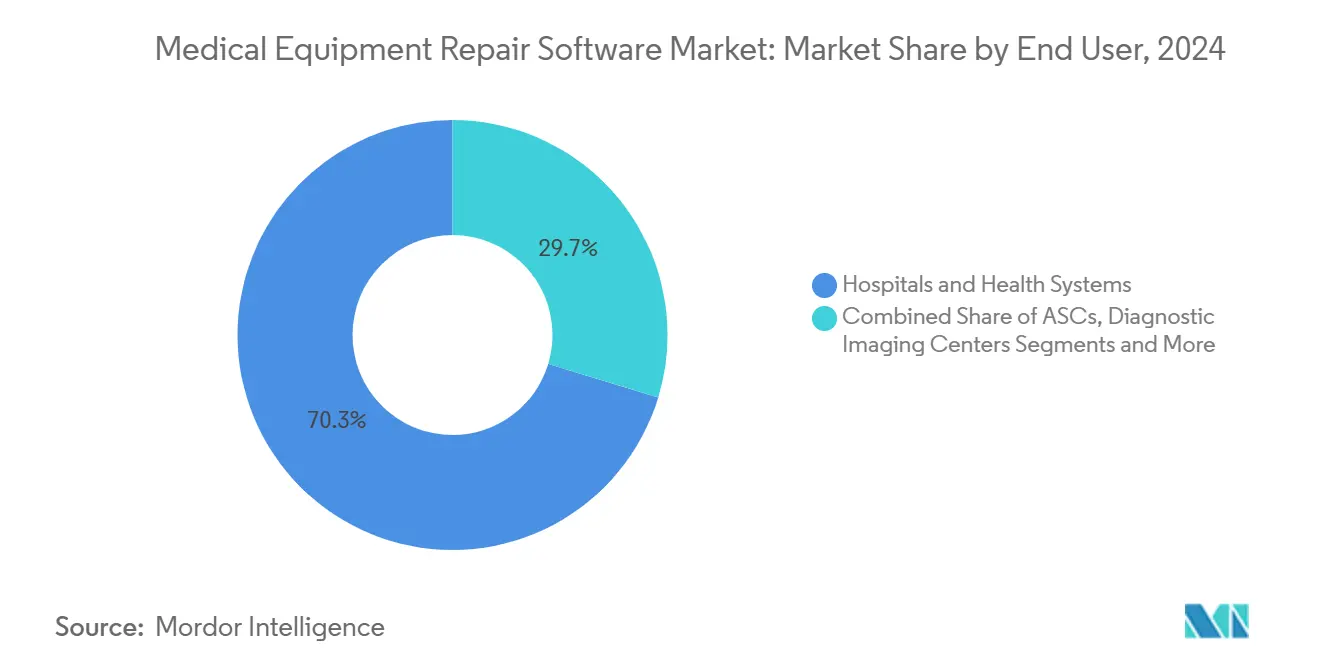
- By end user, hospitals and health systems held 70.3% share of the medical equipment repair software market size in 2024, while Independent Service Organizations are advancing at a 17.5% CAGR through 2030.
- Geographically, North America commanded 37.7% revenue share in 2024; Asia Pacific is forecast to grow at 13.9% CAGR to 2030.
Global Medical Equipment Repair Software Market Trends and Insights
Drivers Impact Analysis*
| Driver | (~) % Impact on CAGR Forecast | Geographic Relevance | Impact Timeline |
|---|---|---|---|
| Rapid Shift Toward Predictive & AI-Driven Maintenance | +2.10% | Global, with early adoption in North America & EU | Medium term (2-4 years) |
| Stringent Uptime Mandates From Value-Based-Care Payors | +1.80% | North America & EU core, expanding to APAC | Short term (≤ 2 years) |
| OEM-Agnostic Integration With IoT/RTLS Devices | +1.50% | Global, with APAC showing rapid adoption | Medium term (2-4 years) |
| Expansion Of ISO-Led Managed-Service Contracts | +1.20% | North America & EU, emerging in APAC | Long term (≥ 4 years) |
| Subscription Pricing Lowers Capex Barriers | +0.80% | Global, particularly beneficial for emerging markets | Short term (≤ 2 years) |
| Cyber-Hardening Mandates For Networked Devices | +0.60% | Global, with regulatory leadership in North America | Medium term (2-4 years) |
| Source: Mordor Intelligence | |||
Rapid Shift Toward Predictive & AI-Driven Maintenance
Hospitals are swapping calendar-based servicing for predictive algorithms that cut downtime by up to 35% and stretch asset life 15-20%. These analytics crunch sensor streams from high-value scanners, alarms, and infusion devices to flag anomalies hours before failure. Real-time insights let technicians batch parts, stagger labor, and schedule maintenance during low-utilization windows, shielding revenue under value-based contracts. Vendors embed machine-learning models inside cloud dashboards so even community hospitals gain enterprise-grade foresight. As evidence mounts, boards recast maintenance from a cost center to a strategic lever supporting patient-safety metrics and reimbursement integrity.
Stringent Uptime Mandates From Value-Based-Care Payors
Payers now stipulate 99.5% availability on critical equipment, assessing penalties of USD 10,000–100,000 for each breach.[1]Joint Commission, “Prepublication Standards,” Joint Commission, jointcommission.org CFOs answer with software that maps service-level agreements, timestamps failures, and auto-escalates work orders. Tighter uptime clauses also ripple into vendor contracts, aligning incentives between providers and OEMs. Because reimbursement directly hinges on reliability, capital committees are fast-tracking maintenance-tech investments ahead of imaging or surgical upgrades.
OEM-Agnostic Integration With IoT/RTLS Devices
Multi-vendor fleets complicate tracking, yet IoT sensors and RTLS tags now feed unified dashboards that trim equipment search time 60% and boost utilization.[2]Joint Commission, “Joint Commission Online – April 3 2024,” Joint Commission, jointcommission.org API-first repair platforms ingest these feeds, writing a single asset record regardless of brand. As APAC hospitals scale, demand for OEM-neutral systems spikes, avoiding lock-in and easing regulatory audits.
Expansion Of ISO-Led Managed-Service Contracts
Independent Service Organizations negotiate 20-30% lower service costs versus OEM plans while keeping uptime comparable. Their cross-trained techs, remote diagnostics, and shared parts pools appeal to mid-size facilities lacking in-house depth. Long-horizon contracts secure predictable spend, and software portals give administrators real-time scorecards on SLA compliance.
Restraints Impact Analysis*
| Restraint | (~) % Impact on CAGR Forecast | Geographic Relevance | Impact Timeline |
|---|---|---|---|
| Fragmented EHR/CMMS Interoperability Standards | -1.40% | Global, particularly acute in North America due to EHR diversity | Long term (≥ 4 years) |
| Shortage Of Certified HTM Technicians | -0.90% | Global, with critical shortages in rural and emerging markets | Medium term (2-4 years) |
| High Switching Costs For Legacy On-Premise Users | -0.70% | North America & Europe, where legacy systems are prevalent | Medium term (2-4 years) |
| Liability Concerns Around Algorithmic Work-Order Triage | -0.50% | Global, with heightened regulatory scrutiny in North America & EU | Long term (≥ 4 years) |
| Source: Mordor Intelligence | |||
Fragmented EHR/CMMS Interoperability Standards
Hospitals juggle multiple EHR instances, each demanding USD 50,000–200,000 custom interfaces before maintenance data can enrich clinical decisions.[3]Leah Hummel, “DNV Updates Physical Environment Standards,” HFM Magazine, hfmmagazine.com Absent plug-and-play semantics, many providers settle for siloed workflows that blunt analytics power. Industry groups like HL7 are coding FHIR-based profiles, yet uptake lags, especially among smaller vendors.
Shortage Of Certified HTM Technicians
The U.S. alone lacks 15,000 qualified techs, with 35% of the workforce retiring within a decade. Rural hospitals endure 40% vacancy rates, stretching response times. While software can automate scheduling and remote diagnostics, hands-on repairs still require skilled labor, bottlenecking market rollout.
*Our forecasts treat driver/restraint impacts as directional, not additive. The impact forecasts reflect baseline growth, mix effects, and variable interactions.
Segment Analysis
By Deployment Mode: Cloud Migration Accelerates Despite Legacy Resistance
On-premise installations still command 60.9% of 2024 revenue, anchoring the medical equipment repair software market through familiar control and data residency. Yet cloud subscriptions post a blistering 19.3% CAGR, propelled by pay-as-you-go economics and auto-scaling compute. The medical equipment repair software market size for cloud is likely to match the on-premise volume by the late decade, as compliance-certified data centers and zero-trust architectures alleviate security concerns. Hybrid footprints act as safety nets, hosting sensitive workloads locally while shunting analytics to the cloud. Vendors trumpet ISO 27001 and HITRUST badges, and CIOs cite pandemic-era remote-work lessons in steering boards toward SaaS.
Healthcare groups are embracing cloud note smoother user-interface refreshes, instant feature drops, and reduced patch backlogs. Field engineers access the same dashboards from smartphones, improving mean time to repair. These efficiency gains, amplified across large fleets, generate ROI cases that override sunk-cost loyalties to on-premise estates. Accordingly, procurement RFPs now stipulate the use of containerized microservices for future portability, signaling an inexorable shift in the medical equipment repair software market.


By End User: ISOs Challenge Hospital In-House Models
Hospitals and health systems accounted for 70.3% of 2024 spending, driven by accreditation requirements and extensive device inventories. Nevertheless, Independent Service Organizations log a 17.5% CAGR as administrators outsource non-core maintenance. The medical equipment repair software market share for ISOs remains modest but surges where multi-site networks seek vendor neutrality. ISO platforms collect data from disparate OEMs, then benchmark performance across clients to refine predictive rule sets. Providers, in turn, achieve 25–30% service savings, along with uptime improvements validated by dashboard SLAs.
Diagnostic imaging centers and ambulatory surgery facilities, though smaller buyers, present lucrative whitespace. Their specialized modalities demand regulatory-compliant logs, and cloud portals are limited to on-site IT resources. Consequently, tailored mid-tier offerings are emerging, thereby expanding the market size of medical equipment repair software across outpatient care.
Geography Analysis
North America retained a 37.7% share in 2024, underpinned by FDA cyber regulations, value-based payment schemes, and a dense lattice of ISOs. Hospitals chasing 99.5% uptime embed AI modules to avoid steep performance penalties. Venture funding into digital-health start-ups also accelerates integrations that knit repair data into EMR and finance systems.
The Asia Pacific region records the swiftest 13.9% CAGR, reflecting massive hospital construction and national e-health initiatives. Governments in China and India subsidize IoT-readiness and local language training, encouraging adoption of cloud dashboards over capital-heavy servers. Regional service hubs are springing up in Singapore and Bangalore, nurturing a skilled workforce that helps narrow the technician gap.
Europe exhibits steady growth as GDPR-aligned security functions become purchase prerequisites. The updated EU Medical Device Regulation expands the documentation scope, encouraging facilities to adopt automated compliance logs. Cloud take-up rises in the Nordics and Benelux, whereas Germany favors hybrid models due to stricter data-sovereignty norms. Latin America, the Middle East, and Africa trail but register improving pipelines as private operators modernize flagship hospitals.

Competitive Landscape
The medical equipment repair software market exhibits a mid-tier concentration, with no vendor exceeding a 15% share. IBM Maximo, Siemens Teamcenter, and ServiceNow leverage enterprise roots to package asset modules inside broader IT platforms. Accruent, Brightly Software, and TMA Systems counter by doubling down on healthcare-specific workflows and regulatory reporting. Differentiation revolves around AI accuracy, mobile usability, and one-click IoT onboarding.
Strategically, incumbents pursue bolt-on acquisitions that fill cloud gaps or add layers of cyber-compliance. ServiceNow’s 2025 Yokohama release wove predictive workflows natively into its ITSM suite, signaling platform convergence. Meanwhile, Agilent’s acquisition of Sigsense integrated lab-instrument telemetry into asset dashboards, highlighting its vertical expansion.
Customers rank vendor resilience and ecosystem depth alongside feature count. Thus, partnerships with cloud hyperscalers—exemplified by ServiceNow and Google Cloud—score points for AI scalability. As cyber threats multiply, providers embedding real-time vulnerability scanning earn procurement preference.
Medical Equipment Repair Software Industry Leaders
Accruent
IBM
Brightly Software
Infor EAM
Siemens
- *Disclaimer: Major Players sorted in no particular order

Recent Industry Developments
- December 2024: ServiceNow launched Yokohama, adding AI agents that automate maintenance scheduling and integrate with hospital IT stacks.
- August 2024: ServiceNow and Google Cloud deepened collaboration to fuse BigQuery analytics with predictive equipment workflows.
- July 2024: Agilent Technologies purchased Sigsense, layering AI monitoring into its CrossLab Connect platform.


Global Medical Equipment Repair Software Market Report Scope
| On-premise |
| Cloud/SaaS |
| Hybrid |
| Hospitals & Health Systems |
| Diagnostic Imaging Centers |
| Ambulatory Surgical Centers |
| Others |
| North America | United States |
| Canada | |
| Mexico | |
| Europe | Germany |
| United Kingdom | |
| France | |
| Italy | |
| Spain | |
| Rest of Europe | |
| Asia-Pacific | China |
| Japan | |
| India | |
| South Korea | |
| Australia | |
| Rest of the Asia-Pacific | |
| Middle East & Africa | GCC |
| South Africa | |
| Rest of Middle East & Africa | |
| South America | Brazil |
| Argentina | |
| Rest of South America |
| By Deployment Mode | On-premise | |
| Cloud/SaaS | ||
| Hybrid | ||
| By End User | Hospitals & Health Systems | |
| Diagnostic Imaging Centers | ||
| Ambulatory Surgical Centers | ||
| Others | ||
| By Geography | North America | United States |
| Canada | ||
| Mexico | ||
| Europe | Germany | |
| United Kingdom | ||
| France | ||
| Italy | ||
| Spain | ||
| Rest of Europe | ||
| Asia-Pacific | China | |
| Japan | ||
| India | ||
| South Korea | ||
| Australia | ||
| Rest of the Asia-Pacific | ||
| Middle East & Africa | GCC | |
| South Africa | ||
| Rest of Middle East & Africa | ||
| South America | Brazil | |
| Argentina | ||
| Rest of South America | ||


Key Questions Answered in the Report
How large is the medical equipment repair software market in 2025?
The medical equipment repair software market size is USD 68.4 million in 2025.
What CAGR is projected for medical-equipment repair software through 2030?
The market is forecast to grow at a 9.30% CAGR between 2025 and 2030.
Which region is expanding fastest for maintenance software adoption?
Asia Pacific registers the highest growth at a 13.9% CAGR through 2030.
Why are Independent Service Organizations gaining traction?
ISOs deliver 20-30% cost savings and multi-vendor expertise, driving a 17.5% CAGR in their software spending.
How are AI analytics improving equipment uptime?
Predictive algorithms cut downtime by up to 35% and extend asset life 15-20%, directly supporting value-based reimbursement goals.
What deployment trend is reshaping buyer preferences?
Cloud/SaaS platforms, growing at 19.3% CAGR, are overtaking legacy on-premise installations due to subscription pricing and seamless updates.
Page last updated on:


