Pineapple Market Size and Share
Pineapple Market Analysis by Mordor Intelligence
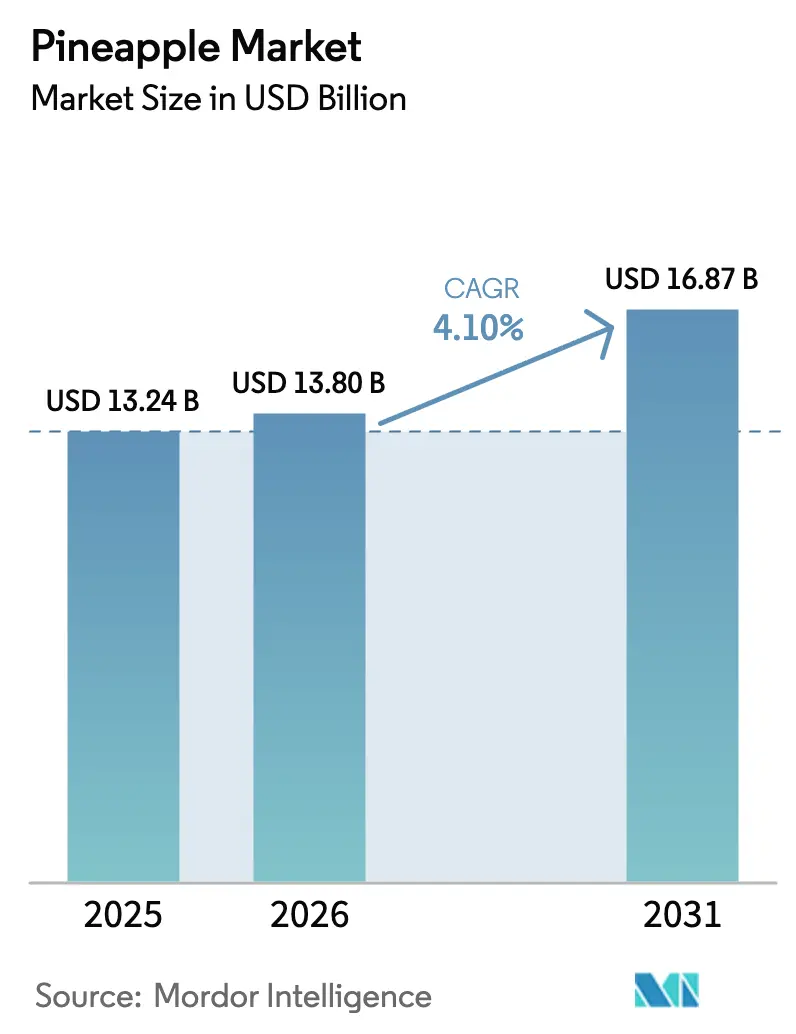
The pineapple market size is projected to increase from USD 13.24 billion in 2025 to USD 13.80 billion in 2026 and reach USD 16.87 billion by 2031, growing at a CAGR of 4.10% over 2026-2031. Strong consumption in the Asia-Pacific region, income gains in emerging economies, and tariff liberalization in key trade corridors sustain steady volume growth, even as production remains tied to tropical and subtropical climates that permit year-round cultivation. Expanded cold-chain infrastructure, cultivar research that extends viable growing zones, and automation in fresh-cut processing reinforce supply reliability while creating new margin pools. Nonetheless, disease outbreaks, shipping cost volatility, and tightening residue standards create a risk landscape that rewards exporters who can invest in integrated pest management, logistics agility, and verifiable traceability. Geography, therefore, outweighs product innovation in shaping competitive advantage within the pineapple market, as proximity to buyers and favorable trade pacts translate into lower spoilage, faster inventory turns, and stronger bargaining power.
Key Report Takeaways
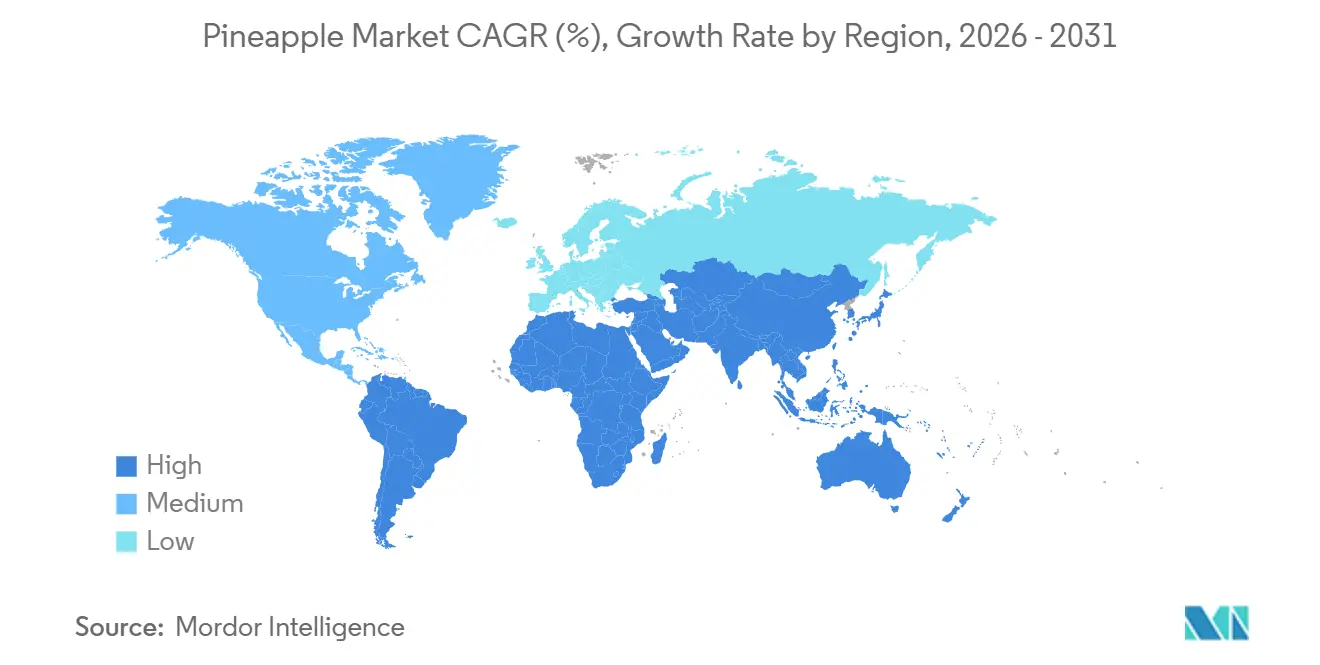
- By geography, Asia-Pacific captured 47.8% pineapple market share in 2025, driven by the Philippines and Thailand, while Africa is forecast to post the fastest 6.4% CAGR through 2031, led by West African exporters leveraging duty-free access to the European Union.
Note: Market size and forecast figures in this report are generated using Mordor Intelligence’s proprietary estimation framework, updated with the latest available data and insights as of January 2026.
Global Pineapple Market Trends and Insights
Drivers Impact Analysis*
| Driver | (~) % Impact on CAGR Forecast | Geographic Relevance | Impact Timeline |
|---|---|---|---|
| Expanding health‐focused fruit diets | +0.8% | Global, with premium demand in North America and European Union (EU) | Medium term (2-4 years) |
| Growing global household income | +0.6% | Asia-Pacific core, spill-over to Middle East and Africa | Long term (≥ 4 years) |
| Trade liberalization in tropical fruits | +0.4% | Global, early gains in Indonesia-United States (US) corridor | Short term (≤ 2 years) |
| Rise of fresh‐cut pineapple automation | +0.5% | North America and EU, expanding to Asia-Pacific | Medium term (2-4 years) |
| Cultivar innovation for cold tolerance | +0.3% | Temperate regions expanding cultivation zones | Long term (≥ 4 years) |
| Blockchain traceability premiums | +0.2% | EU and North America premium segments | Medium term (2-4 years) |
| Source: Mordor Intelligence | |||


Expanding Health-Focused Fruit Diets
Growing awareness of bromelain’s anti-inflammatory and digestive benefits positions pineapple as a functional food rather than a discretionary treat. Nutritionists include fresh pineapple in plant-forward diets aimed at weight management and metabolic health, thereby boosting per-capita intake in markets where chronic inflammation is a concern[1]Source: National Institutes of Health, “Bromelain: Biochemistry, Pharmacology and Medical Use,” nih.gov . Fresh-cut convenience formats support this trend, as automated portioning and modified-atmosphere packs lower labor costs by 30% and extend shelf life, making ready-to-eat pineapple price-competitive with whole fruit. Health messaging, combined with convenience, helps the United States increase horticultural imports to USD 32.4 billion in 2024, with pineapple volumes rising even as other tropical fruits plateau. Retailers highlight the antioxidant content on pack fronts, reinforcing demand during economic slowdowns, as consumers view the fruit as an affordable wellness staple. This steady pull-through underpins premium positioning in supermarket produce aisles and food-service menus.
Growing Global Household Income
Rising disposable income enables consumers in the Asia-Pacific and Middle East regions to diversify their diets beyond staple grains. China's expanding middle class is projected to consume 680,000 metric tons of pineapple fruits from the Philippines in 2024, providing stability for producers against price fluctuations in saturated Western markets[2]Source: Philippine Statistics Authority, “Agricultural Production Statistics,” psa.gov.ph. Volume growth in India, Indonesia, and Nigeria is projected to track gross domestic product gains, as consumers allocate a larger portion of their food budgets to fruit perceived as aspirational and healthy. Income-linked demand underwrites long-term volume expansion even if mature markets approach saturation. Retailers respond with year-round merchandising and promotions timed to coincide with festive periods when fruit gifting spikes.
Trade Liberalization in Tropical Fruits
Tariff reductions make imported pineapple more affordable relative to domestic substitutes grown in high-cost greenhouses. Israel’s 2022 duty removal on Costa Rican fruit cut shelf prices by half and doubled household purchases within two years. The European Union’s Everything But Arms program grants duty-free status to the least-developed exporters in Africa, allowing Benin and Ghana to undercut Latin American suppliers while benefiting from shorter voyages that ensure quality[3]Source: European Commission, “Trade Policy,” ec.europa.eu. Such pacts accelerate the flow of fresh and canned products into Europe and North America, forcing incumbent suppliers to raise efficiency or focus on higher grades. The net result is a broader sourcing base that raises competitive pressure but enlarges the overall pineapple market.
Rise of Fresh-Cut Pineapple Automation
Robotic peeling, coring, and portioning trim labor by up to 35% and deliver uniform cuts prized by retailers running grab-and-go programs. Capital investment between USD 2 million and USD 5 million favors processors with multi-site volumes, prompting consolidation as mid-scale firms struggle to finance equipment. Fresh-cut packs often sell at a 40% premium over whole fruit on a per-kilogram basis, thereby cushioning the payback periods for automation. Retailers value predictable cube sizes that speed deli preparation and reduce back-room waste. Institutional buyers, including airlines and hotel chains, are increasingly specifying pre-sliced formats, thereby expanding the addressable channel for automated operators.
Restraints Impact Analysis*
| Restraint | (~) % Impact on CAGR Forecast | Geographic Relevance | Impact Timeline |
|---|---|---|---|
| Bacterial wilt and mealy-bug wilt disease | -0.9% | Global, severe in Hawaii and Caribbean | Short term (≤ 2 years) |
| Volatile freight and container shortages | -0.7% | Global trade routes, acute in Pacific corridors | Short term (≤ 2 years) |
| Stricter ethylene residue limits | -0.3% | Export-dependent regions to European Union (EU) and North America | Medium term (2-4 years) |
| Land-use conflicts with solar leasing | -0.2% | Arable regions with high solar irradiation | Long term (≥ 4 years) |
| Source: Mordor Intelligence | |||
Bacterial Wilt and Mealy-Bug Wilt Disease
Phytophthora and mealybug-borne pathogens can reduce yields by up to 50% within a single crop cycle, necessitating entire field rotations and two-year fallow periods. Certified planting material and integrated pest management add USD 500 to USD 800 per hectare in annual costs, a burden that many smallholders cannot bear. Lack of resistant commercial varieties makes disease a persistent threat that constrains supply elasticity. Climate variability induces moisture swings that favor pathogen proliferation, intensifying management challenges. Losses raise break-even prices and can trigger short-term price spikes in importing regions.
Volatile Freight and Container Shortages
Pineapples require refrigerated containers and arrive with shelf life already ticking, so voyage delays translate into higher shrink and retail markdowns. In 2024, contracted Philippine exporters faced spot rates 200% above normal levels and diverted fruit to lower-value buyers when Asia-Europe reefer space became scarce. Competitive access to reefers is limited because seafood and pharmaceuticals command higher margins, leaving fruit exporters price-takers on equipment. Distant origins, such as the Philippines, face longer routes than Costa Rica, magnifying cost swings. Persistent volatility may encourage near-market greenhouse production despite higher growing costs.
*Our forecasts treat driver/restraint impacts as directional, not additive. The impact forecasts reflect baseline growth, mix effects, and variable interactions.
Geography Analysis
The Asia-Pacific captured 47.8% pineapple market share in 2025, leveraging its scale, agronomic expertise, and vertically integrated processors that meet stringent buyer protocols. The Philippines relies on large estates with proprietary plant genetics, while Thailand arranges contract farming that feeds export canneries. China occupies a dual role as both producer and importer, testing cold-tolerant clones in Hainan to curb its rising dependency. Indonesia’s archipelago geography enables staggered harvests, which smooth out supply gaps. Market participants in the region leverage extensive port networks and established cold-chain operators to reach North American retailers within acceptable shelf-life windows.
Africa is forecast to post the fastest 6.4% CAGR of the pineapple market size through 2031. Africa’s emerging exporters benefit from geographic proximity to European consumers and from policies that nurture and streamline phytosanitary clearance. Ghana and Benin prioritize certification to differentiate their fruit on crowded import shelves. Kenya’s access to modern canning capacity demonstrates progress toward moving up the value chain, notwithstanding still modest output. Nigeria’s large domestic market provides a buffer against price shocks. Logistics bottlenecks and power stability issues hinder consistent cold storage. Continued investment in rural roads, packhouses, and container terminals will determine whether the region converts its natural advantage into a lasting competitive edge.
In Europe and North America, the majority of demand for pineapples is fulfilled through imports, with Costa Rica being a key supplier for fresh pineapple arrivals in the European Union. The European Union primarily imports fruits and nuts, including canned pineapple. In 2023, French pineapple juice consumption remained high, highlighting the resilience of the beverage industry. The United States has been importing increasing volumes of ready-to-eat pineapple cubes to meet the needs of convenience-focused consumers. In the Middle East, demand remains price-inelastic due to high per-capita income and limited domestic production. In South America, led by Brazil, the market is predominantly focused on domestic consumption, as inland transportation costs from farms to ports make exports less competitive.

Competitive Landscape
Del Monte Pacific manages a global pineapple supply chain, integrating 17,000 hectares of plantations with canning and fresh-cut facilities to serve supermarket and food-service channels. Fresh Del Monte Produce and Dole Food Company utilize multi-origin procurement strategies across South America and Asia, ensuring consistent weekly deliveries. Their extensive fleets of chartered reefers reduce transit times and enhance negotiating power with carriers.
Mid-tier processors in Costa Rica, Ghana, and Indonesia occupy the remaining space in the pineapple industry, often serving fair-trade segments. Rising compliance costs for blockchain traceability and automation nudge smaller firms toward partnerships or acquisitions. African entrants use European duty-free access and shorter routes to offset limited scale. Meanwhile, Chinese research on cold-tolerant cultivars could eventually pull some supply inside temperate regions, challenging established tropical exporters.
Strategic moves since 2024 illustrate the sector’s dynamic nature. Del Monte Pacific invested USD 45 million to expand Bukidnon capacity with hyperspectral defect detection, aiming at North American retail range resets. Dole Food Company entered a joint venture in Thailand to add 50,000 metric tons of canned capacity, aligning local supply with Association of Southeast Asian Nations demand growth. Fresh Del Monte acquired 5,000 hectares in Ghana, gaining freight advantage into Europe and diversifying climate risk. Subsidy programs in Costa Rica support smallholders adopting integrated pest management, safeguarding the country’s export leadership.
Recent Industry Developments
- May 2025: The United States Department of Agriculture (USDA) has approved fresh pineapple imports from Indonesia following a positive pest risk analysis. This decision marks a significant development, as it opens a new supply channel to North America, providing an opportunity for increased trade and diversification of pineapple sources in the region.
- May 2025: The largest national federation of pineapple growers’ cooperatives in Benin, along with the Benin Pineapple Exporters Association, has signed a significant agreement to integrate over 2,500 farmers into a unified traceability and sourcing framework.
- January 2025: Del Monte Pacific formalized plans for a USD 45 million expansion of its Bukidnon pineapple processing facility in the Philippines. This expansion increases the facility's annual fresh-cut pineapple capacity by 30,000 metric tons and incorporates automated sorting lines with hyperspectral imaging technology to identify internal defects.


Research Methodology Framework and Report Scope
Market Definitions and Key Coverage
Our study defines the global pineapple market as the annual farm-gate value of commercially grown fresh pineapples that fall under HS-080430, tracked through production, domestic consumption, and cross-border trade flows that are converted to USD at prevailing average export prices.
Scope exclusion: processed formats such as canned fruit, juice, dried slices, and bromelain extracts are quantified separately and therefore lie outside this valuation.
Segmentation Overview
- By Geography
- North America
- United States
- Production Analysis (Area Harvested, Yield, and Production Volume)
- Consumption Analysis (Consumption Value and Volume)
- Import Market Analysis (Import Value, Volume, and Key Supplying Markets)
- Export Market Analysis (Export Value, Volume, and Key Destination Markets)
- Wholesale Price Trend Analysis and Forecast
- Regulatory Framework
- List of Key Players
- Logistics and Infrastructure
- Seasonality Analysis
- Mexico
- Production Analysis (Area Harvested, Yield, and Production Volume)
- Consumption Analysis (Consumption Value and Volume)
- Import Market Analysis (Import Value, Volume, and Key Supplying Markets)
- Export Market Analysis (Export Value, Volume, and Key Destination Markets)
- Wholesale Price Trend Analysis and Forecast
- Regulatory Framework
- List of Key Players
- Logistics and Infrastructure
- Seasonality Analysis
- United States
- Europe
- Germany
- Production Analysis (Area Harvested, Yield, and Production Volume)
- Consumption Analysis (Consumption Value and Volume)
- Import Market Analysis (Import Value, Volume, and Key Supplying Markets)
- Export Market Analysis (Export Value, Volume, and Key Destination Markets)
- Wholesale Price Trend Analysis and Forecast
- Regulatory Framework
- List of Key Players
- Logistics and Infrastructure
- Seasonality Analysis
- United Kingdom
- Production Analysis (Area Harvested, Yield, and Production Volume)
- Consumption Analysis (Consumption Value and Volume)
- Import Market Analysis (Import Value, Volume, and Key Supplying Markets)
- Export Market Analysis (Export Value, Volume, and Key Destination Markets)
- Wholesale Price Trend Analysis and Forecast
- Regulatory Framework
- List of Key Players
- Logistics and Infrastructure
- Seasonality Analysis
- France
- Production Analysis (Area Harvested, Yield, and Production Volume)
- Consumption Analysis (Consumption Value and Volume)
- Import Market Analysis (Import Value, Volume, and Key Supplying Markets)
- Export Market Analysis (Export Value, Volume, and Key Destination Markets)
- Wholesale Price Trend Analysis and Forecast
- Regulatory Framework
- List of Key Players
- Logistics and Infrastructure
- Seasonality Analysis
- Spain
- Production Analysis (Area Harvested, Yield, and Production Volume)
- Consumption Analysis (Consumption Value and Volume)
- Import Market Analysis (Import Value, Volume, and Key Supplying Markets)
- Export Market Analysis (Export Value, Volume, and Key Destination Markets)
- Wholesale Price Trend Analysis and Forecast
- Regulatory Framework
- List of Key Players
- Logistics and Infrastructure
- Seasonality Analysis
- Russia
- Production Analysis (Area Harvested, Yield, and Production Volume)
- Consumption Analysis (Consumption Value and Volume)
- Import Market Analysis (Import Value, Volume, and Key Supplying Markets)
- Export Market Analysis (Export Value, Volume, and Key Destination Markets)
- Wholesale Price Trend Analysis and Forecast
- Regulatory Framework
- List of Key Players
- Logistics and Infrastructure
- Seasonality Analysis
- Germany
- Asia-Pacific
- India
- Production Analysis (Area Harvested, Yield, and Production Volume)
- Consumption Analysis (Consumption Value and Volume)
- Import Market Analysis (Import Value, Volume, and Key Supplying Markets)
- Export Market Analysis (Export Value, Volume, and Key Destination Markets)
- Wholesale Price Trend Analysis and Forecast
- Regulatory Framework
- List of Key Players
- Logistics and Infrastructure
- Seasonality Analysis
- Indonesia
- Production Analysis (Area Harvested, Yield, and Production Volume)
- Consumption Analysis (Consumption Value and Volume)
- Import Market Analysis (Import Value, Volume, and Key Supplying Markets)
- Export Market Analysis (Export Value, Volume, and Key Destination Markets)
- Wholesale Price Trend Analysis and Forecast
- Regulatory Framework
- List of Key Players
- Logistics and Infrastructure
- Seasonality Analysis
- Philippines
- Production Analysis (Area Harvested, Yield, and Production Volume)
- Consumption Analysis (Consumption Value and Volume)
- Import Market Analysis (Import Value, Volume, and Key Supplying Markets)
- Export Market Analysis (Export Value, Volume, and Key Destination Markets)
- Wholesale Price Trend Analysis and Forecast
- Regulatory Framework
- List of Key Players
- Logistics and Infrastructure
- Seasonality Analysis
- China
- Production Analysis (Area Harvested, Yield, and Production Volume)
- Consumption Analysis (Consumption Value and Volume)
- Import Market Analysis (Import Value, Volume, and Key Supplying Markets)
- Export Market Analysis (Export Value, Volume, and Key Destination Markets)
- Wholesale Price Trend Analysis and Forecast
- Regulatory Framework
- List of Key Players
- Logistics and Infrastructure
- Seasonality Analysis
- Thailand
- Production Analysis (Area Harvested, Yield, and Production Volume)
- Consumption Analysis (Consumption Value and Volume)
- Import Market Analysis (Import Value, Volume, and Key Supplying Markets)
- Export Market Analysis (Export Value, Volume, and Key Destination Markets)
- Wholesale Price Trend Analysis and Forecast
- Regulatory Framework
- List of Key Players
- Logistics and Infrastructure
- Seasonality Analysis
- India
- South America
- Brazil
- Production Analysis (Area Harvested, Yield, and Production Volume)
- Consumption Analysis (Consumption Value and Volume)
- Import Market Analysis (Import Value, Volume, and Key Supplying Markets)
- Export Market Analysis (Export Value, Volume, and Key Destination Markets)
- Wholesale Price Trend Analysis and Forecast
- Regulatory Framework
- List of Key Players
- Logistics and Infrastructure
- Seasonality Analysis
- Argentina
- Production Analysis (Area Harvested, Yield, and Production Volume)
- Consumption Analysis (Consumption Value and Volume)
- Import Market Analysis (Import Value, Volume, and Key Supplying Markets)
- Export Market Analysis (Export Value, Volume, and Key Destination Markets)
- Wholesale Price Trend Analysis and Forecast
- Regulatory Framework
- List of Key Players
- Logistics and Infrastructure
- Seasonality Analysis
- Brazil
- Middle East
- Saudi Arabia
- Production Analysis (Area Harvested, Yield, and Production Volume)
- Consumption Analysis (Consumption Value and Volume)
- Import Market Analysis (Import Value, Volume, and Key Supplying Markets)
- Export Market Analysis (Export Value, Volume, and Key Destination Markets)
- Wholesale Price Trend Analysis and Forecast
- Regulatory Framework
- List of Key Players
- Logistics and Infrastructure
- Seasonality Analysis
- United Arab Emirates
- Production Analysis (Area Harvested, Yield, and Production Volume)
- Consumption Analysis (Consumption Value and Volume)
- Import Market Analysis (Import Value, Volume, and Key Supplying Markets)
- Export Market Analysis (Export Value, Volume, and Key Destination Markets)
- Wholesale Price Trend Analysis and Forecast
- Regulatory Framework
- List of Key Players
- Logistics and Infrastructure
- Seasonality Analysis
- Saudi Arabia
- Africa
- Nigeria
- Production Analysis (Area Harvested, Yield, and Production Volume)
- Consumption Analysis (Consumption Value and Volume)
- Import Market Analysis (Import Value, Volume, and Key Supplying Markets)
- Export Market Analysis (Export Value, Volume, and Key Destination Markets)
- Wholesale Price Trend Analysis and Forecast
- Regulatory Framework
- List of Key Players
- Logistics and Infrastructure
- Seasonality Analysis
- South Africa
- Production Analysis (Area Harvested, Yield, and Production Volume)
- Consumption Analysis (Consumption Value and Volume)
- Import Market Analysis (Import Value, Volume, and Key Supplying Markets)
- Export Market Analysis (Export Value, Volume, and Key Destination Markets)
- Wholesale Price Trend Analysis and Forecast
- Regulatory Framework
- List of Key Players
- Logistics and Infrastructure
- Seasonality Analysis
- Nigeria
- North America
Detailed Research Methodology and Data Validation
Primary Research
Mordor analysts supplement secondary trends through interviews with plantation agronomists, export-terminal managers, refrigerated-cargo brokers, and procurement leads at retail chains across Latin America, Southeast Asia, Europe, and North America. These conversations clarify yield forecasts, disease prevalence, freight costs, and typical free-on-board (FOB) values, helping us validate model breakpoints and fine-tune assumptions.
Desk Research
We begin with structured data pulls from tier-1 public repositories such as FAOSTAT, UN Comtrade, ITC Trade Map, and USDA-FAS to capture volume and price series across producer and importer blocs. Complementary insights are drawn from regional statistics offices (PhilMech, IBGE), trade association briefs from the Fresh Produce Association of the Americas, and academic journals that monitor crop disease incidence and yield response. To enrich company-level positioning, D&B Hoovers and Dow Jones Factiva supply shipment mentions and revenue signals. This list, while illustrative, is not exhaustive; many other open-source records inform our desk work.
Market-Sizing & Forecasting
A top-down construct converts country-level production and bilateral trade volumes into a net-supply ledger, which is then priced using weighted FOB averages. Selective bottom-up cross-checks (sampled grower throughput × average selling price) guard against hidden skews. Key model drivers include hectares harvested, average yield per hectare, container freight indices, plant disease incidence rates, consumer spend on fresh fruit, and real effective exchange rates. Five-year forecasts employ multivariate regression blended with ARIMA overlays, and scenario envelopes are reviewed with field experts before values lock. Data gaps, for example, in minor producer states, are bridged by three-year moving averages adjusted for regional weather deviations.
Data Validation & Update Cycle
Outputs undergo variance checks against independent FAO trade dashboards; any anomaly above a 5% threshold triggers re-validation calls. Two analysts review each workbook before sign-off. The study refreshes annually, with interim updates if extreme weather, phytosanitary restrictions, or freight shocks materially alter supply or price baselines.
Why Mordor's Pineapple Baseline Inspires Confidence
Published figures for the pineapple economy often differ because firms mix fresh and processed categories, choose divergent price anchors, or apply aggressive demand multipliers.
Key gap drivers include (i) inclusion of canned and juice revenues, (ii) CIF versus FOB valuation of trade flows, and (iii) differing refresh cadences that miss recent freight resets.
Benchmark comparison
| Market Size | Anonymized source | Primary gap driver |
|---|---|---|
| USD 11.96 B (2025) | Mordor Intelligence | - |
| USD 29.13 B (2025) | Global Consultancy A | Bundles processed formats and values imports at CIF, with limited primary validation. |
| USD 23.80 B (2024) | Regional Consultancy B | Adds juice revenues and applies uniform ASP uplift across regions. |
The comparison shows that once processed derivatives and higher price bases are stripped out, estimates converge toward Mordor's disciplined fresh-fruit scope. Clients therefore gain a transparent, reproducible baseline they can trace to clearly cited variables and repeatable steps.


Key Questions Answered in the Report
How large is the pineapple market in 2026 and how fast is it growing?
The pineapple market is valued at USD 13.80 billion in 2026 and is projected to expand at a 4.10% CAGR to reach USD 16.87 billion by 2031.
Which region holds the largest share of global trade?
Asia-Pacific leads with 47.8% share in 2025, due to the Philippines fresh exports and Thailand's canning dominance.
Which region will grow the fastest through 2031?
Africa is forecast to post the fastest 6.4% CAGR, supported by duty-free access to the European Union and shorter shipping routes.
What key risks threaten supply stability?
Major risks include bacterial wilt disease, freight volatility due to reefer shortages, stricter residue rules for ethylene, and land conversion to solar energy projects.
Page last updated on:


