
Organic Fruits And Vegetables Market Size and Share
Market Overview
| Study Period | 2021 - 2031 |
|---|---|
| Market Size (2026) | USD 89.5 Billion |
| Market Size (2031) | USD 138.90 Billion |
| Growth Rate (2026 - 2031) | 9.20% CAGR |
| Fastest Growing Market | Asia Pacific |
| Largest Market | North America |
| Market Concentration | Low |
Major Players *Disclaimer: Major Players sorted in no particular order Image © Mordor Intelligence. Reuse requires attribution under CC BY 4.0. | |
Organic Fruits And Vegetables Market Analysis by Mordor Intelligence
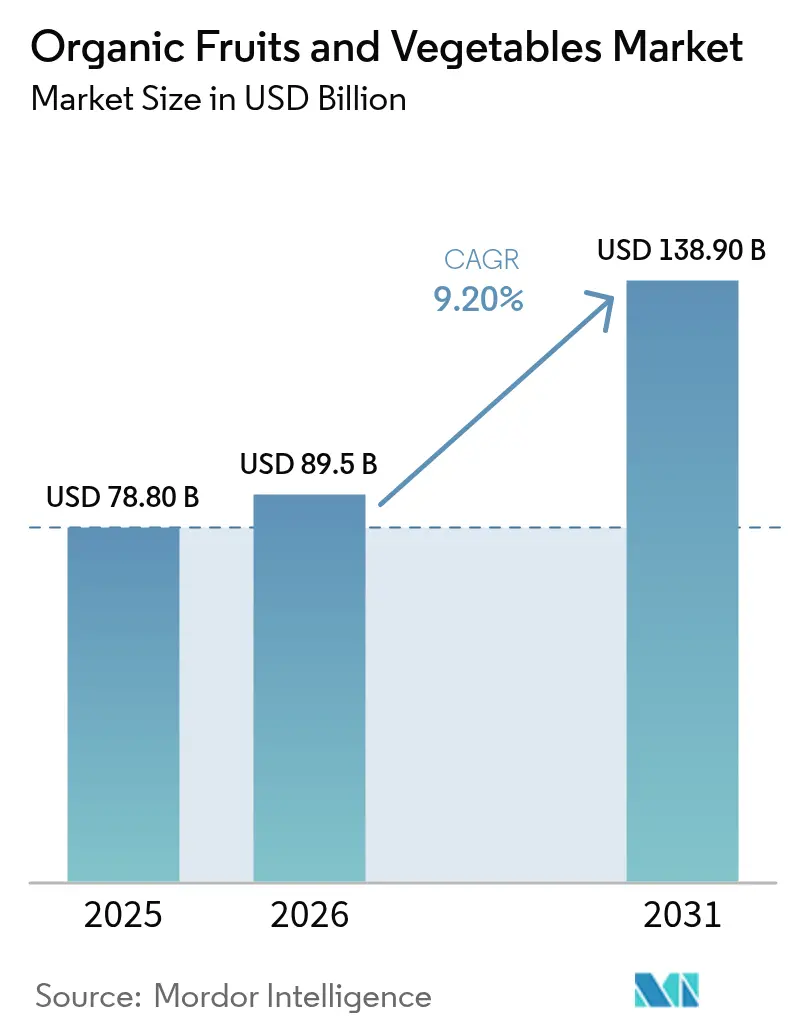
The organic fruits and vegetables market size was valued at USD 78.8 billion in 2025 and estimated to grow from USD 89.5 billion in 2026 to reach USD 138.9 billion by 2031, at a CAGR of 9.20% during the forecast period (2026-2031). Strong health awareness, expanding policy incentives, and maturing cold-chain logistics are widening the customer base beyond early adopters. Retailers are giving larger shelf space to certified produce as residue findings on conventional items sharpen consumer risk perception. On the supply side, subsidized transition programs in the United States and the European Union are shortening payback periods, encouraging mid-sized growers to convert acreage. Online platforms are translating that momentum into double-digit volume growth as next-day delivery becomes reliable in major cities. Private capital is also flowing toward soil-health technologies, bringing scale efficiencies that help offset yield penalties. Collectively, these forces keep the organic fruits and vegetables market on an expansion trajectory even as macro headwinds pressure discretionary spending.
Key Report Takeaways
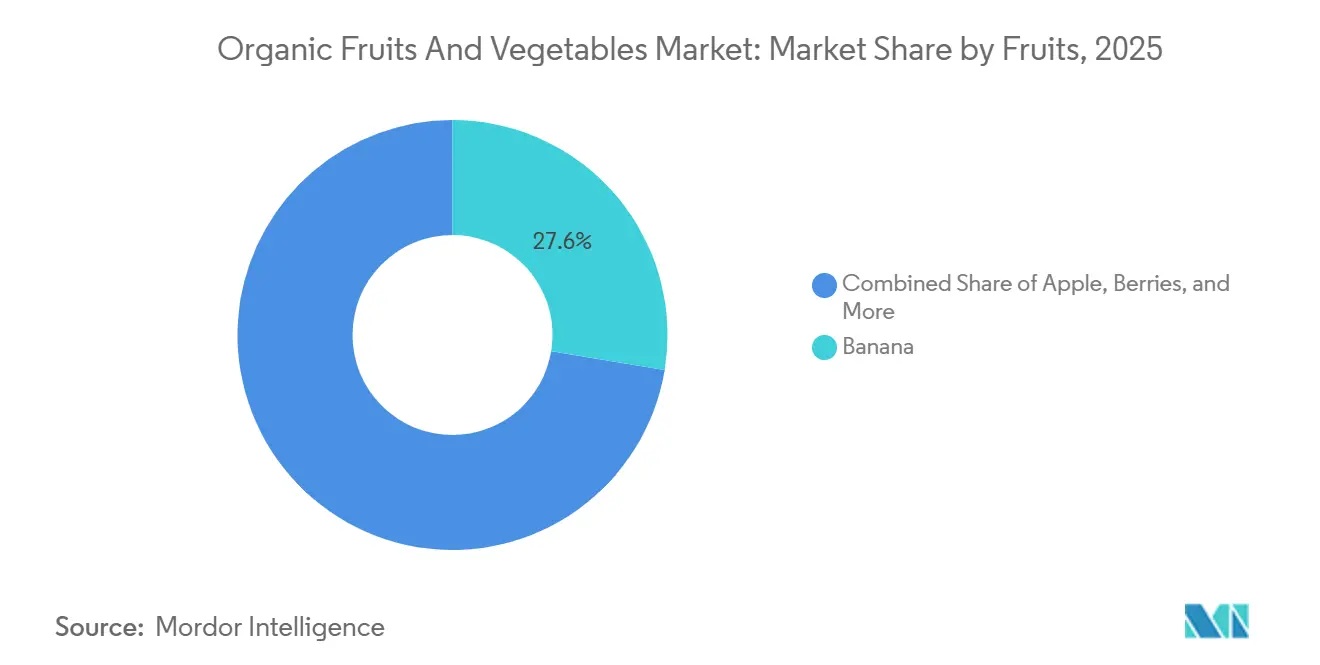
- By fruit type, bananas were the largest segment, accounting for 27.6% of the organic fruits and vegetables market share in 2025, whereas berries were projected to be the fastest-growing segment, advancing at an 11.6% CAGR through 2031.
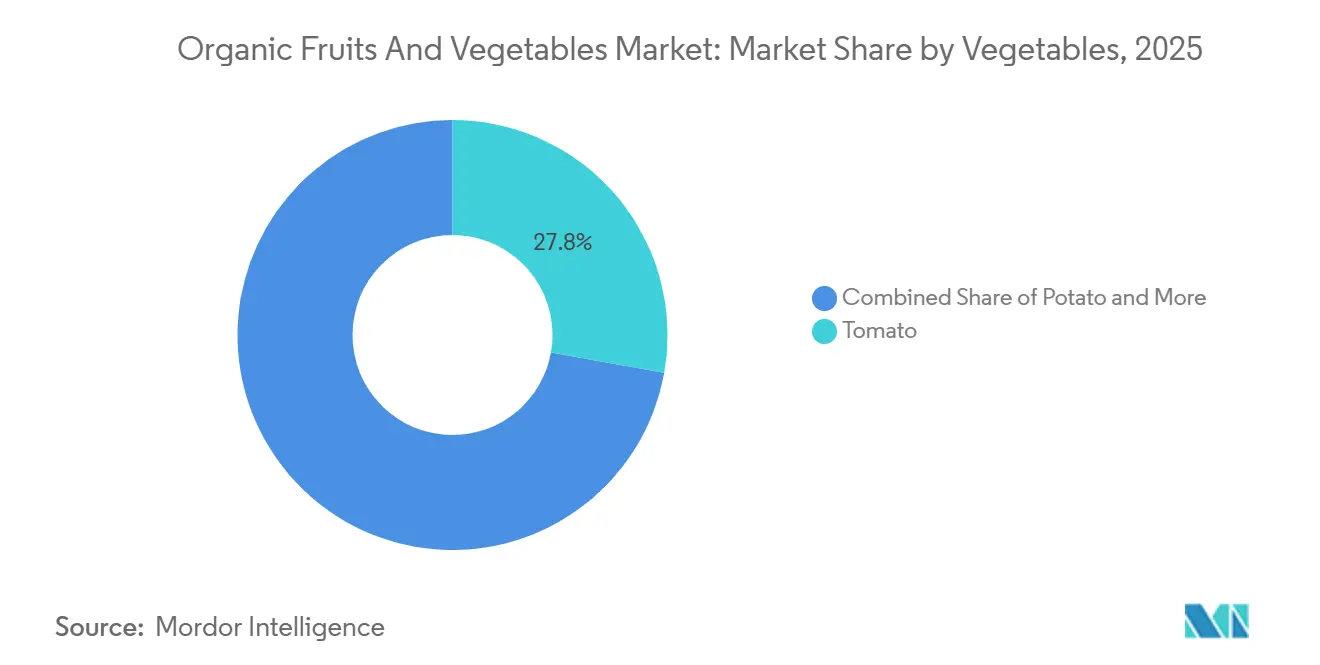
- By vegetable type, tomatoes were the largest segment, accounting for 27.8% of the organic fruits and vegetables market size in 2025, while leafy vegetables are anticipated to be the fastest-growing segment, advancing at a 10.9% CAGR through 2031.
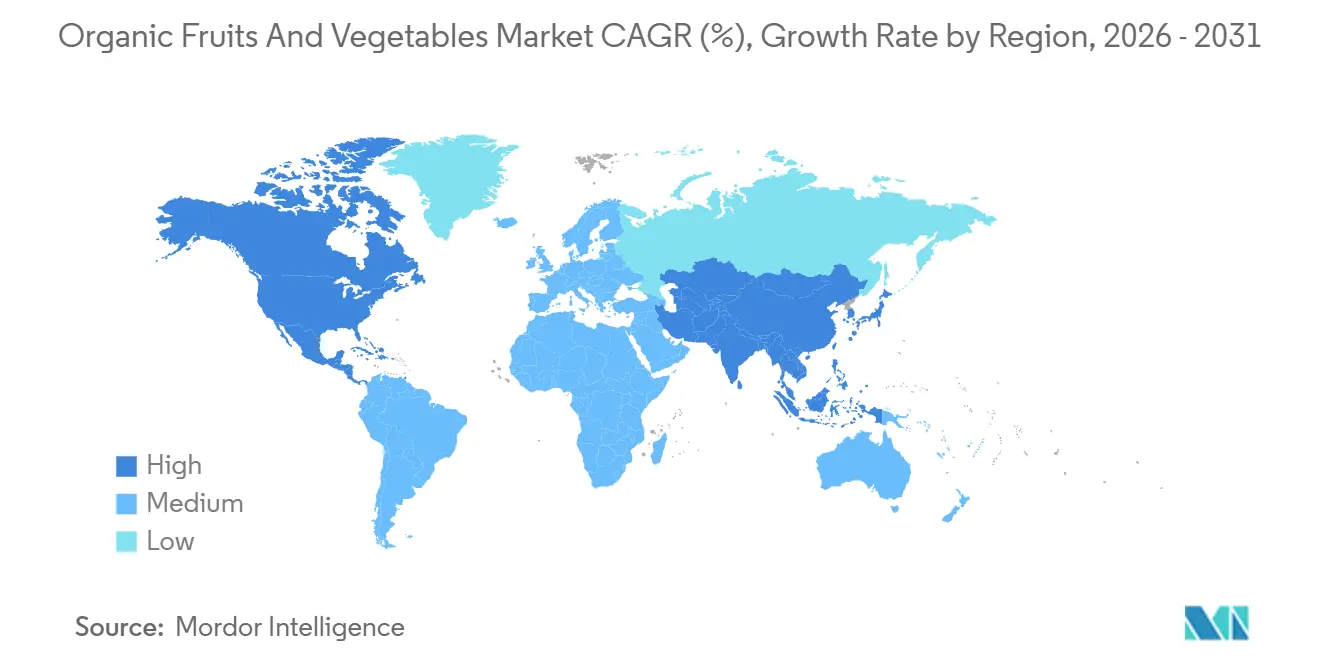
- By geography, North America was the largest region, holding 34.20% of the organic fruits and vegetables market share in 2025, while Asia-Pacific is projected to exhibit the fastest-growing region, advancing at a 10.0% CAGR to 2031.
Note: Market size and forecast figures in this report are generated using Mordor Intelligence’s proprietary estimation framework, updated with the latest available data and insights as of 2026.
Global Organic Fruits And Vegetables Market Trends and Insights
Drivers Impact Analysis*
| Driver | (~) % Impact on CAGR Forecast | Geographic Relevance | Impact Timeline |
|---|---|---|---|
| Health-driven consumer demand surge | +2.8% | Global, with peak intensity in North America, Europe, and urban Asia-Pacific | Medium term (2-4 years) |
| Government conversion subsidies and incentives | +2.1% | North America and Europe core, expanding to India and China | Short term (≤ 2 years) |
| Price premium boosting farm profitability | +1.5% | Global, strongest in North America and Western Europe | Medium term (2-4 years) |
| Environmental, Social, and Governance (ESG)-focused capital favoring climate-resilient supply | +1.3% | North America, Europe, and Australia, and with spillover to South America | Long term (≥ 4 years) |
| Retail-vertical-farm alliances for year-round yields | +0.9% | North America and Europe, pilot projects in Asia-Pacific | Medium term (2-4 years) |
| Regenerative-organic certification unlocking food-service deals | +0.6% | North America and Europe, limited adoption in Asia-Pacific and Middle East | Long term (≥ 4 years) |
| Source: Mordor Intelligence | |||
Health-Driven Consumer Demand Surge
The primary structural driver of the global organic fruit and vegetable market is the ongoing shift toward health-conscious consumption. Consumers increasingly perceive organic produce as having lower pesticide residues, higher nutrient content, and contributing to improved long-term health. Growing awareness of chronic illnesses associated with dietary habits, such as obesity, diabetes, and cardiovascular diseases, has led households to prioritize "clean-label" and minimally processed foods. This trend has driven demand for immune-boosting foods like organic citrus, leafy greens, and berries. Retailers in North America and Europe have reported double-digit growth in organic fresh produce sales, according to the United States Department of Agriculture, retail sales of organic fresh fruits and vegetables reached USD 21.5 billion in 2021 and have shown consistent growth over the past two decades. Even after the pandemic, demand remains structurally high, as health consciousness has become a habitual rather than a temporary behavior.
Government Conversion Subsidies and Incentives
Government policy support is crucial in increasing organic cultivation acreage. Transitioning from conventional to organic farming typically involves a 2–3 year conversion period, during which yields may decline, and farmers are unable to secure organic price premiums. To address this challenge, many governments offer subsidies, technical assistance, and reimbursement for certification costs. In the European Union, the Common Agricultural Policy (CAP) includes eco-schemes that provide financial incentives for adopting organic and regenerative practices. India’s Paramparagat Krishi Vikas Yojana (PKVY) promotes organic cluster development, while China has enhanced its organic certification frameworks to meet growing domestic and export demand. These policy measures directly contribute to increasing the supply of organic fruits and vegetables, supporting stable long-term growth.
Environmental, Social, and Governance-Focused Capital Favoring Climate-Resilient Supply
Environmental, Social, and Governance (ESG) investment flows are increasingly focused on sustainable agriculture. Institutional investors, impact funds, and development banks are prioritizing organic farming due to its reduced use of synthetic chemicals, promotion of soil health, and support for biodiversity. Organic fruit and vegetable production aligns with climate-resilience strategies, including carbon sequestration, reduced fertilizer runoff, and regenerative soil management practices. As food companies face growing pressure to decarbonize their supply chains, they are increasingly sourcing organic and regenerative produce to achieve Scope 3 emissions targets. In 2024, the European Union’s Common Agricultural Policy Eco-Schemes has provided financial incentives to producers for converting and maintaining certified organic farmland. This initiative, part of the European Green Deal's goal to achieve 25% organic farmland by 2030, allocates EUR 612 million (USD 673 million) annually in direct support[2]Source: European Commission, Directorate-General for Agriculture and Rural Development, “Eco-schemes - Agriculture and rural development,” agriculture.ec.europa.eu .
Price Premium Boosting Farm Profitability
Organic fruits and vegetables generally command significant price premiums over their conventional counterparts in retail channels. These premiums help offset lower yields and higher labor costs, enhancing profitability for growers in established markets. The premium pricing structure also encourages new farmers to transition acreage to organic production. In developed markets such as the United States and Western Europe, consumers are willing to pay higher prices due to perceived health and environmental benefits. Retailers support this positioning through differentiated branding and strategic shelf placement. Over time, stable premiums provide long-term financial visibility for producers and investors. For instance, while prices for organic fruits and vegetables increased at a similar rate to conventional products over the past year, individual items showed considerable variation. Between the end of January 2024 and January 2025, the average price increase for organic items was 2.4%, compared to 2.5% for conventional items.
Restraints Impact Analysis*
| Restraint | (~) % Impact on CAGR Forecast | Geographic Relevance | Impact Timeline |
|---|---|---|---|
| Higher unit production cost and yield gaps | -1.8% | Global, most acute in regions with limited organic input availability | Medium term (2-4 years) |
| Certification complexity and audit fatigue | -1.2% | Global, particularly burdensome for smallholders in Asia-Pacific and Africa | Short term (≤ 2 years) |
| Biological-input shortages in organic supply chains | -0.9% | Global, with acute shortages in Asia-Pacific and South America | Medium term (2-4 years) |
| Retailer carbon-footprint caps on long-haul perishables | -0.7% | Europe and North America, affecting suppliers in South America and Africa | Long term (≥ 4 years) |
| Source: Mordor Intelligence | |||
Certification Complexity and Audit Fatigue
Organic certification requires adherence to stringent documentation, inspection, and traceability standards. Smallholder farmers in Asia-Pacific and Africa often encounter financial and administrative challenges in meeting international certification criteria, which restricts the expansion of global supply. The distinct requirements of the United States National Organic Program, European Union Regulation 2018/848, and Japan Agricultural Standard compel exporters to manage overlapping documentation processes. While equivalency agreements facilitate trade between the United States and Europe, the absence of similar agreements with countries such as China, India, and Brazil limits cross-border trade flexibility.
Retailer Carbon-Footprint Caps on Long-Haul Perishables
Tesco and Carrefour now restrict air-freighted produce to under 5% of organic volume, pushing African and South American suppliers toward slower sea routes. Transit times extend to two to three weeks, heightening spoilage risk even with modified-atmosphere packaging. Producers unable to finance cold-chain upgrades face market-access erosion, particularly in berries and asparagus that have short post-harvest windows. Although organic production minimizes chemical inputs, the environmental benefits can be diminished by long-distance logistics. Retailers may prefer locally sourced conventional produce over imported organic options when carbon intensity is significant, affecting the organic fruit and vegetable market.
*Our forecasts treat driver/restraint impacts as directional, not additive. The impact forecasts reflect baseline growth, mix effects, and variable interactions.
Segment Analysis
By Fruits: Berries Capture High-Value Momentum
Bananas were the largest segment, led with 27.6% of the organic fruits and vegetables market share in 2025. Bananas continue to dominate overall fruit revenue, supported by established certification processes in tropical regions and consistent consumer demand for staple produce. Stable supply chains contribute to steady banana pricing, solidifying their position as a key volume driver in the organic fruits and vegetables market. Apples represent another significant sub-segment, utilizing controlled-atmosphere storage to minimize spoilage and extend sales periods. Citrus fruit consumption is increasing, driven by the demand for organic orange juice in North America and Europe. Supply is limited due to citrus greening disease, which significantly impacts organic groves that cannot use synthetic pesticides.
Berries are fastest fastest-growing segment, advancing at an 11.6% CAGR through 2031. The shift toward berries highlights a broader consumer focus on nutrient density rather than caloric value. That technology underpins food-service demand by preserving anthocyanins and extending shelf life, supporting steady penetration into institutional menus. Grapes highlight how regenerative farming practices can significantly boost farm-gate prices by linking soil health improvements to brand narratives. Kiwi, passion fruit, and dragon fruit remain niche products but benefit from superfood marketing, drawing health-conscious consumers and contributing to the expansion of the organic fruits and vegetables market in specialty retail outlets.



By Vegetables: Leafy Vegetables Lead Salad Kit Upswing
Tomatoes were the largest segment, accounting for 27.8% of the organic fruits and vegetables market size in 2025. This performance was supported by greenhouse production, which enables more efficient organic certification compared to traditional field systems. For instance, the company has continued to expand and emphasize its organic product lines, particularly focusing on Organic Hiiros Tomatoes and Organic Ombre Cherry Tomatoes. In 2024, the company received recognition for its organic products, including Organic Red Bell Peppers, which won the Chef’s Choice Award at the 17th Annual Leamington Greenhouse Competitions. This achievement enabled the company to supply major retailers with consistent, year-round organic volumes that field growers cannot provide.
Leafy vegetables are the fastest-growing segment, advancing at a 10.9% CAGR through 2031, the fastest among vegetable segments. This growth is primarily driven by the increasing popularity of fresh-cut salad kits, which reduce preparation time and minimize food waste, particularly for single-person households. Potatoes also held a significant share in 2025, driven by demand for organic French fries from food-service operators such as Chipotle. Despite this demand, growth in the potato segment remains limited due to a lack of differentiation at the point of sale.
Geography Analysis
North America were largest region held 34.20% of the organic fruits and vegetables market share in 2025, supported by subsidies from the United States Department of Agriculture and retailer initiatives to increase organic shelf space. In 2025, the United States accounted for a significant share of the North American market, with California, Washington, and Oregon representing significant share of domestic organic acreage. Production in these states faces challenges due to water scarcity and labor shortages. In Canada, growth is driven by greenhouse production in Ontario and British Columbia, which more readily achieves organic certification compared to field systems. Nature Fresh Farms plays a key role by supplying major retailers across North America.
Asia-Pacific exhibits fastest growing region, advancing at an 10.0% CAGR to 2031, marking the fastest growth rate globally. This growth is driven by rising incomes and urbanization, which are fostering the adoption of organic products in countries such as China, India, and Japan. In 2000, only 4,000 hectares of China’s arable land were certified as organic. By 2023, this figure had increased to 2.9 million hectares, according to Research Institute of Organic Agriculture (FiBL). In 2025, the Indian government is promoting organic farming through two initiatives, the Paramparagat Krishi Vikas Yojana (PKVY), implemented across all states, and the Mission Organic Value Chain Development for North Eastern Region (MOVCDNER), focused on northeastern states to produce organic fruit and vegetable.
Europe is projected to hold the largest regional share in 2025, as market saturation in Germany, France, and the United Kingdom drives competition toward prioritizing margins over volume. According to the International Federation of Organic Agriculture Movements, the total area of farmland under organic production, including fruits and vegetables, in the European Union increased to 18.1 million hectares in 2024, compared to 2023, the number of organic producers grew by 1%[3]Source: Helga Willer and Julia Lernoud, “The World of Organic Agriculture 2025 Statistical Yearbook,” ifoam.bio. The United Kingdom is experiencing growth post-Brexit, with domestic subsidies replacing European Union programs and retailers such as Tesco committing to expanding organic product assortments. Italy and Spain are concentrating on organic olive oil and wine, which yield higher premiums compared to fresh produce. Meanwhile, Austria continues to have the highest organic penetration of total agricultural land, driven by strong consumer demand and government incentives.

Regulatory Landscape
Organic fruits and vegetables trade and labeling continue to be governed by major frameworks such as the USDA National Organic Program (7 CFR Part 205) in the United States and Regulation (EU) 2018/848 in Europe, with compliance anchored on certified production practices, traceability, and accredited inspection. In February 2026, USDA AMS issued a Federal Register notice completing a 2026 sunset review and renewals affecting 56 substances on the National List of Allowed and Prohibited Substances, with changes taking effect July 26, 2026. In March 2026, USDA AMS also published a proposed rule to amend the National List, including provisions such as allowing carbon dioxide in organic crop production and other updates that influence input availability and operating procedures for certified supply chains.
In the European Union, policymakers moved through a targeted revision process to simplify and clarify organic rules under Regulation (EU) 2018/848. In May 2026, the Council of the European Union agreed on a negotiating position, and in July 2026 the European Parliament Agriculture Committee adopted a position. A key trade continuity issue is third-country equivalence recognition, which is currently set to expire on December 31, 2026 for multiple partners, driving legislative work to extend recognition and avoid disruption for imported organic produce. This process reinforces how exporters must manage overlapping requirements across jurisdictions, including US NOP, EU rules, and the Japan Agricultural Standard, which in turn affects documentation, audit planning, and route-to-market choices.
Value Chain Analysis
The value chain spans certified seed and organic input suppliers (biological crop protection, composts, and permitted post-harvest aids), farm production (open-field, protected cultivation, and hydroponic systems where certification pathways apply), aggregation and packing, cold chain storage, and distribution through retailers, food service, and online platforms. Because organic fresh produce is highly perishable and certification depends on segregation and traceability, packhouses and logistics providers play an outsized role in protecting certification integrity through dedicated handling lines, documentation, and residue-risk controls, particularly for high-loss categories such as berries and leafy vegetables.
Two bottlenecks continue to shape economics: certification complexity (audit fatigue and overlapping export documentation) and logistics constraints (temperature control and transit-time management). Retailer carbon-footprint policies also reduce air-freight options for long-haul perishables. The value chain is shifting toward stronger farmer-to-consumer linkages through organized aggregation and e-commerce partnerships. For example, in June 2026 National Cooperative Organics Limited (NCOL) signed an MoU with Amazon India to distribute Bharat Organics products, using pan-India logistics to widen market access for cooperative farmers. Efforts that help smallholders move from informal schemes to formal markets, such as KOAN and Enviu work on structured contract production in Kenya, further highlight the role of technical assistance and aggregation in improving consistency, compliance, and delivery performance.
Competitive Landscape
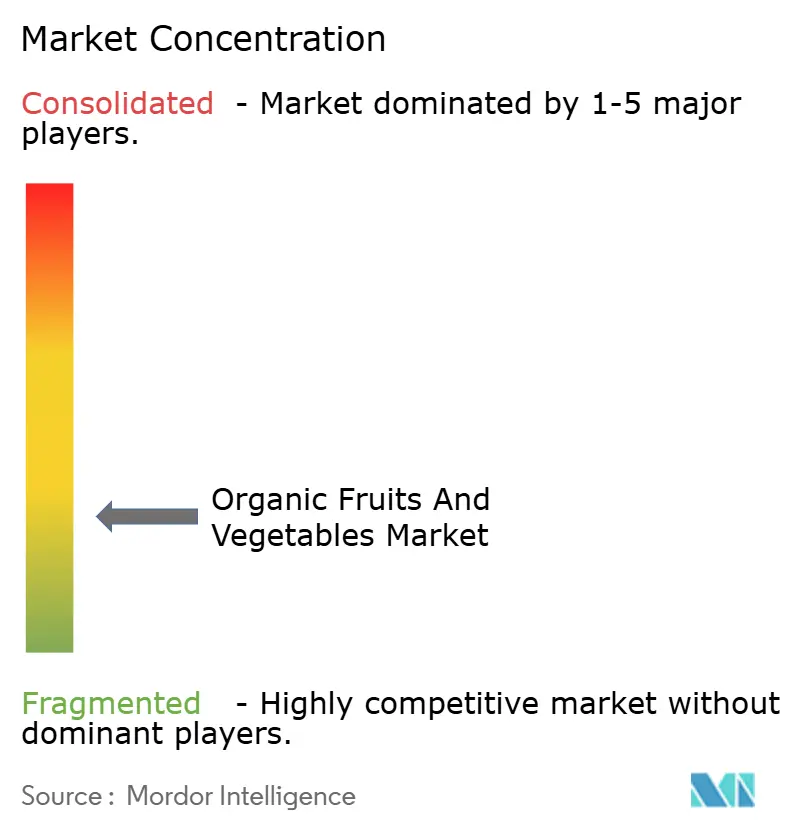
The organic fruits and vegetables market is fragmented, with key players including Dole plc, Fresh Del Monte Produce Inc., Driscoll’s Inc., Greenyard, and Calavo Growers Inc. The market's structure reflects low barriers to entry for regional growers and limited economies of scale due to the perishable nature of the supply chain. Dole plc holds a significant market share, supported by its vertically integrated banana and pineapple operations across Latin America and the Philippines. Fresh Del Monte Produce Inc. maintains a strong position through its diversified organic product portfolio, including avocados, melons, and pineapples.
Competitive strategies are increasingly focused on vertical integration, with major players acquiring upstream farms and downstream processing facilities to enhance margins and ensure consistent supply. The adoption of advanced technologies is also a key differentiator. For instance, companies like Nature Fresh Farms utilize hydroponic systems that achieve organic certification without the standard three-year transition period required for traditional field farms, enabling quicker scaling of supply.
Growth opportunities are emerging in underserved categories such as organic root vegetables and tropical fruits, where certification challenges and limited acreage restrict supply. Smaller players, such as Healthy Buddha in India, are disrupting the market with e-commerce-first models that bypass retail intermediaries, allowing them to capture higher margins. Additionally, regenerative-organic certification is creating a premium segment, offering significant price premiums over standard organic products.
Organic Fruits And Vegetables Industry Leaders
Dole plc
Fresh Del Monte Produce Inc.
Driscoll’s Inc.
Greenyard
Calavo Growers Inc.
- *Disclaimer: Major Players sorted in no particular order

Market Opportunities and Future Outlook
Policy-led acreage conversion and administrative simplification remain central opportunity areas because they expand certified supply and improve smallholder participation. The European Union continues to run major support mechanisms through the Common Agricultural Policy eco-schemes aligned with the European Green Deal target of 25% organic farmland by 2030, and the OrganicTargets4EU project (concluding in 2026) published a roadmap for scaling organic production and demand within that policy framework. Alongside conversion incentives, rulebook updates underway in 2026 (EU negotiations to revise Regulation (EU) 2018/848 and US National List updates) create a clear space for solution providers in audit tooling, digital traceability, and compliant post-harvest and cold-chain handling that can lower spoilage and reduce certification friction across export lanes.
Investment in value-added processing and year-round, controlled-environment supply also offers a way to improve margins and reduce waste from perishability. In July 2026, Edible Garden AG Incorporated advanced plans for a 400,000-square-foot manufacturing hub in Webster City, Iowa, aimed at processing shelf-stable, organic, and plant-based nutritional beverages, reflecting continued interest in downstream capacity that can absorb organic inputs and stabilize returns beyond fresh-only channels. Retailer initiatives that broaden access and e-commerce programs that formalize aggregation, including India-focused procurement and distribution partnerships, support opportunities in standardized grading, multi-origin sourcing, and packaging formats that protect shelf life while meeting retailer carbon and residue expectations.
Recent Industry Developments
- April 2026: Driscoll's announced organizational changes including naming Wyard Stomp as Chief Operating Officer and expanding Shaily Sanghvi's responsibilities to lead global strategy. The move supports Driscoll's effort to scale its flavor-first model across markets, which is tied to varietal development, consistent quality, and supply-chain execution for berries.
- March 2026: Fresh Del Monte Produce completed the acquisition of the Prepared and Packaged business from Del Monte Foods Corporation II Inc. for USD 285 million. The deal expands Fresh Del Monte's footprint in value-added and packaged offerings, strengthening downstream capabilities that can complement fresh and organic produce programs through improved merchandising, convenience formats, and utilization of raw material.
- May 2024: Almaverde Bio introduced the Elodi strawberry variety grown exclusively in Romagna, developed through research collaboration between the Newplant Group and CREA in Forli. The launch underscores ongoing varietal innovation in organic berries, a segment where shelf-life, flavor, and supply consistency influence retailer acceptance and pricing power.


Research Methodology Framework and Report Scope
Market Definition and Coverage
This market covers the value of organically produced fruits and vegetables sold through commercial channels worldwide, where organic refers to produce grown under recognized organic standards. Our sizing focuses on the traded market value in USD across major producing and consuming regions.
Scope exclusions: Values do not count conventional produce sales, and informal home-grown consumption is not treated as a marketed revenue stream.
Segmentation Overview
- By Fruits
- Banana
- Apple
- Berries
- Grapes
- Kiwi
- Other Fruits(Passion Fruit, Dragon Fruit, etc.)
- By Vegetables
- Leafy Vegetables
- Tomato
- Potato
- Other Vegetables (Asparagus, Sweet Corn, etc.)
- By Geography
- North America
- United States
- Canada
- Mexico
- Rest of North America
- South America
- Brazil
- Argentina
- Rest of South America
- Europe
- Germany
- France
- United Kingdom
- Italy
- Austria
- Spain
- Belgium
- Rest of Europe
- Asia-Pacific
- India
- China
- Japan
- Australia
- Rest of Asia-pacific
- Middle East
- Saudi Arabia
- United Arab Emirates
- Rest of Middle East
- Africa
- South Africa
- Egypt
- Rest of Africa
- North America
Data Sources, Market Sizing, and Validation
Desk Research
Desk research was used to set the factual base for the model, especially on organic area under cultivation, production volumes, and trade flows for fruits and vegetables. We relied on public sources such as FAOSTAT, the USDA Economic Research Service, Eurostat, and national agriculture ministries to understand supply trends, seasonality, and yield patterns that shift the market year to year.
We also review information from organic and retail focused bodies such as IFOAM Organics International and country-level organic certification authorities, along with company annual reports, investor presentations, and reputable press coverage on pricing, retail expansion, and supply constraints. For cross-checking company footprints and product portfolios, we referenced paid subscriptions that provide company financials and intelligence, plus patent databases to track activity related to organic inputs and post-harvest handling. This list is illustrative, and other public sources were also used for data collection, validation, and clarification.
Primary Interviews and Surveys
Primary work was used to stress-test pricing ladders, organic premium ranges, and how certification and availability constraints affect volumes across regions. We spoke with growers, distributors, retailers, certifiers, and category managers to adjust desk-based assumptions to real buying and selling patterns, and then validated the approach again across APAC, EMEA, and the Americas.
Distribution of primary research fieldwork respondents
| Company type | Respondent position | Region |
|---|---|---|
| Top tier: 36% | CXOs: 17% | APAC: 51% |
| Mid tier: 44% | Functional/Unit leaders: 31% | EMEA: 30% |
| Smaller Players: 20% | Managers: 52% | Americas: 19% |
Market-Sizing & Forecasting
Sizing starts with a top-down build where production, organic cultivation indicators, and trade data are used to reconstruct the addressable organic produce pool by region, then converted into value using region-specific price bands. Because organic is priced differently than conventional produce, the model applies organic premium ranges and adjusts for channel mix, since modern retail and specialty outlets generally carry different markups.
To keep totals realistic, we corroborate results with selective bottom-up approximations, including sampled supplier and retailer revenue checks, channel checks for typical price points, and volume-to-value conversions for key crops where reliable production series exist. When direct signals are weak for a smaller country, we handle gaps through proxying using nearby market pricing, organic area share trends, and import dependence, and then review these adjustments through interview feedback.
For forecasting, scenario analysis is the main technique so demand shifts can be reflected under different adoption and price environments, with the trajectories anchored to expert views gathered in interviews. Key forward inputs include organic farmland expansion rates, certification uptake and compliance costs, retail shelf space and online penetration for fresh produce, freight and cold-chain constraints that affect delivered prices, and the spread between organic and conventional prices that drives consumer switching.
Data Validation & Update Cycle
Validation is done through multiple passes, where model outputs are compared with independent signals such as organic acreage trends, import-export movements for produce categories, and reported organic sales momentum from retailers and producer groups. Large variances trigger a deeper check of the underlying drivers, including price assumptions, currency timing, and whether a supply shock or weather-driven yield change has been double counted.
Before sign-off, the work is reviewed by another analyst so calculations and logic are checked step by step, followed by re-contacting selected interviewees when a sensitive assumption changes. Reports are refreshed annually, and interim updates are made when material events occur, such as major certification rule changes or sharp price inflation in produce. Right before delivery, a final pass is run so clients receive the latest updated view.
Mordor Intelligence's Global Organic Fruits and Vegetables Market Size Versus Other Published Estimates
Published market values for organic fruits and vegetables can differ even when the topic name looks the same, because each publisher makes different choices on what counts as organic, what forms are included, and which year is treated as the starting point. Differences also show up when some estimates lean more on forward assumptions than on observed production and pricing signals.
The main gap drivers usually come from scope and conversion logic, including whether frozen and processed formats are counted, how the organic price premium is applied across regions, and how currency conversion is timed in volatile periods. Update cadence matters as well, since organic produce pricing can move quickly with weather disruptions, freight rates, and retailer promotions, which then affects value sizing if the model is not refreshed.
Benchmark comparison
| Source | Market Size | Gaps in Research Methodology |
|---|---|---|
| Mordor Intelligence | USD 78.8 B (2025) | |
| Global Consultancy A | USD 68.36 B (2025) | Uses a narrower pricing build that appears to apply more conservative organic premium assumptions across retail channels, which can pull down value even if volumes are similar. |
| Industry Publisher B | USD 86.18 B (2024) | Anchors the base year earlier and explicitly includes fresh and frozen forms, and the value can shift depending on how frozen shares and average prices are treated in high inflation years. |
The benchmark table shows a spread that mainly comes from year choice and what product forms are counted, and in Mordor Intelligence's model the 2025 total is tied to a produce-only definition with value built from region-level organic price bands and channel mix checks rather than assuming a single global premium. In practical use, this makes the estimate easier to reconcile with observable supply and pricing signals, and it can be repeated when new crop, trade, and pricing inputs get released.


Key Questions Answered in the Report
How large will global demand for organic fruits and vegetables be by 2031?
The organic fruits and vegetables market size was valued at USD 78.8 billion in 2025 and estimated to grow from USD 89.5 billion in 2026 to reach USD 138.9 billion by 2031, at a CAGR of 9.20% during the forecast period (2026-2031).
Which fruit group is growing the fastest in certified-organic formats?
Berries are the front-runner, advancing at an 11.6% CAGR through 2031, as IQF technology boosts year-round food-service and retail demand.
Which region offers the highest growth potential for suppliers?
Asia-Pacific leads with a projected 10.0% CAGR through 2031, driven by China's Green Food scheme and Indias cluster programs that widen consumer access.
How concentrated is competition among major brands?
The top five companies hold significant share of global revenue, reflecting a fragmented field where regional specialists can still obtain shelf space and negotiate directly with retailers.
Page last updated on:






