Papaya Market Size and Share
Papaya Market Analysis by Mordor Intelligence
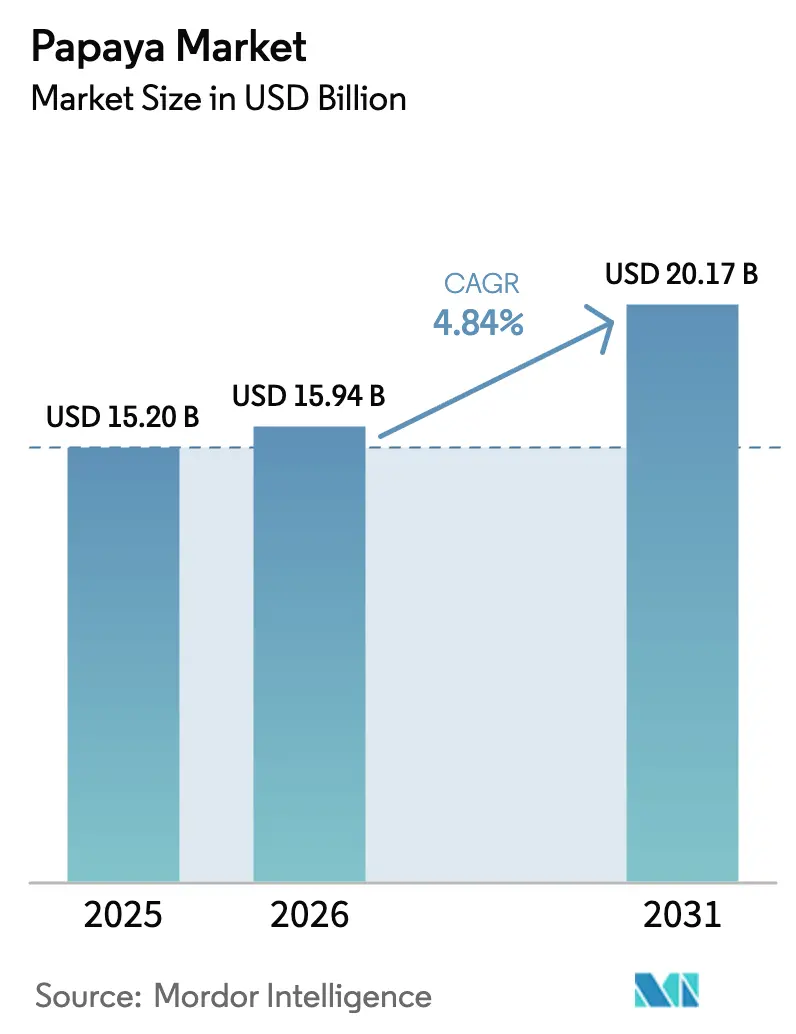
Papaya market size in 2026 is estimated at USD 15.94 billion, growing from 2025 value of USD 15.2 billion with 2031 projections showing USD 20.17 billion, growing at 4.84% CAGR over 2026-2031. The market growth is driven by increasing applications in food processing, nutraceuticals, and personal care products, which utilize papaya's nutritional content and enzymatic properties. Growing consumer awareness of the fruit's digestive health benefits and antioxidant properties has increased demand in premium retail segments. Biotechnology developments, particularly disease-resistant varieties, have improved crop yields and enabled production expansion into new regions. The inclusion of papayas in online grocery platforms alongside conventional fruits indicates wider market penetration and improved cold chain infrastructure. The implementation of water-efficient irrigation systems and the utilization of processing waste products have enhanced sustainability practices, appealing to environmentally conscious consumers.
Key Report Takeaways
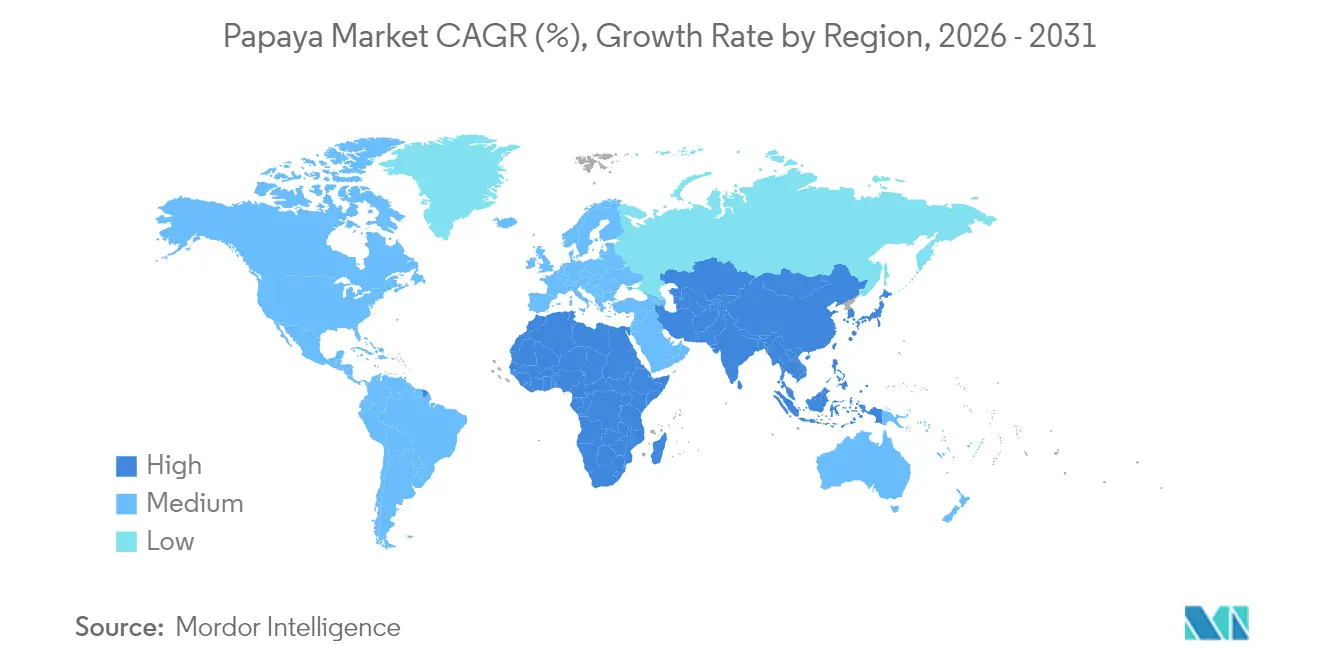
- By geography, Asia-Pacific dominated the papaya market with a 59.30% share in 2025 and is projected to grow at a CAGR of 4.88% during 2026-2031.
Note: Market size and forecast figures in this report are generated using Mordor Intelligence’s proprietary estimation framework, updated with the latest available data and insights as of 2026.
Global Papaya Market Trends and Insights
Drivers Impact Analysis*
| Driver | (~) % Impact on CAGR Forecast | Geographic Relevance | Impact Timeline |
|---|---|---|---|
| Rising global demand for nutrient-rich tropical fruits | +1.8% | Global (notably North America and Europe) | Medium term (2-4 years) |
| Expanding use of papaya derivatives in food and beverage processing | +1.2% | Global, concentrated in Asia-Pacific and North America | Medium term (2-4 years) |
| Expansion of e-commerce and online grocery | +0.9% | Global, higher in developed markets | Short term (≤ 2 years) |
| Technological adoption in papaya cultivation | +0.7% | Asia-Pacific and North America with spill-over to South America | Medium term (2-4 years) |
| Commercialization of disease-resistant cultivars | +1.1% | Global, highest in Asia-Pacific and North America | Long term (≥ 4 years) |
| Rise in sustainability and organic trends | +0.6% | North America and Europe, growing in Asia-Pacific | Medium term (2-4 years) |
| Source: Mordor Intelligence | |||
Rising Global Demand for Nutrient-Rich Tropical Fruits
The growing preference for healthier eating habits has expanded the papaya market beyond traditional consuming regions. Young consumers report increased fresh produce consumption, leading to higher papaya imports in North America. According to the ITC Trade Map, the United States imported 223.7 metric tons of fresh papaya valued at USD 163.64 million in 2024. Health trends also influence consumption patterns, as consumers using GLP-1 therapies seek digestive-friendly fruits like papaya. Advanced ripening technologies enable faster delivery of ready-to-eat papayas, encouraging spontaneous purchases. These factors have transformed papaya from an exotic fruit to a regular purchase among health-conscious consumers.
Expanding Use of Papaya Derivatives in Food and Beverage Processing
Papain extraction generates additional revenue streams beyond fresh fruit sales. The enzyme finds applications in meat tenderizing, beer clarification, wound-healing products, and cancer research. Processing facilities convert 15-20% of fruit waste into fibers for bioplastic production, supporting circular economy practices. The utilization of latex and peel components helps stabilize the papaya market against fresh produce price fluctuations and encourages partnerships between agricultural producers and specialty ingredient manufacturers.
Expansion of E-commerce and Online Grocery
The growth of digital grocery platforms, accelerated by changes in shopping behavior during the pandemic, created new distribution channels for the papaya market. Producers who sell through online platforms achieve higher profit margins while accessing consumers in cities beyond traditional distribution networks. European online retailers require premium packaging and temperature-controlled supply chains to maintain fruit quality during delivery periods of up to two days. In Indonesia, digital platforms enable small-scale farmers to sell directly to consumers, increasing their earnings and stabilizing domestic supply.
Technological Adoption in Papaya Cultivation
Precision agriculture is transforming orchard operations through advanced technology. IoT sensors activate drip irrigation systems using real-time soil moisture measurements, increasing water efficiency and reducing operational costs. Research demonstrates that automated systems enhance crop yields while addressing water scarcity issues that affect tropical fruit production. Digital traceability systems, including blockchain technology, improve food safety documentation, which is essential for accessing premium retail markets in North America and Europe.
Restraints Impact Analysis*
| Restraint | (~) % Impact on CAGR Forecast | Geographic Relevance | Impact Timeline |
|---|---|---|---|
| Climate extremes impacting papaya production | -1.1% | Global, heaviest in tropical and subtropical regions | Long term (≥ 4 years) |
| Stringent pesticide-residue and full-traceability rules causing export rejections | -0.6% | Global, with higher risk for export-oriented growers | Medium term (2-4 years) |
| Chronic labor shortages and wage inflation in key producing belts | -0.8% | Asia-Pacific, North America, with spillovers elsewhere | Short term (≤ 2 years) |
| Land-use shift toward higher-margin crops | -0.4% | Global, stronger in developed agricultural regions | Long term (≥ 4 years) |
| Source: Mordor Intelligence | |||
Climate Extremes Impacting Papaya Production
Rising temperatures and irregular rainfall patterns are altering cultivation practices, requiring producers to relocate to higher altitudes and implement shade nets, windbreaks, and precision irrigation systems. Mexico's papaya exports declined by 4% to 190,000 metric tons in 2023, illustrating the impact of storms and droughts on supply chains. The crop's vulnerability to water stress necessitates growers to optimize yield and fruit quality, as moderate stress levels can enhance beneficial phytochemicals. Climate adaptation measures increase production costs and may modify the geographic distribution of commercial orchards, impacting long-term expansion strategies. Insurance premiums and financing expenses are escalating in regions currently designated as high-risk for extreme weather events. These factors restrict fresh-fruit availability and limit global export growth.
Stringent Pesticide-Residue and Full-Traceability Rules Causing Export Rejections
The European Union's Corporate Sustainability Due Diligence Directive requires buyers to conduct farm-level practice audits, while importing regions strengthen their food safety monitoring. The Texas International Produce Association's Fresh Papaya Addendum, which follows Global Food Safety Initiative protocols, requires suppliers to maintain detailed documentation of field operations and input records. Shipment rejections due to non-compliance affect revenue and reputation, particularly impacting smallholder farmers without access to advanced testing facilities. Meeting compliance standards requires significant investments in residue testing laboratories, blockchain traceability systems, and food safety personnel, increasing operational expenses. Farmers face technical difficulties in pest management while adhering to residue limits, particularly in regions with restricted agrochemical options, as highlighted in Australia's 2025 SARP strategy for minor crops. The increased risk of shipment rejection discourages new investments in orchard development.
*Our forecasts treat driver/restraint impacts as directional, not additive. The impact forecasts reflect baseline growth, mix effects, and variable interactions.
Geography Analysis
Asia-Pacific accounts for 59.30% of the global papaya market in 2025, with a projected CAGR of 4.88% through 2031. India maintains its position as the leading producer, contributing 5.3 million metric tons in 2023. The country strengthens its market position through the development of PRSV-tolerant genetic lines. Research conducted at Tamil Nadu Agricultural University has demonstrated a 22.49% reduction in PRSV infection through nutrient-based disease management trials. The region's market leadership stems from favorable climatic conditions, implementation of disease-resistant cultivars, and digital farm management systems. Indonesia ranks as the third-largest producer globally, with 1.2 million metric tons in 2023, benefiting from IoT irrigation trials that optimize resource efficiency.
North America operates primarily as a consumption market rather than a production region. ITC Trade Map data indicates Mexico exported 199,571 metric tons of papaya to the United States in 2024. Mexico's domestic production specializes in premium varieties, particularly the Rainbow cultivar, demonstrating effective virus mitigation protocols.
South America maintains a significant market presence through Brazil's production of 1.1 million metric tons of papaya in 2023, emphasizing export quality standards. Chile contributes through its native papaya variety (Vasconcellea pubescens), cultivated in the Coquimbo and Valparaíso valleys, recognized for its distinct phytochemical properties.


Recent Industry Developments
- March 2025: Odisha's Saptasajya Agro Producer Company exported 1 metric ton of green papaya to London, marking the first such shipment from the state to the UK. The export initiative received support from Odisha's Department of Agriculture and Farmers' Empowerment, Agricultural and Processed Food Products Export Development Authority (APEDA), and Palladium Consulting India.
- December 2024: The Texas International Produce Association partnered with ProExport Papaya to develop the "Food Safety Best Practices Guide for the Growing and Handling of Mexican Papaya." This guide established comprehensive safety protocols that helped prevent food safety incidents related to papaya imports.
- December 2024: CapGen Seeds hosted seminars in the Canary Islands to advance Spanish papaya cultivation.
- August 2024: The Indian government has established the unit cost for papaya cultivation at USD 717.8 (Rs 60,000) per hectare under the Integrated Horticulture Development Mission Scheme in Bihar.


Research Methodology Framework and Report Scope
Market Definitions and Key Coverage
Our study defines the global papaya market as the value of fresh Carica papaya fruit produced, traded, and consumed worldwide across farm-gate, wholesale, and retail channels. Processed derivatives such as dried slices, powders, puree, papain, and seed products are examined only as demand indicators and are not included in the core market value.
Scope exclusion: the sizing deliberately omits revenues from papaya-based nutraceuticals, cosmetics, and industrial enzymes to avoid double counting.
Segmentation Overview
- By Geography ((Production Analysis (Volume), Consumption Analysis (Value and Volume), Import Analysis (Value and Volume), Export Analysis (Value and Volume), and Price Trend Analysis (Wholesale Price))
- North America
- United States
- Canada
- Mexico
- Dominican Republic
- Europe
- Spain
- Italy
- Netherlands
- Germany
- France
- United Kingdom
- Portugal
- Asia-Pacific
- China
- India
- Vietnam
- Thailand
- Indonesia
- Philippines
- Indonesia
- South America
- Brazil
- Argentina
- Colombia
- Peru
- Middle East
- Saudi Arabia
- United Arab Emirates
- Qatar
- Africa
- South Africa
- Nigeria
- Kenya
- North America
Detailed Research Methodology and Data Validation
Primary Research
Mordor analysts interviewed growers in India, Mexico, and Brazil, importers in the United States and the EU, and distributors across Southeast Asia. Dialogues clarified farm-gate pricing swings, cultivar mix shifts, and retailer mark-ups, while structured interviews and surveys with dieticians and juice formulators validated evolving consumption triggers.
Desk Research
We began with agriculture yearbooks, FAOSTAT crop balances, and UN Comtrade shipment data, then layered in price curves issued by USDA-AMS, Brazil's Abrafrutas, and India's Ag-Market databases. Trade-body white papers from the International Tropical Fruits Network and peer-reviewed journals on post-harvest losses supplied supply-chain loss coefficients. Financial cues came from company 10-Ks and D&B Hoovers screens tracking grower margins. Paid feeds, Dow Jones Factiva for deal flow and Volza for container-level export tags, helped cross-check volumes. The sources above are illustrative; many additional open files were consulted for corroboration.
Market-Sizing & Forecasting
Our top-down build reconstructs global availability from production plus imports minus exports and post-harvest losses, which is then valued using weighted wholesale prices. Select bottom-up checks, sampled pack-house throughput and average selling price times volume in four leading states, anchor the totals. Key variables tracked include hectare yields, loss rates from fruit fly infestations, average FOB prices out of Veracruz, per-capita fresh fruit intake, and e-grocery penetration that influences retail mark-ups. Forecasts to 2030 deploy multivariate regression, tying future value to expected acreage, yield technology adoption, real income growth, and historical price elasticity observed in panel data. Where bottom-up samples under- or overshoot by more than three percent, the gap is proportionally distributed across regions before sign-off.
Data Validation & Update Cycle
Outputs undergo variance checks against independent shipment logs, economist peer review, and a senior analyst audit. We refresh every twelve months, with mid-cycle edits triggered by weather shocks or regulatory changes; clients therefore receive the latest reconciled view each time a report is downloaded.
Why Mordor's Papaya Baseline Earns Investor Confidence
Published figures differ because firms pick dissimilar scopes, price anchors, and refresh cadences.
Key gap drivers include whether dried and derivative forms are folded in, the depth of farm-level interviews, currency conversion timing, and how loss factors are applied.
Benchmark comparison
| Market Size | Anonymized source | Primary gap driver |
|---|---|---|
| USD 15.20 B (2025) | Mordor Intelligence | - |
| USD 14.58 B (2025) | Global Consultancy A | Excludes informal trade and relies on biennial updates |
| USD 9.40 B (2024) | Industry Analyst B | Uses historical supply only, static FX rates, minimal primary validation |
The comparison shows that once hidden losses, gray-channel flows, and price dispersion are adjusted, as Mordor's mixed-method model does, the resulting baseline stands both transparent and reproducible, giving planners a dependable yardstick.


Key Questions Answered in the Report
What is the current size of the papaya market and how fast is it growing?
The global papaya market was valued at USD 15.94 billion in 2026 and is projected to expand at a 4.84% CAGR to reach USD 20.17 billion by 2031.
Which region commands the largest share of global papaya production?
Asia-Pacific holds 59.30% of global output, led by India’s 5.3 million metric tons harvest and strong adoption of disease-resistant cultivars.
Why are disease-resistant papaya cultivars important for producers?
Varieties such as ‘SunUp’, ‘Rainbow’, and new PRSV-tolerant lines cut virus-related losses and are estimated to deliver USD 70 million in cumulative benefits over 16 years.
How are online grocery channels influencing papaya distribution?
E-commerce platforms allow growers to reach distant consumers, lifting farm-gate margins and driving demand for improved packaging and cold-chain logistics.
What role does papain play in expanding revenue streams?
The enzyme extracted from papaya latex is used in meat tenderising, beer clarification, pharmaceuticals, and cosmetics, giving producers higher-margin diversification beyond fresh fruit.
What are the main challenges limiting further market growth?
Pest outbreaks, high post-harvest spoilage, water-use regulations, and price volatility remain key constraints despite ongoing advances in irrigation, storage, and supply-chain traceability.
Page last updated on:


