
Market Overview
| Study Period | 2020 - 2031 |
|---|---|
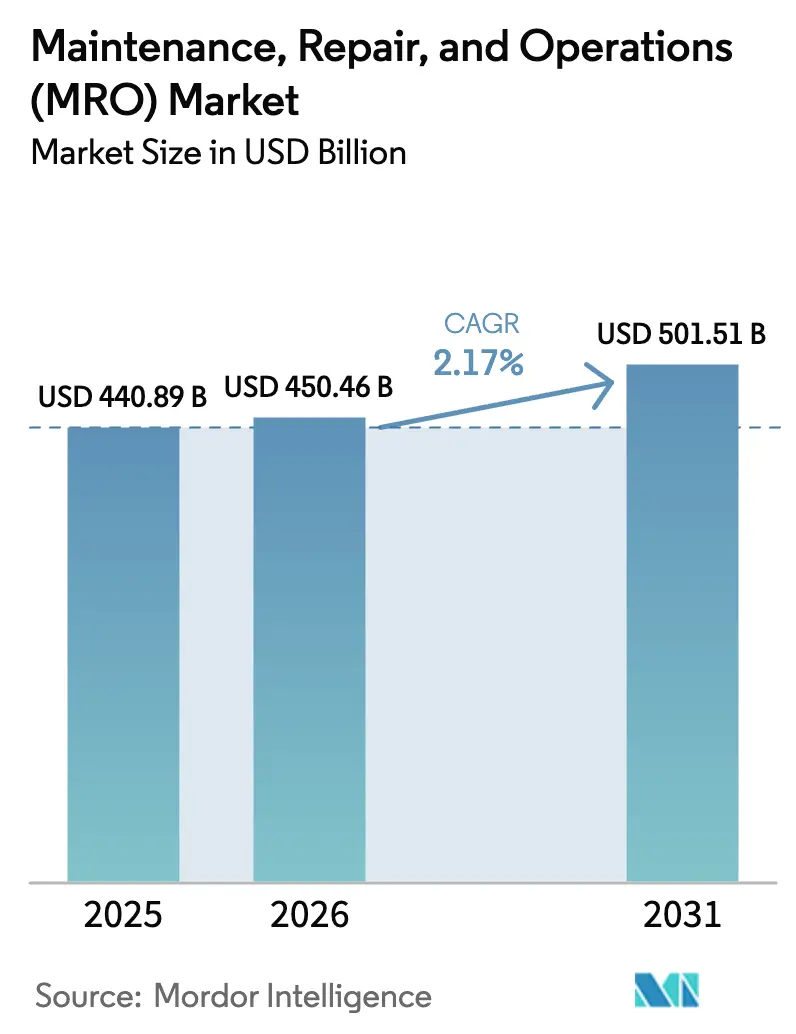
| Market Size (2026) | USD 450.46 Billion |
| Market Size (2031) | USD 501.51 Billion |
| Growth Rate (2026 - 2031) | 2.17 % |
| Fastest Growing Market | Asia Pacific |
| Largest Market | North America |
| Market Concentration | Medium |
Major Players *Disclaimer: Major Players sorted in no particular order Image © Mordor Intelligence. Reuse requires attribution under CC BY 4.0. | |
Maintenance, Repair, And Operations (MRO) Market Analysis by Mordor Intelligence
The Maintenance, Repair, And Operations Market size is projected to be USD 440.89 billion in 2025, USD 450.46 billion in 2026, and reach USD 501.51 billion by 2031, growing at a CAGR of 2.17% from 2026 to 2031. The growth profile is modest because the sector is mature; however, digital work orders, condition-based monitoring, and digital procurement are steadily reshaping cost structures and service models. Industrial MRO held the largest revenue share in 2025, while the electrical category is expanding at the fastest rate as utilities and heavy-industry operators replace aging transformers and switchgear. End-user spending is focusing on predictive maintenance tools that reduce downtime and labor hours, while procurement teams are transitioning toward integrated supply contracts that shift inventory risk to distributors. At the same time, regional re-shoring programs in North America and Europe and accelerated capital spending on renewable energy in the Asia Pacific are creating new addressable volumes for distributors that can combine technical support with rapid fulfillment.
Key Report Takeaways
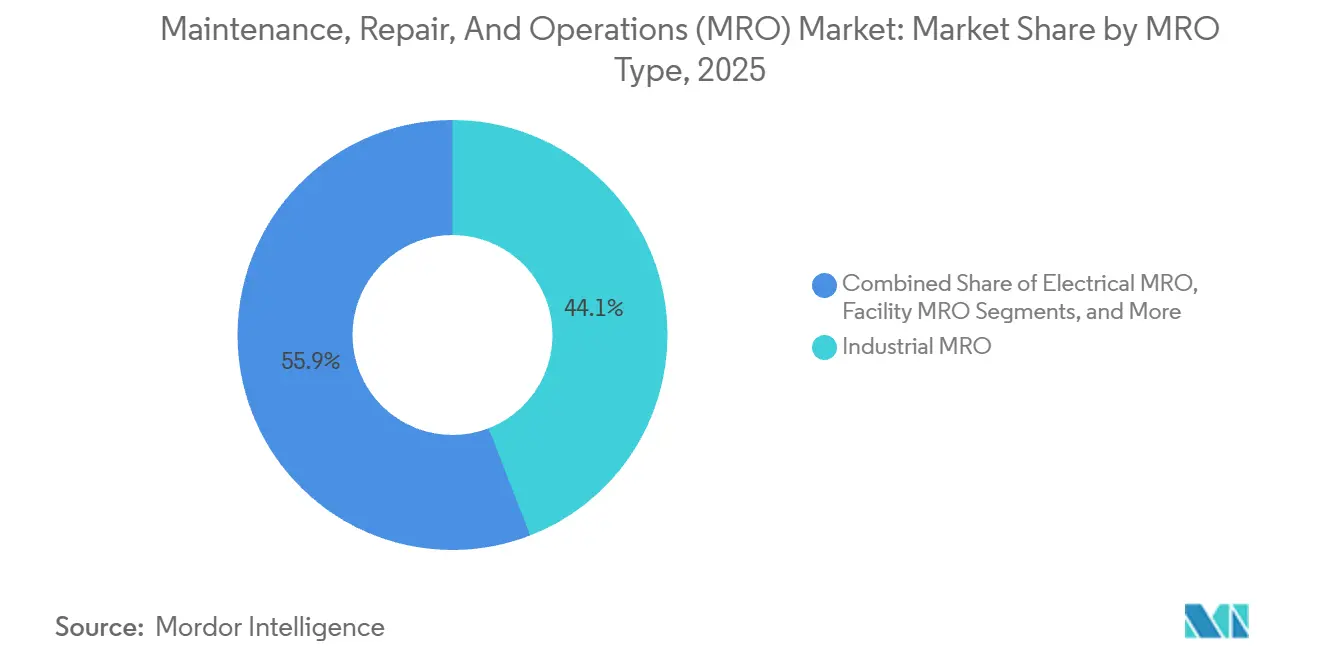
- By MRO type, industrial components led with 44.12% of the maintenance, repair, and operations market share in 2025, while electrical parts are forecast to expand at a 3.91% CAGR through 2031.
- By end-use, manufacturing accounted for 31.28% of revenue in 2025, whereas healthcare demand is advancing at a 4.73% CAGR to 2031.
- By sourcing model, in-house programs retained 57.48% share in 2025, yet integrated supply contracts are growing at a 3.12% CAGR.
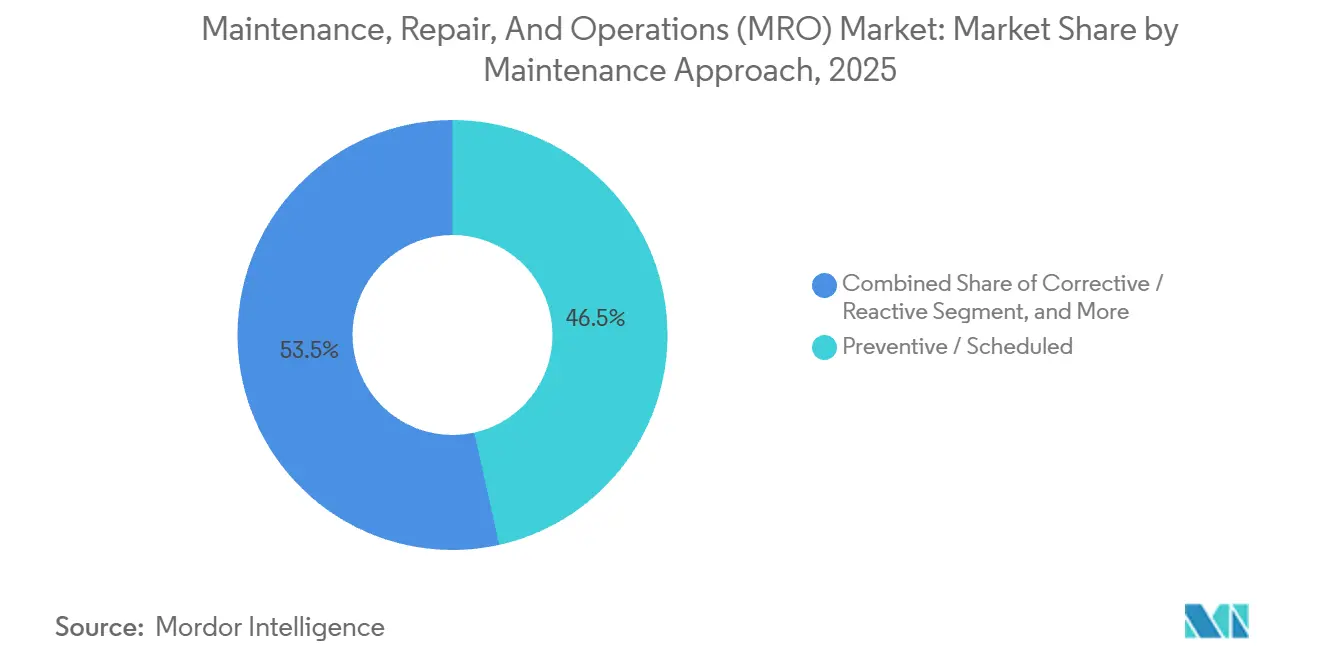
- By maintenance approach, preventive routines captured 46.51% share in 2025 and predictive strategies are rising at a 4.57% CAGR.
- By distribution channel, offline branches generated 62.12% of 2025 revenue, while online platforms are expanding at a 3.48% CAGR.
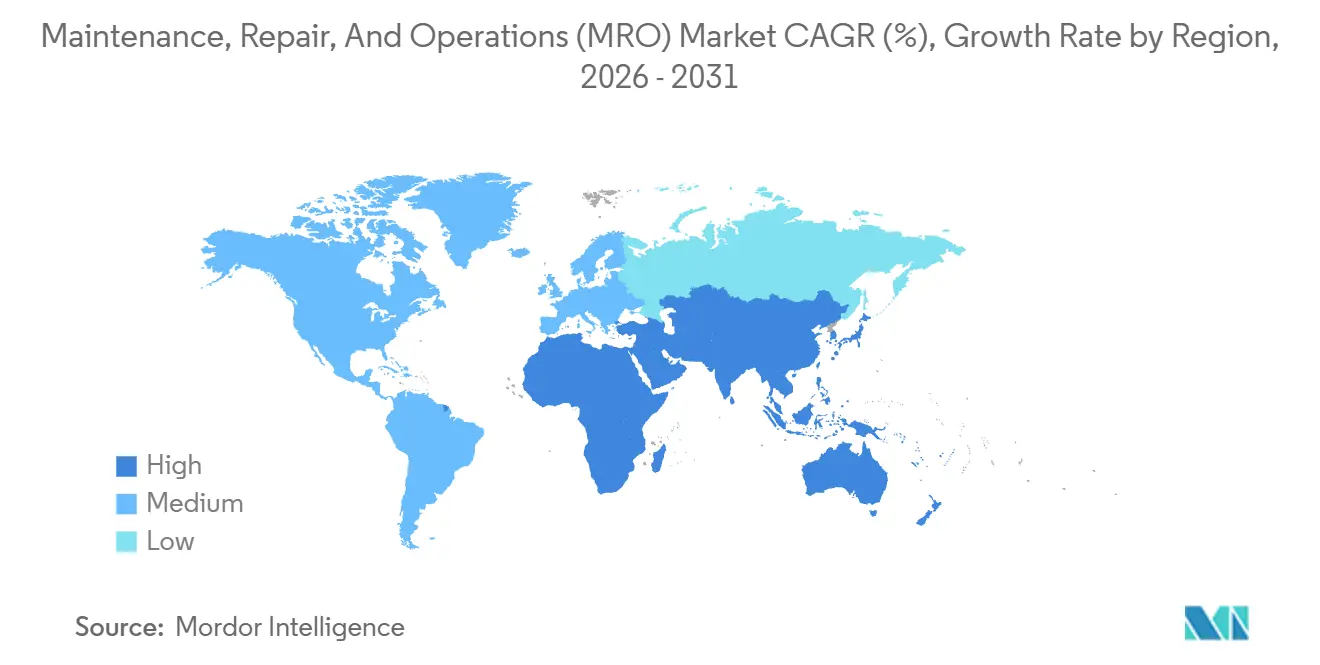
- By geography, North America held 34.86% of 2025 sales, but Asia Pacific is scaling at a 5.86% CAGR through 2031.
Note: Market size and forecast figures in this report are generated using Mordor Intelligence’s proprietary estimation framework, updated with the latest available data and insights as of January 2026.
Market Trends and Insights
Drivers Impact Analysis of Maintenance, Repair, And Operations (MRO) Market*
| Driver | (~) % Impact on CAGR Forecast | Geographic Relevance | Impact Timeline |
|---|---|---|---|
| Rising Adoption of Industry 4.0-Enabled Smart Factories | +0.6% | Global – strong in Germany, United States, Japan, South Korea | Medium term (2-4 years) |
| Supply-Chain Resiliency Programs Boosting MRO Stocking | +0.4% | North America and Europe, spillover to Asia Pacific | Short term (≤ 2 years) |
| Shift Toward Predictive Maintenance and IIoT Sensors | +0.5% | Global – early adoption in manufacturing and energy | Medium term (2-4 years) |
| E-Commerce Penetration in B2B MRO Distribution | +0.3% | North America, Western Europe, urban Asia Pacific | Short term (≤ 2 years) |
| Near-Shoring of Manufacturing in North America and Europe | +0.3% | United States, Mexico, Central Europe | Long term (≥ 4 years) |
| Surge in Energy-Efficiency Retrofits of Aging Facilities | +0.2% | North America and Europe, selective Middle East adoption | Medium term (2-4 years) |
| Source: Mordor Intelligence | |||


Rising Adoption of Industry 4.0-Enabled Smart Factories
Automated production lines now integrate sensors, edge gateways, and cloud analytics that trigger maintenance work orders without human intervention. A 2025 survey revealed that 62% of discrete manufacturers in North America and Europe have at least one predictive-maintenance deployment, with a median payback period of 14 months.[1]International Society of Automation, “Predictive Maintenance Adoption Survey,” ISA.ORG Automotive and semiconductor facilities view downtime as incurring an hourly cost of USD 500,000 to USD 2 million, resulting in a rising demand for vibration sensors, thermal cameras, and advanced analytics. Siemens reported 1.2 million connected assets on its MindSphere platform in 2025, cutting mean time to repair by 18% across user sites. These dynamics raise the technical requirements for distributors, who must provide integration support in addition to commodity parts. As sensor density climbs, the maintenance, repair, and operations market gains a steady tailwind from recurring replacement and calibration needs.
Supply-Chain Resiliency Programs Boosting MRO Stocking
Post-pandemic procurement strategies emphasize higher safety-stock levels and multisource contracts for critical spares. The Institute for Supply Management reported that 58% of North American manufacturers lifted on-site inventories by 20-40% in 2024. Distributors with vendor-managed inventory platforms consequently grew contract counts and average order values as clients shifted carrying costs off the balance sheet. W.W. Grainger’s KeepStock program expanded its customer base 12% in 2025, underscoring the linkage between resiliency mandates and service-based models. Local stocking and faster fulfillment also insulate plants from geopolitical shocks, reinforcing client preference for suppliers that blend branch density with digital forecasting tools.
Shift Toward Predictive Maintenance and IIoT Sensors
Field trials by the National Institute of Standards and Technology demonstrated that neural-network models predict bearing failures with 92% accuracy up to two weeks in advance. Energy utilities and process plants value this foresight because a single turbine trip can translate into multi-million-dollar penalties. General Electric stated that its Asset Performance Management software now oversees 400,000 industrial assets, extending average equipment life 11% and trimming spare-parts consumption 8%. The resulting virtuous cycle of more sensors, richer data, and sharper algorithms reinforces recurring demand for IIoT hardware and sensor-grade cabling, strengthening the growth outlook for the maintenance, repair, and operations market.
E-Commerce Penetration in B2B MRO Distribution
Online buying accelerates because procurement teams prefer real-time inventory visibility, parametric search, and one-click reordering. Amazon Business recorded a 22% year-over-year rise in MRO category sales to 6 million corporate customers in 2025. Fastenal’s digital channels crossed the 50% revenue threshold, with average ticket values 14% higher than branch sales thanks to cross-sell algorithms. Distributors are therefore investing in predictive search, API connectivity with enterprise resource planning systems, and next-day delivery logistics. This digital migration pressures branch-centric incumbents but unlocks growth for suppliers that combine e-commerce storefronts with technical field support.
Restraints Impact Analysis of Maintenance, Repair, And Operations (MRO) Market*
| Restraint | (~) % Impact on CAGR Forecast | Geographic Relevance | Impact Timeline |
|---|---|---|---|
| Persistent Skilled-Technician Shortages | -0.3% | Global – acute in North America and Western Europe | Long term (≥ 4 years) |
| Fragmented SKU Universe Inflating Inventory Costs | -0.2% | Global – burdensome for mid-sized distributors | Medium term (2-4 years) |
| Cyber-Security Risks in Connected Maintenance Systems | -0.1% | Global – concentrated in high OT-connectivity sectors | Short term (≤ 2 years) |
| Inflation-Driven Price Volatility of Industrial Inputs | -0.3% | Global – severe in commodity-intensive categories | Short term (≤ 2 years) |
| Source: Mordor Intelligence | |||
Persistent Skilled-Technician Shortages
The U.S. Bureau of Labor Statistics found that 28% of industrial maintenance workers were 55 years or older in 2025, while fewer than 12% were under 25.[2]U.S. Bureau of Labor Statistics, “Producer Price Index – Industrial Supplies,” BLS.GOV Median wages for technicians rose 8% year-over-year, outpacing broader pay trends and eroding maintenance budgets. Unfilled roles often force plants to defer preventive tasks, exposing them to expensive reactive repairs and making it harder to capitalize on predictive-maintenance platforms. Training pipelines for PLC, VFD, and IIoT competencies remain constrained, extending this restraint into the long-term horizon.
Inflation-Driven Price Volatility of Industrial Inputs
Steel, copper, and polymer resins registered Producer Price Index increases of 4.2% in 2024 and 3.1% in 2025, raising acquisition costs for bearings, motors, and electrical components. Copper averaged USD 9,200 per metric ton in 2025, up 11% from 2023. Volatile inputs squeeze distributor margins and complicate plant-level budgeting, often prompting fixed-price contracts that reduce flexibility when spot prices fall. Inventory exposure rises as well, because holding high-value spares during inflationary periods ties up more working capital.
*Our forecasts treat driver/restraint impacts as directional, not additive. The impact forecasts reflect baseline growth, mix effects, and variable interactions.
Maintenance, Repair, And Operations (MRO) Market Segment Analysis
By MRO Type:
Industrial Breadth, Electrical MomentumIndustrial components generated 44.12% of 2025 revenue, cementing their role as the backbone of the maintenance, repair, and operations market. Bearings, pumps, gearboxes, and hydraulics span every heavy-industrial vertical, so base-load demand remains sticky even during economic slowdowns. Aftermarket pump rebuilds and conveyor-chain replacements drove repeat sales, while localized supply agreements with mining and cement producers created high-margin service annuities. Distributors built specialized repair shops, enabling in-house machining and balancing that anchor customer relationships beyond simple parts sales. Meanwhile, electrical parts are growing at a 3.91% CAGR as grid operators and industrial campuses modernize their switchgear, transformers, and motor control centers. The U.S. Department of Energy noted that 70% of domestic power transformers were over 25 years old in 2024, thereby elevating the failure risk and triggering accelerated replacement cycles.[3]U.S. Department of Energy, “Transformer Age Profile,” ENERGY.GOV Renewable-energy integration further lifts demand for arc-flash-rated gear, inverter-grade cabling, and condition-monitoring relays.
Facility MRO filters, lighting, and janitorial supplies play an indispensable but slower-growing role, as spending can be postponed during downturns without jeopardizing production uptime. Safety and personal-protective equipment benefit from stricter occupational rules, including new National Emphasis Program guidelines that mandate heat-hazard mitigation plans. Distributors increasingly bundle multi-category kits, such as vibration-sensor packages paired with alignment tools and specialty lubricants, to lift basket size and minimize procurement complexity.


By End-Use Industry:
Manufacturing Dominates, Healthcare AcceleratesManufacturing absorbed 31.28% of 2025 consumption thanks to round-the-clock operations in automotive, food and beverage, and aerospace lines. Robotics additions and higher automation densities result in larger spare-part inventories for servomotors, vision systems, and robot gearboxes. Healthcare spending, however, is climbing at a 4.73% CAGR. Hospital expansions and outpatient surgery centers require new HVAC, filtration, and sterilization systems that comply with recent infection control standards. Aging facilities built before 2000 are retrofitting their air-handling units, incorporating HEPA filtration, and installing UV-C lighting, which raises recurring service intervals for filters and belts.
Energy and utilities purchasing remains steady as turbine overhauls and substation refurbishments are nondiscretionary. Aerospace and defense aftermarket demand is buoyant because military fleets are extending airframe life through heavy structural repairs, whereas commercial airlines are cycling older narrow-body aircraft through cabin refresh programs. Construction companies, riding infrastructure stimulus, rely on rapid turnaround for hydraulic-hose kits and cutting tools, which offline branches often assemble on site.
By Sourcing Model:
Integrated Supply Gains GroundIn-house storerooms controlled 57.48% of 2025 spend because many large plants value direct oversight of critical spares. Even so, integrated supply contracts are advancing at a 3.12% CAGR as finance teams seek inventory reduction and transactional efficiency. Under these agreements, distributors own the inventory, guarantee fill rates above 97%, and staff on-site personnel who manage crib access and automated dispensing. Average line-item counts shrink from tens of thousands to low thousands, cutting purchase-order volumes by as much as 80%.
Outsourced models appeal to mid-sized manufacturers aiming to reallocate buyer headcount to core production analysis. Adoption levels vary regionally, trending highest in North America and Western Europe, where service ecosystems are mature, and ISO 55000 asset-management standards are widely referenced.
By Maintenance Approach:
Predictive Methods AdvancePreventive schedules still dominate with 46.51% share, reflecting decades-old “calendar or meter” philosophies that emphasize simplicity. Yet predictive and condition-based routines are growing at 4.57% CAGR as sensor retrofits fall below USD 100 per channel, pushing return-on-investment periods under 18 months. Field data show maintenance labor hours drop nearly 20% when vibration and oil-analysis alerts replace fixed intervals, while spare-parts draws fall in tandem because components are changed only when trending out of tolerance.
Corrective approaches remain relevant for low-criticality assets, but emergency purchases often carry steep premiums, typically 20-30% above contract pricing. Failure mode and effects analysis, as outlined in IEC 60812, helps plants stratify asset criticality and justify sensor budgets.
By Distribution Channel:
Online Platforms ExpandBranch networks accounted for 62.12% of 2025 purchases, as machinists continue to value counter support and immediate pickup for break-fix situations. However, online channels are scaling at a 3.48% CAGR. MSC Industrial reported that digital orders accounted for 58% of revenue in 2025, with predictive-search tools helping to reduce maverick spend. Commodity categories, including fasteners, abrasives, and safety gear, are shifting fastest to e-commerce, where buyers can benchmark prices across thousands of SKUs in seconds.
Distributors counterbalance online competition by embedding vending machines and vendor-managed inventory lockers at client sites; Fastenal reached 108,000 active units in 2025. Original equipment manufacturers continue to serve captive markets that require proprietary parts and traceability, particularly in the aerospace and medical device industries.
Geography Analysis
North America Maintenance, Repair, and Operations (MRO) Market
North America held 34.86% of global revenue in 2025, anchored by a diversified industrial base, robust energy infrastructure, and branch density that offers same-day delivery to most plants. The CHIPS and Science Act plus the Inflation Reduction Act unleashed more than USD 420 billion in semiconductor and clean-energy investments, driving fresh demand for construction MRO during plant builds and electrical spares once production ramps up.[4]U.S. Department of Commerce, “CHIPS for America – Samsung Electronics,” COMMERCE.GOV Skilled-labor scarcity, however, is acute, forcing wage premiums and sparking investment in automation-supported maintenance tools.
Europe and Middle East Maintenance, Repair, and Operations (MRO) Market
Europe accounted for approximately 28% of 2025 spending, led by Germany, France, and the United Kingdom. The Corporate Sustainability Reporting Directive rules oblige firms to quantify their energy and Scope 1-3 emissions, prompting accelerated retrofits of motors, lighting, and HVAC systems. Sanctions after 2022 redirected supply routes away from Russia, increasing demand for localized inventories in Turkey and the Middle East. Eastern Europe, including Poland and Romania, is attracting new automotive and electronics plants, boosting regional MRO distributors.
APAC Maintenance, Repair, and Operations (MRO) Market
Asia Pacific is the fastest-growing cluster with a 5.86% CAGR. China’s Ministry of Industry and Information Technology logged 420,000 semiconductor-equipment installations in 2025, fueling purchases of ultrapure-water membranes, cleanroom filters, and chemical-delivery hoses. India’s USD 1.4 trillion National Infrastructure Pipeline keeps heavy machinery fleets running, and Southeast Asia benefits from electronics assembly migrating from higher-cost geographies. High automation adoption in Japan and South Korea sustains condition-monitoring markets, while Australia’s mining sector relies on heavy-duty hydraulic and power-transmission parts.
MEA and LATAM Maintenance, Repair, and Operations (MRO) Market
The Middle East and Africa remain smaller in absolute terms but deliver attractive margins due to limited local supply. Saudi Arabia’s Public Investment Fund budgeted USD 100 billion for industrial diversification, generating pull-through for process-pump and electrical-gear spares. South Africa’s underground mining creates steady demand for abrasion-resistant valves and conveyor rollers, whereas Kenya’s infrastructure backlog fuels rapid sales of concrete-batch-plant spares. Latin America’s volumes are modest but volatile, tied to commodity cycles and currency fluctuations; Brazilian distributors often hedge inventory with U.S.-dollar contracts to mitigate depreciation risk.

Regulatory Landscape
Compliance requirements in the maintenance, repair, and operations (MRO) ecosystem are shaped by safety, cybersecurity, and traceability obligations in regulated end users, including aerospace/defense, energy/utilities, and healthcare. Those obligations flow through distributor qualification, documentation, and approved-supplier rules. In Europe, the European Union Aviation Safety Agency (EASA) updated its Easy Access Rules for Continuing Airworthiness in June 2026, reflecting newer requirements linked to Regulation (EU) 2025/111 for electric and hybrid propulsion aircraft, which reinforces the need for controlled maintenance data and parts traceability across supply chains supporting aircraft operators.
Cybersecurity and trade policy are also constraining cross-border MRO flows. EASA Part-IS (Information Security) requirements introduced compliance deadlines for foreign Part-145 organizations, including a February 2026 compliance milestone referenced in EASA work instructions, pushing maintenance organizations and their digital toolchains toward formal security postholders and governance. In the United States, a July 2026 White House proclamation initiated negotiations around potential Section 232 actions on commercial aircraft, jet engines, and related parts, which raises the importance of tariff-exposure tracking and alternate sourcing strategies for categories tied to aviation MRO procurement.
Value Chain Analysis
The MRO value chain starts with OEMs and component manufacturers, including bearings, motors, switchgear, sensors, safety gear, and facility consumables, and then extends through master distributors, regional distributors, and e-commerce platforms that aggregate long-tail SKUs. Distributors increasingly sit at the center of the chain by combining inventory ownership, technical support, and fulfillment services through integrated supply and vendor-managed inventory programs. Branch networks remain important for break-fix responsiveness and kitting. End users include manufacturing, energy and utilities, aerospace and defense, construction, and healthcare, each bringing different requirements for traceability, certified parts, and service documentation.
Digital layers are changing how demand and supply are coordinated across the chain. Maintenance management systems and asset performance tools generate work orders and condition alerts that feed procurement, while distributors connect these signals to automated replenishment via vending/lockers, APIs, and digital catalogs. One example of this platform-driven integration is two-way connectivity between maintenance software and AI procurement platforms, including Swiss-AS AMOS with SkySelect, implemented by an MRO operator in 2025. As digital procurement grows, the chain places more weight on data quality, including part master accuracy, alternates, and compliance attributes, alongside last-mile logistics reliability and cybersecurity controls for connected maintenance environments.
Competitive Landscape
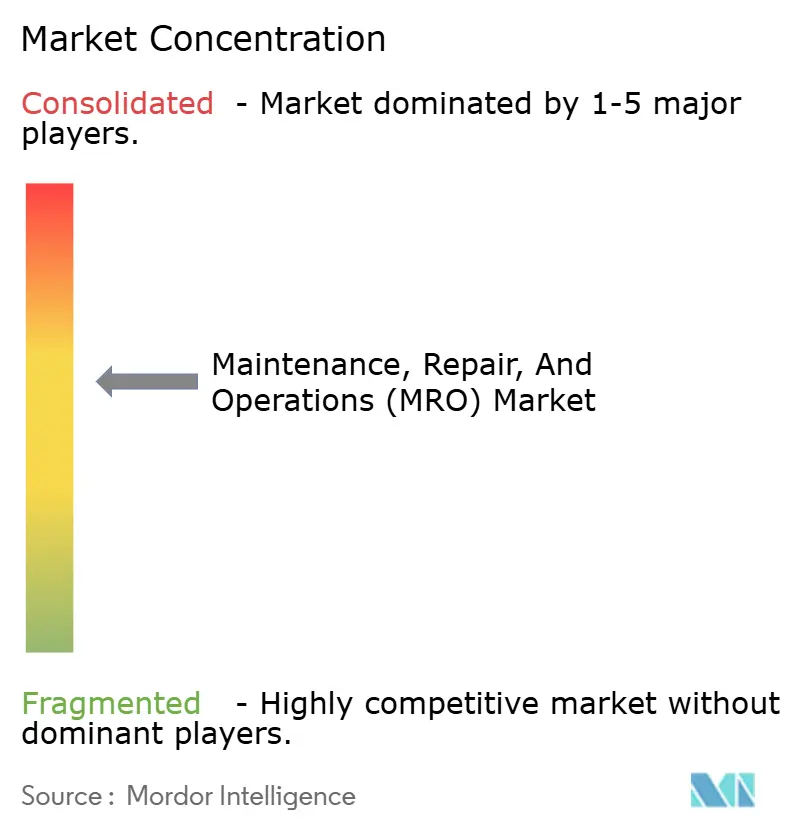
The maintenance, repair, and operations market remains moderately fragmented: the top five distributors, W.W. Grainger, Wurth Group, MSC Industrial, Motion Industries, and Fastenal, combined for roughly 25-30% of 2025 global revenue. Grainger operated 591 branches and stocked 1.7 million SKUs, offering next-day service to 95% of U.S. manufacturing sites. Wurth leverages a 33,000-person sales force that delivers bin replenishment and technical guidance onsite, a service premium that enhances retention. Fastenal’s vending-machine fleet generated USD 2.1 billion in sales in 2025 and provides granular usage data that feeds automated reordering algorithms.
Digital challengers, such as Amazon Business and VEVOR, capture commodity categories by combining transparent pricing with fast shipping, nudging incumbents to accelerate their web-store upgrades. MSC Industrial announced a USD 150 million warehouse automation plan that deploys autonomous mobile robots and AI-driven inventory software across 12 distribution centers, aiming to reduce order-to-ship cycle times by 30%. WESCO International integrated Anixter’s communications-cable portfolio, unlocking USD 250 million in annual synergies and cross-selling electrical gear to data-center builders.
Niche opportunities proliferate in regulated verticals. Pharmaceutical cleanrooms require ISO-class consumables, semiconductor fabs demand fluoropolymer fluid-handling parts, and offshore wind farms need corrosion-resistant fasteners. Distributors that pair application engineers with specialized inventory often command double-digit operating margins. Cybersecurity accreditation under IEC 62443 is emerging as a differentiator for suppliers serving critical-infrastructure utilities.
Maintenance, Repair, And Operations (MRO) Industry Leaders
W.W. Grainger Inc.
Würth Group
MSC Industrial Direct Co. Inc.
Motion Industries (Genuine Parts Co.)
RS Group plc (RS Components)
- *Disclaimer: Major Players sorted in no particular order
Maintenance, Repair, And Operations (MRO) Market Companies Covered in this Report
- W.W. Grainger Inc.
- Wurth Group
- MSC Industrial Direct Co. Inc.
- Motion Industries (Genuine Parts Co.)
- RS Group plc (RS Components)
- Fastenal Company
- HD Supply (Home Depot)
- Ferguson plc
- Sonepar SA
- WESCO International Inc.
- Airgas Inc. (Air Liquide)
- Applied Industrial Technologies
- Rubix Ltd.
- ERIKS N.V.
- Hayley Group Ltd.
- McMaster-Carr
- Amazon Business
- Rexel SA
- Cromwell Group (Industrial)
- Anixter (WESCO)
- VEVOR

Market Opportunities and Future Outlook
Opportunities concentrate where digital maintenance signals can be converted into repeatable procurement and service workflows. Predictive maintenance programs, condition-based monitoring, and connected asset platforms increase demand for sensor-grade cabling, vibration and thermal monitoring tools, and calibration and replacement cycles. They also favor distributors that can pair parts availability with integration support. The shift toward integrated supply contracts creates additional room for providers that can take inventory risk off end users, standardize SKU rationalization, and provide on-site management through vending, lockers, and crib staffing, particularly as manufacturers continue to prioritize higher safety-stock and multisource strategies.
A second opportunity area is digital procurement and asset-visibility programs that reduce downtime and manual buying. Enterprise rollouts of digital twin and automation practices in asset-intensive operations offer proof points for scaling data-driven maintenance and improving inventory accuracy. For example, Verizon standardized digital twin use across tens of thousands of cell sites with AI-based 3D modeling (vHive) to automate inspections and inventory management in 2026. In parallel, distributors and large accounts are investing in automation of order-to-ship and search-driven buying journeys, including MSC Industrials USD 150 million warehouse automation plan and Fastenal's large installed base of vending units, supporting expansion of online ordering, API connectivity to ERP/EAM systems, and analytics-led replenishment programs that reduce maverick spend and improve parts availability.
Recent Industry Developments in Maintenance, Repair, And Operations (MRO) Market
- March 2026: The Grainger Show in Orlando drew more than 10,000 attendees, highlighting digital procurement tools and AI-driven inventory management. The event showed how major distributors are packaging MRO supply with data and workflow enablement, aligning with customers' needs for fewer stockouts and faster maintenance responses.
- December 2025: In December 2025, Grainger completed its exit from the United Kingdom, including the divestiture of the Cromwell business and the closure of Zoro UK operations. Resources were redirected toward North American High-Touch Solutions and an Endless Assortment model, sharpening competitive focus and changing European dynamics for multi-country customers.
- July 2024: Fastenal expanded its on-site inventory solution deployments with additional vending and automated dispensing, improving point-of-use availability for customer operations. The build-out reinforced vending and data-capture as a core route to lock in integrated supply relationships and improve reorder accuracy across high-velocity MRO SKUs.


Maintenance, Repair, And Operations (MRO) Market Report Scope and Research Methodology
Market Definition and Coverage
This market is measured as the annual spending tied to keeping industrial assets and facilities running, covering replacement parts, consumables, tools, and outsourced maintenance work that supports uptime in day-to-day operations.
Scope exclusions: Major one-time capital purchases for setting up new production lines or greenfield plants are kept out when they are not part of ongoing maintenance and repair demand.
Segments Covered in This Report
- By MRO Type
- Industrial MRO
- Electrical MRO
- Facility MRO
- Other MRO Types
- By End-Use Industry
- Manufacturing
- Energy and Utilities
- Aerospace and Defense
- Construction
- Healthcare
- Other End-Use Industries
- By Sourcing Model
- In-House
- Outsourced (3rd-Party / IFM)
- Integrated Supply (VMI / Integrated-MRO)
- By Maintenance Approach
- Preventive / Scheduled
- Corrective / Reactive
- Predictive / Condition-Based
- By Distribution Channel
- Offline Distributors
- Online / E-Commerce
- Direct from OEM
- By Geography
- North America
- United States
- Canada
- Mexico
- South America
- Brazil
- Argentina
- Rest of South America
- Europe
- Germany
- United Kingdom
- France
- Italy
- Spain
- Russia
- Rest of Europe
- Asia Pacific
- China
- Japan
- South Korea
- India
- Australia
- New Zealand
- Rest of Asia Pacific
- Middle East
- United Arab Emirates
- Saudi Arabia
- Turkey
- Rest of Middle East
- Africa
- South Africa
- Nigeria
- Kenya
- Rest of Africa
- North America
Data Sources, Market Sizing, and Validation
Desk Research
Desk research is used to set the boundaries of what counts as MRO spend and to anchor the model with objective activity indicators. We typically refer to public sources such as the US Bureau of Labor Statistics for maintenance labor trends, the US Census Bureau and Eurostat for industrial activity signals, the International Energy Agency for power and industrial energy mix context, and the World Bank for macro variables that influence operating spend.
It is also cross-checked with company annual reports and investor decks to understand how maintenance budgets move with output, uptime targets, and asset life cycles. Where available, we use paid subscriptions for company financials and intelligence, broad news and financials, patent databases, and an import and export shipment-level database to validate selected price and supply chain signals. This list is illustrative only, and many other public sources were used for data collection, validation, and clarification during the work.
Primary Interviews and Surveys
Primary work is used to confirm what buyers actually include in MRO budgets, how pricing is moving, and where outsourcing is increasing or being pulled back. We speak with a mix of maintenance heads, plant and facility managers, procurement teams, distributors, and service providers across APAC, EMEA, and the Americas so assumptions from desk research can be corrected and then triangulated back into the final model.
Distribution of primary research fieldwork respondents
| Company type | Respondent position | Region |
|---|---|---|
| Top tier: 31% | CXOs: 15% | APAC: 48% |
| Mid tier: 47% | Functional/Unit leaders: 26% | EMEA: 31% |
| Smaller Players: 22% | Managers: 59% | Americas: 21% |
Market-Sizing & Forecasting
The sizing starts with a top-down build that reconstructs demand from industrial activity and installed base signals, then translates those into spend using MRO intensity ratios. For MRO, the practical inputs include industrial production and capacity utilization, maintenance labor hours and wage inflation, average spare parts and consumables price movement, outsourcing penetration for maintenance tasks, and the pace of asset replacement and retrofits in plants and utilities.
Once the total is shaped, it is corroborated using selective bottom-up approximations, such as sampled supplier and distributor revenue mixes, service contract run rate checks, and volume-times-price spot checks for common parts categories where public signals exist. When a bottom-up view has gaps, for example small local suppliers with limited disclosure, we adjust using channel share assumptions validated through interviews and then keep the adjustments conservative.
Forecasting uses scenario analysis supported by a simple multivariate regression lens, where the drivers are industrial output, price inflation for parts and labor, and expected shifts toward predictive and condition-based maintenance. The scenario weights are set after rechecking assumptions with practitioners who track budgets and work orders, so the forward curve stays realistic.
Data Validation & Update Cycle
Validation is done in layers so unusual spikes do not slip through. We compare the modeled totals against independent signals such as manufacturing output trends, maintenance hiring momentum, and spare parts pricing direction, and then review differences until a clear explanation is documented.
Before sign-off, the work goes through multi-step analyst reviews, and follow-up calls are triggered when a key variable moves outside the expected range or when interview feedback conflicts with desk indicators. Reports are refreshed annually, with interim updates when material events impact industrial output, inflation, or maintenance outsourcing. Right before delivery, an analyst does a final pass to ensure the latest available data has been reflected consistently across the model.
Mordor Intelligence's Maintenance Repair Operations MRO Market Size Measured Against Other Published Estimates
Published MRO market values can look far apart even when they are talking about similar spending, because the boundary around what counts as MRO is not always the same. Differences also come from the base year selected, the exchange rate timing used for converting local spending into USD, and whether pricing is modeled as a smooth curve or tied to observed inflation cycles.
A refresh-led gap is common in this market, since parts and labor inflation can change quickly and industrial activity can cool or rebound within a few quarters. By aligning currency conversion timing and updating average selling price assumptions with the latest observable inflation and contract signals before publishing, Mordor Intelligence lands at a different 2025 total than estimates that rely on older price baselines or that blend capital projects into operating maintenance spend.
Benchmark comparison
| Source | Market Size | Gaps in Research Methodology |
|---|---|---|
| Mordor Intelligence | USD 440.89 B (2025) | |
| Industry Research Publisher A | USD 683.50 B (2024) | Uses an earlier base year and a broader spend perimeter that appears to roll in wider facility and infrastructure support services, which can inflate the total versus a tighter MRO-only budget definition. |
| Industry Research Publisher B | USD 190.00 B (2024) | Represents a narrower scope that seems to emphasize selected sectors and direct maintenance services, which can undercount indirect consumables and parts spending captured in broader industrial MRO procurement. |
Taken together, the spread is mainly explained by scope boundaries and timing choices rather than math errors. When spend categories are clearly separated, pricing is updated in line with current inflation and contracts, and the result is checked against activity indicators, the output becomes easier to trace and repeat for future updates.


Key Questions Answered in the Report
How large is the maintenance, repair, and operations market in 2026?
The maintenance, repair, and operations market size is USD 450.46 billion in 2026 and is projected to reach USD 501.51 billion by 2031 at a 2.17% CAGR.
Which MRO product category is growing fastest?
Electrical MRO parts, covering transformers, switchgear, and sensors, are forecast to expand at a 3.91% CAGR through 2031 as utilities modernize aging grids.
Why are integrated supply contracts gaining traction?
Integrated supply models shift inventory ownership to distributors, cut purchase-order volumes, and deliver guaranteed fill rates, which appeals to finance teams aiming to reduce working capital.
What is driving predictive maintenance adoption?
Falling sensor costs, cloud analytics accuracy, and documented reductions in downtime and spare-parts usage are pushing plants to transition from time-based routines to condition-based strategies.
Which region is expected to see the fastest MRO growth?
Asia Pacific is projected to advance at a 5.86% CAGR, propelled by semiconductor capacity additions in China and large-scale infrastructure projects in India and Southeast Asia.
How concentrated is the competitive landscape?
The top five distributors hold roughly 25-30% of global revenue, indicating moderate consolidation with significant share still available to regional and digital specialists.
Page last updated on:




