Mackerel Market Size and Share
Market Overview
| Study Period | 2020 - 2030 |
|---|---|
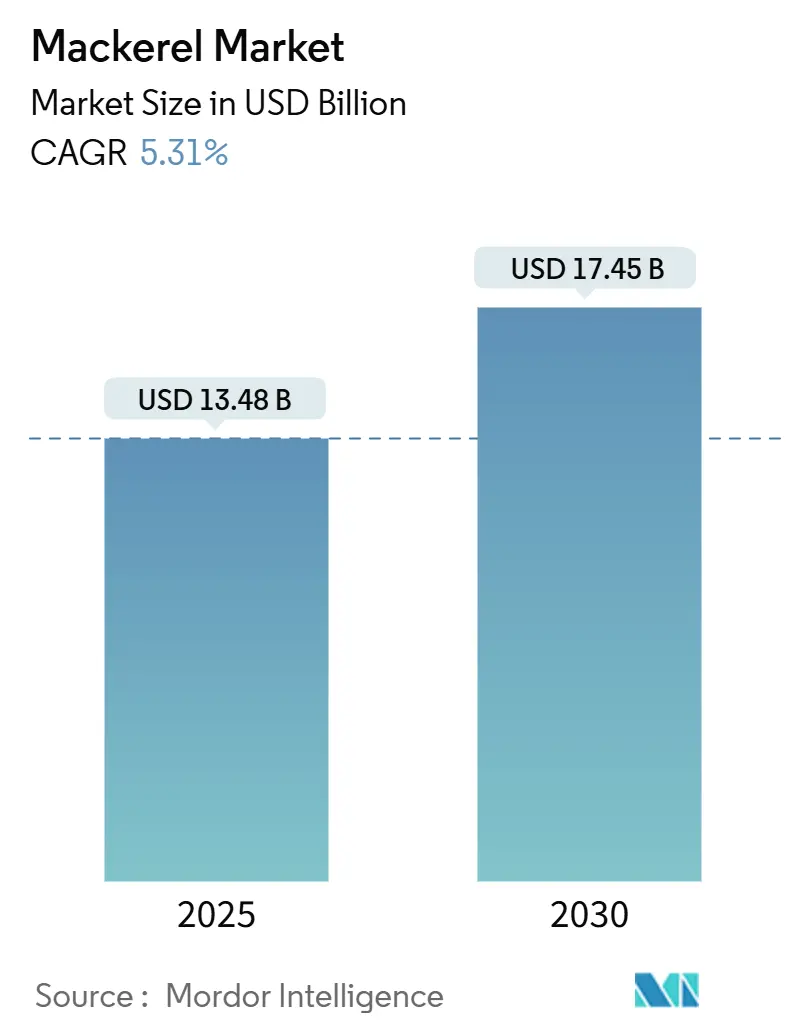
| Market Size (2025) | USD 13.48 Billion |
| Market Size (2030) | USD 17.45 Billion |
| Growth Rate (2025 - 2030) | 5.31% CAGR |
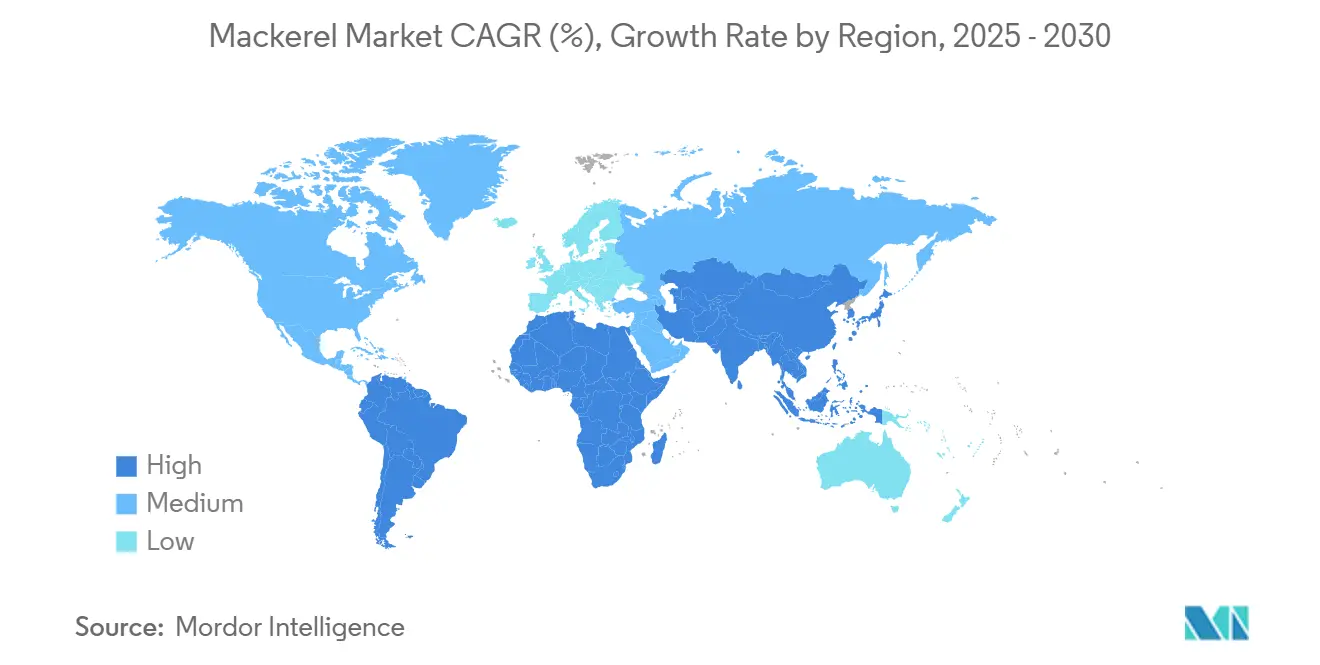
| Fastest Growing Market | Asia Pacific |
| Largest Market | Europe |
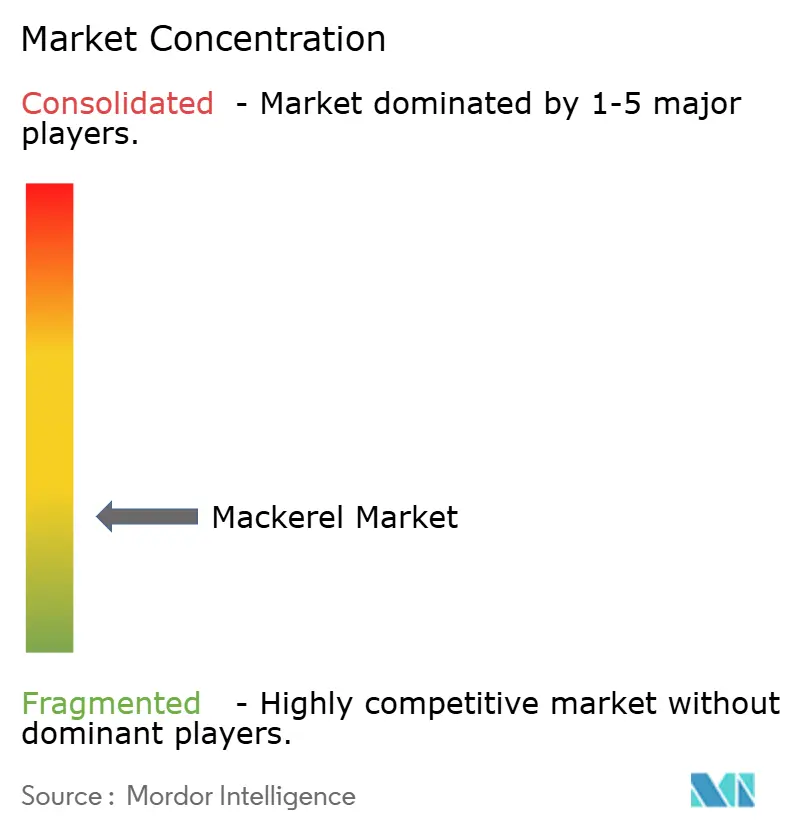
| Market Concentration | Low |
Major Players
*Disclaimer: Major Players sorted in no particular order Image © Mordor Intelligence. Reuse requires attribution under CC BY 4.0. |
|
Mackerel Market Analysis by Mordor Intelligence
The global mackerel market size stood at USD 13.48 billion in 2025 and is forecast to reach USD 17.45 billion by 2030, advancing at a 5.31% CAGR. Solid consumer appetite for inexpensive pelagic proteins, stepped-up canned-seafood purchases in Asia, and supportive European quota reforms anchor the current expansion. Europe remains the principal supply hub thanks to deep-water fleets and sophisticated processing plants, while Asia-Pacific is gathering speed as incomes rise and dietary preferences tilt toward marine proteins. Diversified product formats—especially frozen blocks for foodservice and shelf-stable cans for retail—help suppliers cushion freight and currency swings. Ongoing scrutiny of mercury content favors Atlantic mackerel, which carries an FDA “Best Choice” rating with only 0.05 ppm of mercury, and thereby strengthens the species’ premium positioning in safety-conscious markets.
Key Report Takeaways
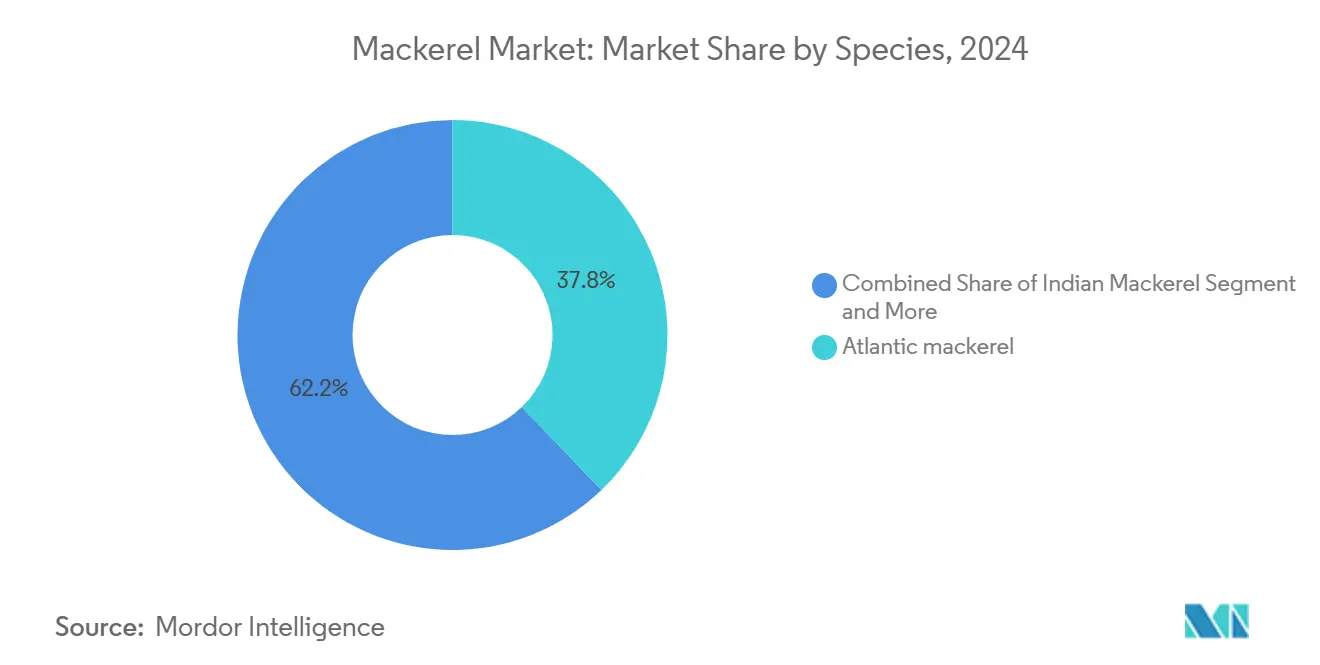
- By species, Atlantic mackerel held 38.18% of the mackerel market share in 2024, whereas Indian mackerel is projected to widen at 6.74% CAGR through 2030.
- By form, frozen packs commanded 44.74% share of the mackerel market size in 2024, while canned variants are set to post the swiftest 7.28% CAGR to 2030.
- By end-user, retail outlets captured 49.31% revenue in 2024, yet feed and pet-food demand is on course for a 7.95% CAGR through 2030.
- By geography, Europe led with 36.85% mackerel market share in 2024; Asia-Pacific represents the fastest-growing region at a projected 6.41% CAGR.
Global Mackerel Market Trends and Insights
Drivers Impact Analysis*
| Driver | (~) % Impact on CAGR Forecast | Geographic Relevance | Impact Timeline |
|---|---|---|---|
| Surging demand for affordable pelagic proteins | +0.9% | Global, with concentration in emerging Asia | Medium term (2-4 years) |
| Growth of canned seafood consumption in emerging Asia | +0.8% | Asia-Pacific core, spill-over to MEA | Long term (≥ 4 years) |
| EU catch-quota liberalisation for Atlantic mackerel | +0.7% | Europe & North Atlantic fishing zones | Short term (≤ 2 years) |
| Expansion of aquaculture-fed mackerel diets | +0.6% | Global aquaculture regions, led by Asia-Pacific | Long term (≥ 4 years) |
| Norwegian long-term supply contracts with Japan | +0.5% | North Atlantic to Asia trade corridor | Medium term (2-4 years) |
| AI-optimised purse-seine route planning systems | +0.4% | Advanced fishing fleets globally | Medium term (2-4 years) |
| Source: Mordor Intelligence | |||
Surging Demand for Affordable Pelagic Proteins
As traditional livestock costs rise and sustainability concerns mount, global protein consumption is shifting towards more affordable marine sources. In Asia, there's a pronounced preference for pelagic species, with projections indicating that fish will make up nearly 75% of the region's protein intake by 2031. South Korea is a case in point: mackerel has surged in popularity, pushing per capita seafood consumption to 68.4 kg in 2023. In developing nations, as incomes climb, the demand for nutritionally rich yet budget-friendly protein sources intensifies. This trend is further fueled by a growing health consciousness, steering consumers towards omega-3-rich marine proteins. Mackerel, with its superior fatty acid profile, stands out against land-based options. Meanwhile, global economic strains, from inflation to supply chain hiccups, have made these affordable protein sources even more appealing to cost-sensitive consumers.
Growth of Canned Seafood Consumption in Emerging Asia
Emerging Asian economies are witnessing a robust expansion in canned seafood markets. In 2020, the global sector represented 11% of total fisheries production and is projected to grow at an annual rate of 6.2% through 2031. Urbanization in nations like China and India is driving a demand for convenient, shelf-stable protein sources, catering to busy lifestyles and limited refrigeration. This convenience is especially crucial in densely populated urban areas, where access to fresh seafood is restricted and storage capabilities influence purchasing choices. Canned mackerel, with its extended shelf life and ambient storage needs, is accessible to consumers from varied economic backgrounds and locations. Innovations in processing are not only enhancing product quality and safety standards, addressing past concerns, but also broadening market acceptance among discerning consumers.
EU Catch-Quota Liberalisation for Atlantic Mackerel
In 2025, European Union fisheries ministers set total allowable catches (TACs) at over 1.24 million tonnes, translating to a value of nearly EUR 2.53 billion, spanning more than 100 stock categories[1]Agriculture and Horticulture Development Board. "Asia: How much do they consume?" January 1, 2024. https://ahdb.org.uk/trade-and-policy/export-opps/regions/asia/consumption.. The regulatory framework strikes a balance between ensuring stock sustainability and the industry's viability. It also introduces compensation mechanisms to bolster fishing communities, all while upholding ecological integrity. Yet, challenges arise in quota management. Non-EU coastal states, notably Iceland and the Faroe Islands, have unilaterally set quotas surpassing scientific recommendations, leading to market supply uncertainties. The ongoing liberalization process employs advanced stock assessment techniques and real-time monitoring systems. These tools aim to fine-tune catch allocations and avert overfishing. Complicating matters further, Brexit has muddied quota-sharing dynamics, necessitating bilateral talks between the EU and UK to ensure the sustainable management of their shared Atlantic mackerel stocks.
Expansion of Aquaculture-Fed Mackerel Diets
As the aquaculture sector expands, the demand for marine protein ingredients rises. To keep pace with industry needs, fish feed production must grow by 8-10% annually[2]Go, Seonggil, Joon-ho Lee, and Sukgeun Jung. "Projecting the Shift of Chub Mackerel (Scomber japonicus) Spawning Grounds Driven by Climate Change in the Western North Pacific Ocean." Fishes 10, no. 1 (2025): 20. https://doi.org/10.3390/fishes10010020.. Over the last two decades, traditional fishmeal prices have skyrocketed by over 260%. This surge has paved the way for alternative protein sources, such as processed mackerel meal and its by-products. The industry's shift from viewing ingredients as mere commodities to strategically sourcing them underscores the heightened emphasis on nutritional optimization in aquaculture. Research highlights the effective replacement of conventional fishmeal with mackerel-based options. Notably, jack mackerel meal, when used as a feed stimulant in rockfish diets, has delivered growth performance and feed efficiency on par with traditional methods. As sustainability concerns mount over conventional fishmeal sources, there's a swift pivot towards underutilized pelagic species. This shift not only underscores the rising prominence of mackerel but also its potential as a primary protein source for the world's burgeoning aquaculture operations.
Restraints Impact Analysis*
| Restraint | (~) % Impact on CAGR Forecast | Geographic Relevance | Impact Timeline |
|---|---|---|---|
| High volatility of Total Allowable Catches (TACs) | -0.6% | North Atlantic fishing zones | Short term (≤ 2 years) |
| Rising scrutiny over methyl-mercury levels | -0.4% | Global, particularly developed markets | Long term (≥ 4 years) |
| Strengthening KRW & NOK dampening Asian import margins | -0.3% | Asia-Pacific import markets | Medium term (2-4 years) |
| Container-rate spikes on North-Europe–Asia lane | -0.2% | Europe-Asia trade corridor | Short term (≤ 2 years) |
| Source: Mordor Intelligence | |||
High Volatility of Total Allowable Catches (TACs)
Climate change is disrupting fish migration patterns, complicating stock assessments and leading to unprecedented volatility in Total Allowable Catch systems. For 2023, the International Council for the Exploration of the Sea advised a 2% cut in North Atlantic mackerel quotas. This move could result in actual catches plummeting by 30% from 2022 levels. In response, NOAA Fisheries enacted emergency closures for the 2024 commercial Atlantic mackerel fishery. They set strict landing limits: 10,000 pounds for limited access vessels and just 2,500 pounds for open access operations[3]NOAA Fisheries. "NOAA Fisheries Announces Closure of 2024 Commercial Atlantic Mackerel Fishery." June 12, 2024. https://www.fisheries.noaa.gov/bulletin/noaa-fisheries-announces-closure-2024-commercial-atlantic-mackerel-fishery.. Meanwhile, the Marine Conservation Society has downgraded the Northeast Atlantic mackerel's sustainability rating from 3 to 4. This change reflects concerns over catches consistently surpassing scientific recommendations, disqualifying the mackerel as a sustainable choice. Furthermore, unilateral quota hikes by coastal states, sidestepping international agreements, are sowing supply uncertainties and jeopardizing market stability.
Rising Scrutiny Over Methyl-Mercury Levels
Regulatory agencies ramp up scrutiny on methylmercury levels in seafood. The European Food Safety Authority has set a tolerable weekly intake of 1.3 µg/kg body weight for methylmercury. Atlantic mackerel, with mercury concentrations averaging 0.05 ppm—significantly below the FDA's 1.0 ppm action level—enjoys a favorable safety profile. Yet, heightened consumer awareness campaigns spotlight the mercury risks tied to seafood. King mackerel, however, is under the spotlight, averaging 0.730 ppm in mercury levels. This has led to advisories against consumption by pregnant women and children, casting a shadow over the broader mackerel category. Advanced techniques, like atomic absorption spectrometry, are honing in on mercury detection, potentially unveiling contamination levels that might prompt regulatory responses. The Zero Mercury Working Group is pushing for stricter consumer labeling, a move that could inflate compliance costs and reshape market dynamics for mackerel varieties with higher mercury content.
*Our forecasts treat driver/restraint impacts as directional, not additive. The impact forecasts reflect baseline growth, mix effects, and variable interactions.
Segment Analysis
By Species: Atlantic Lead, Indian Upswing
Atlantic mackerel opened 2024 with 38.18% mackerel market share on the back of the North Atlantic fleet scale and entrenched demand in Japanese sashimi and Korean grilling channels. Norwegian exporters shipped 313,242 t in 2024, collecting NOK 8.3 billion—an all-time high that underscored resilient appetite despite quota tension. The species enjoys premium status in Japan, where fat content doubles in autumn hauls compared with local stocks. Nevertheless, sustainability downgrades could erode certifications, nudging buyers to diversify supply.
Indian mackerel is charting a 6.74% CAGR to 2030—the quickest among monitored species—propelled by climatically expanded spawning zones and sturdy regional taste preferences. Warming waters shift biomass northward along the Bay of Bengal, enlarging exploitable grounds for coastal fishers. Regional processors capitalize on shorter intra-Asian routes that trim freight costs and preserve freshness. The species’ growing role in aquafeed also underpins incremental volume.


By Form: Frozen Scale, Canned Velocity
Frozen packs controlled 44.74% of the mackerel market size in 2024, benefiting from continuous-blast freezing lines and tanker-container logistics that assure year-round supply. Bulk IQF formats serve foodservice chains seeking predictable plate cost and uniform loin dimensions. Energy-intensive cold-storage has become a pain point during power-price spikes, but efficiency upgrades in compressors mitigate part of the burden.
Canned variants, though smaller in base, are racing ahead at a 7.28% CAGR. Multi-layer retort pouches and low-sodium brines elevate sensory appeal while stretching shelf life beyond three years. Ambient distribution circumvents port-to-inland cold-chain gaps in populous Asian interiors. Marketing centered on easy-open lids and recipe pairings garners traction among time-pressed millennials and rural households alike.
By End-User: Retail Strength, Feed Momentum
Retail aisles generated 49.31% of 2024 value, leveraging supermarket promotions and e-commerce bundles. Hypermarkets exploit scale to launch private-label mackerel market lines that undercut international brands without sacrificing quality. Online grocery adoption accelerated as insulated parcel boxes protect frozen portions during last-mile delivery. Nonetheless, heavy discounting compresses retailer margins.
Feed and pet-food channels, equal to just a minor slice today, are expanding at a 7.95% CAGR. Premium cat- and dog-food formulators highlight marine omega-3 content to justify price premiums. Aquaculture producers embrace rendered mackerel meal to partially displace expensive fishmeal, securing stable amino-acid profiles and reducing diet-cost volatility. Rising demand from shrimp and seabass farms across Southeast Asia further amplifies feed uptake.

Geography Analysis
Europe preserved a 36.85% lead in 2024, anchored by Norway’s technologically advanced fleets and the EU’s extensive oversight regime. Norwegian landings at NOK 8.3 billion set fresh revenue records, and efficient reefer links move volumes swiftly to continental processors. Still, ICES’ proposed 2025 quota represents the lowest in over a decade, signaling possible supply tightening. Investment in AI-based sonar and route-planning helps operators harvest within stricter limits while maintaining catch quality.
Asia-Pacific is staging the fastest ascent with a 6.41% CAGR, fueled by South Korea’s 41,000 t of Norwegian imports worth NOK 1 billion in 2023 and Japan’s sustained annual draw of 100,000 t. Growing urban populations in China facilitate a pivot from re-export processing toward domestic consumption. Government nutrition drives that emphasize healthy marine protein dovetail with rising disposable income, strengthening retail throughput.
North America, South America, and the Middle East & Africa hold moderate yet rising stakes. Container rate hikes on the Europe-Asia corridor threaten landed-cost parity, potentially lifting end-consumer prices by 0.6% into late 2025. Currency appreciation in the Korean won and Norwegian krone squeezes importer margins, prompting hedging strategies and alternative sourcing trials. At the same time, cold-chain investments across Gulf Cooperation Council states improve penetration of frozen formats.

Competitive Landscape
The mackerel market shows a fragmented profile with a concentration score of 3/10, reflecting numerous mid-sized harvesting firms and regional processors. Norwegian incumbents benefit from adjacent fishing grounds, integrated filleting plants, and public backing for eco-label certification. Asian actors, notably in China and Thailand, add value through cost-efficient canning lines and customized spice blends tailored to regional palates.
Technological adoption is gaining pace; AI-enabled camera systems now verify species on board with up to 81% accuracy, cutting sorting time and reducing regulatory infractions. Vertical integration represents a common hedge against quota shocks, with several Japanese importers investing in North Atlantic vessels to lock in supply. Partnerships between European fleets and Southeast Asian distributors broaden market reach while balancing currency exposure.
Strategic moves in 2024–2025 underline this trajectory. Thai Union reinforced its SeaChange® 2030 roadmap and expanded processing capacity in Thailand and Ghana to deepen penetration into West African growth pockets. Norwegian producers extended multi-season contracts with Japanese wholesalers, ensuring stable forward pricing. Meanwhile, Canadian authorities maintained a 500 t TAC yet allowed bait and research allocations, sustaining minimal local activity while stocks rebuild.
Mackerel Industry Leaders
-
Maruha Nichiro Corp.
-
Dongwon Industries
-
Pelagia AS
-
Austevoll Seafood ASA
-
Thai Union Group
- *Disclaimer: Major Players sorted in no particular order

Recent Industry Developments
- September 2024: Japan welcomes the seasonal Norwegian mackerel, dubbed "Saba Nouveau." This mackerel has swiftly evolved into an autumn staple and a favored delicacy among Japanese palates.
- March 2023: Denholm Seafoods, has initiated the construction of a new processing facility valued at GBP 30 million (USD 36.1 million, EUR 34.1 million) dedicated to its mackerel and herring catches. The company asserts that the upgrades to its existing facility, along with an enhancement of its cold-storage capacity.


Global Mackerel Market Report Scope
| Atlantic Mackerel |
| Chub Mackerel |
| Indian Mackerel |
| Others |
| Fresh/Chilled |
| Frozen |
| Canned |
| Smoked |
| Others |
| Foodservice | |
| Retail | Supermarkets & Hypermarkets |
| Convenience Stores | |
| Online Retail | |
| Specialty Stores | |
| Others | |
| Animal Feed and Pet Food | |
| Others |
| North America | United States |
| Canada | |
| Mexico | |
| Rest of North America | |
| Europe | Germany |
| United Kingdom | |
| Italy | |
| France | |
| Spain | |
| Netherlands | |
| Russia | |
| Rest of Europe | |
| Asia-Pacific | China |
| India | |
| Japan | |
| Australia | |
| Indonesia | |
| South Korea | |
| Thailand | |
| Singapore | |
| Rest of Asia-Pacific | |
| South America | Brazil |
| Argentina | |
| Chile | |
| Peru | |
| Rest of South America | |
| Middle East and Africa | South Africa |
| Saudi Arabia | |
| United Arab Emirates | |
| Nigeria | |
| Egypt | |
| Iran | |
| Turkey | |
| Rest of Middle East and Africa |
| By Species | Atlantic Mackerel | |
| Chub Mackerel | ||
| Indian Mackerel | ||
| Others | ||
| By Form | Fresh/Chilled | |
| Frozen | ||
| Canned | ||
| Smoked | ||
| Others | ||
| By End-User | Foodservice | |
| Retail | Supermarkets & Hypermarkets | |
| Convenience Stores | ||
| Online Retail | ||
| Specialty Stores | ||
| Others | ||
| Animal Feed and Pet Food | ||
| Others | ||
| Geography | North America | United States |
| Canada | ||
| Mexico | ||
| Rest of North America | ||
| Europe | Germany | |
| United Kingdom | ||
| Italy | ||
| France | ||
| Spain | ||
| Netherlands | ||
| Russia | ||
| Rest of Europe | ||
| Asia-Pacific | China | |
| India | ||
| Japan | ||
| Australia | ||
| Indonesia | ||
| South Korea | ||
| Thailand | ||
| Singapore | ||
| Rest of Asia-Pacific | ||
| South America | Brazil | |
| Argentina | ||
| Chile | ||
| Peru | ||
| Rest of South America | ||
| Middle East and Africa | South Africa | |
| Saudi Arabia | ||
| United Arab Emirates | ||
| Nigeria | ||
| Egypt | ||
| Iran | ||
| Turkey | ||
| Rest of Middle East and Africa | ||


Key Questions Answered in the Report
Which region commands the largest share of worldwide mackerel revenues?
Europe leads with 36.85% share in 2024, supported by well-developed fleets and processing infrastructure.
Where is demand for mackerel rising the quickest?
Asia-Pacific shows the fastest momentum with an expected 6.41% CAGR to 2030, propelled by growing middle-class protein intake.
Which species segment currently dominates and which is growing the fastest?
Atlantic mackerel accounts for 38.18% of global value, while Indian mackerel is on track for the quickest 6.74% CAGR through 2030.
Why are canned products gaining ground in emerging Asian economies?
Shelf-stable cans suit dense urban areas with limited refrigeration, and the format is forecast to expand at a 7.28% CAGR on the back of convenience and improved retort technology.
Page last updated on:


