
Kenya Integrated Facility Management Market Size and Share
Market Overview
| Study Period | 2020 - 2031 |
|---|---|
| Forecast Data Period | 2026 - 2031 |
| Base Year Market Size (2025) | USD 0.71 Billion |
| Market Size (2026) | USD 0.79 Billion |
| Market Size (2031) | USD 1.37 Billion |
| Growth Rate (2026 - 2031) | 11.64 % |
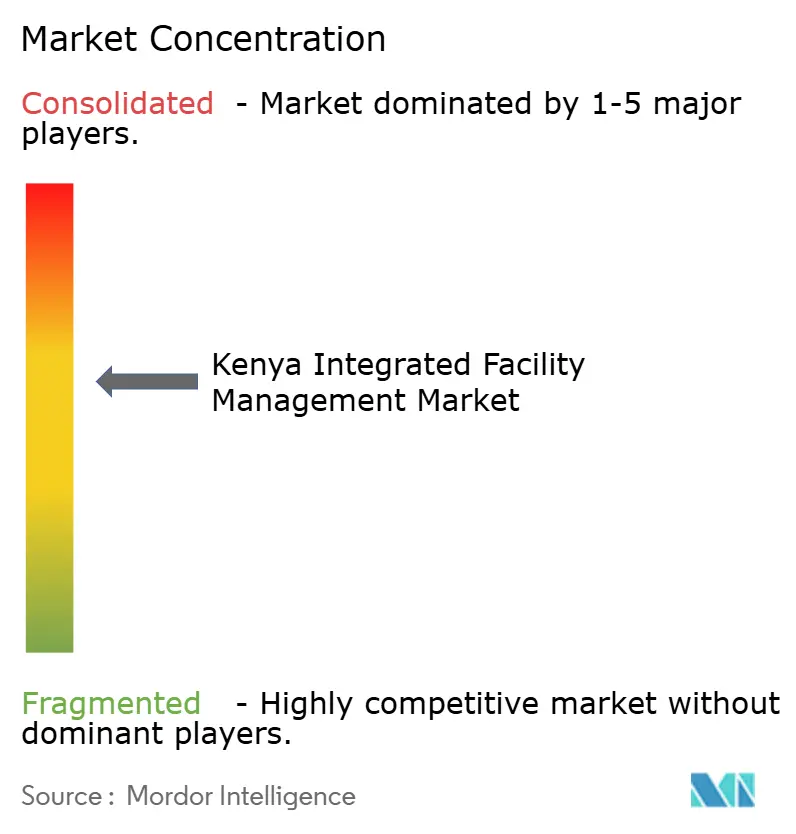
| Market Concentration | Medium |
Major Players *Disclaimer: Major Players sorted in no particular order Image © Mordor Intelligence. Reuse requires attribution under CC BY 4.0. | |
Kenya Integrated Facility Management Market Analysis by Mordor Intelligence
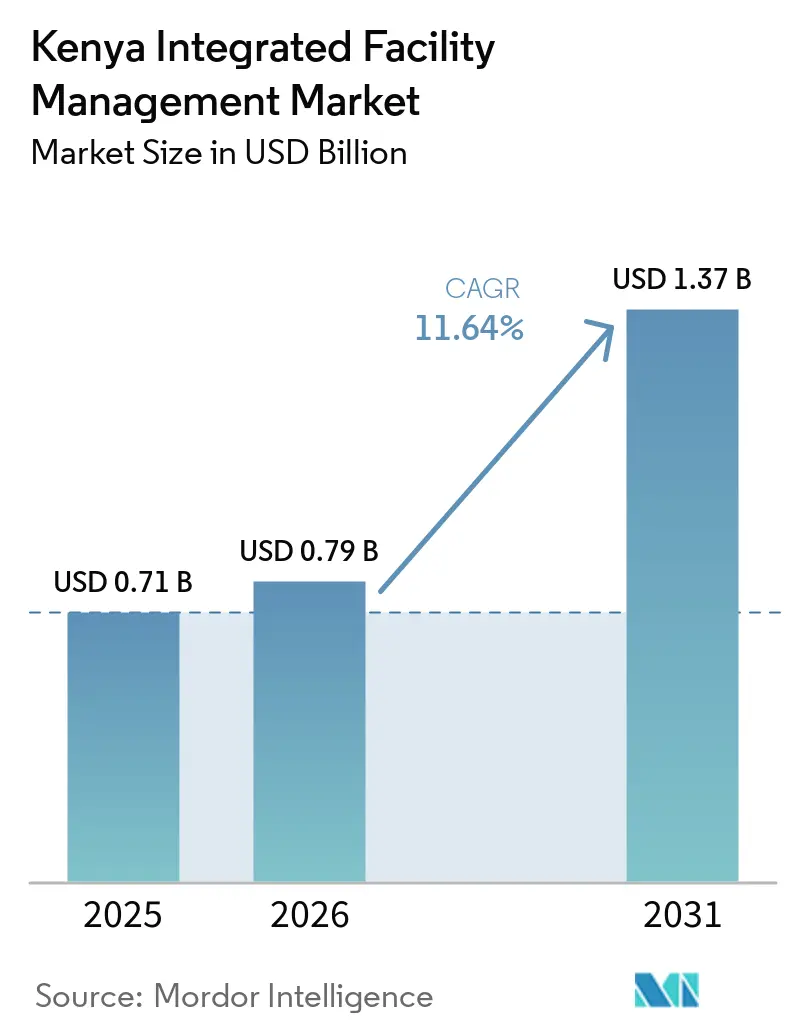
The Kenya integrated facility management market size is expected to increase from USD 0.71 billion in 2025 to USD 0.79 billion in 2026 and reach USD 1.37 billion by 2031, growing at a CAGR of 11.64% over 2026-2031. The Kenya integrated facility management (IFM) market is being supported by a deep pipeline of transport, energy, water, industrial, and logistics assets that are moving into long-life operating cycles and need formal service contracts over many years. Nairobi is also lifting demand as premium offices, smart buildings, and special economic zone campuses raise the standard for building operations and widen the scope of outsourced services, with prime office occupancy rising to 81.58% by December 2025. The shift from in-house building operations to outsourced contracts is now more visible across commercial sites, industrial parks, healthcare facilities, and hospitality assets, which is widening the addressable base of the Kenya integrated facility management market. Cost pressure remains a real constraint because inflation reached 5.6% in April 2026, while technical skill shortages and fragmented accreditation rules make national expansion harder outside Nairobi. Even so, the Kenya IFM market still has room to grow because formal FM penetration remains low in secondary cities and because global, regional, and local operators are all trying to secure recurring contracts tied to newer, more complex properties.
Key Report Takeaways
- By service type, soft facility management segment held 61.73% share of revenue in 2025, while hard facility management segment in the Kenya integrated facility management market is projected to expand at a 12.05% CAGR through 2031.
- By end user, the industrial and process segment held 27.32% share in 2025, while the commercial segment in the Kenya integrated facility management (IFM) market is projected to grow at a 12.33% CAGR through 2031.
Note: Market size and forecast figures in this report are generated using Mordor Intelligence’s proprietary estimation framework, updated with the latest available data and insights as of January 2026.
Kenya Integrated Facility Management Market Trends and Insights
Drivers Impact Analysis*
| Driver | (~) % Impact on CAGR Forecast | Geographic Relevance | Impact Timeline |
|---|---|---|---|
| Growing Public-Private Partnership Investments In Kenyan Infrastructure | +3.0% | National, with early gains in Nairobi, Mombasa, and LAPSSET corridor counties | Medium term (2-4 years) |
| Expansion Of Grade A Commercial Real Estate In Nairobi And Secondary Cities | +2.5% | Nairobi, Westlands, Upper Hill, Kilimani, with spillover to Kisumu, Nakuru, and Eldoret | Medium term (2-4 years) |
| Outsourcing Trend Among Industrial Parks And Special Economic Zones | +2.0% | Nairobi Eastern Bypass, Mombasa Port zone, and county EPZ flagship sites such as Sagana, Kabati, Eldoret, and Nasewa | Short term (≤ 2 years) |
| Digitalization Of FM Through IoT Enabled Building Management Systems | +1.5% | National, concentrated in Nairobi Grade A stock with expansion to Mombasa and Kisumu | Medium term (2-4 years) |
| Rising Demand For Sustainable Green Building Certifications | +1.2% | National, led by Nairobi commercial and mixed use assets with spillover to coastal hospitality | Long term (≥ 4 years) |
| Integration Of Energy Performance Contracting To Lower Utility Costs | +0.8% | National, initially in large commercial and industrial designated facilities, with regulatory influence from EPRA Energy Management Regulations 2025 | Medium term (2-4 years) |
| Source: Mordor Intelligence | |||
Growing Public-Private Partnership Investments in Kenyan Infrastructure
Public-private partnerships are becoming a core source of long-duration assets for the Kenya integrated facility management market. By May 2026, Kenya had advanced 51 PPP projects valued at USD 13 billion across roads, energy, water, and industrial sectors, which expands the future base of assets that need operations and maintenance support.[1] This matters because concession structures usually run for decades, so the service opportunity is tied to asset life rather than to a one-time construction cycle. CMA CGM’s May 2026 plan to invest EUR 700 million (USD 756 million), in Mombasa Port terminals shows how large logistics assets can bring multi-decade technical obligations once expansion moves into operations. Kenya’s USD 311 million PPP for 2 high-voltage KETRACO transmission lines also follows the same pattern, with a 30-year concession that includes operation after construction.[2] As more PPP assets become active, the Kenya integrated facility management (IFM) market is likely to see a steadier flow of recurring contract demand across infrastructure-heavy end users.
Expansion Of Grade A Commercial Real Estate in Nairobi and Secondary Cities
Premium office development is widening the service scope of the Kenya integrated facility management market in both commercial and mixed-use buildings. Nairobi’s Grade A office segment moved through a clear quality-led recovery in 2025, with occupancy rising from 72.7% early in the year to 81.58% by December as tenants favored newer and more efficient buildings.[3] TRIFIC SEZ’s North Tower reached full occupancy, and the group announced a new 22-storey office tower in January 2026 backed by a USD 37.3 million green I-REIT, which points to continued demand for formal bundled services in office campuses. Purple Tower adds the same signal because its design targets a 27% reduction in energy use and a 41% reduction in water consumption, which raises the need for technical monitoring, preventive maintenance, and data-led building operations. Older Grade B and Grade C assets are also being pushed to improve service quality so they can remain competitive for tenants. That upgrade cycle broadens demand beyond top-tier stock and supports a larger contract base for the Kenya integrated facility management (IFM) market.
Outsourcing Trend Among Industrial Parks and Special Economic Zones
Industrial parks and special economic zones are creating a more formal outsourced service model for the Kenya integrtaed facility management (IFM) market. Nairobi Gate Industrial Park SEZ reported 83% occupancy of more than 400,000 square feet in 2025 and expected 95% occupancy by February 2026, using a model where more than 25 providers manage roads, power, water, gardens, and landscaping for tenants. EPZA’s county flagship projects in Sagana, Kabati, Eldoret, and Nasewa are extending that approach through 45,000 square meters of industrial sheds under 30-year land leases that support recurring service obligations. This type of demand is different from a normal office block because operators must preserve customs-control conditions, health and safety compliance, and documentation standards that protect tenants’ tax and trade status. That raises the value of bundled contracts because zone operators need coordinated delivery across utilities, security, hygiene, and maintenance rather than isolated spot services. As these parks fill up, the Kenya IFM market gains a wider base of tenants that prefer plug-and-play support instead of building internal teams.
Digitalization Of FM Through IoT Enabled Building Management Systems
Digital building operations are improving how the Kenya integrated facility management (IFM) market handles energy use, preventive maintenance, and service verification. Kenya’s smart building market stood at USD 55.7 million in 2024 and is projected to reach USD 79.6 million by 2028, reflecting stronger use of digital controls in commercial buildings. Integrated building management systems can deliver energy savings of 15-30%, and East African payback periods often fall within 2-5 years, which makes digital upgrades easier to justify in high-utility properties. The service model is changing as well because IoT-enabled FM contracts in Nairobi’s Grade A stock can carry fee premiums of 8-35% when operators take on performance obligations rather than only routine service delivery. Kenya’s cloud-based predictive maintenance tools for elevators and escalators show how major equipment support is already moving toward remote monitoring and condition-led intervention. As more assets adopt smart systems at the design stage, the Kenya integrated facility management (IFM) market is likely to shift further toward technical, data-backed contracts.
Restraints Impact Analysis*
| Restraint | (~) % Impact on CAGR Forecast | Geographic Relevance | Impact Timeline |
|---|---|---|---|
| Fragmented Regulatory Environment For FM Service Accreditation | -1.8% | National, most acute in counties outside Nairobi where enforcement capacity is limited, with compliance factors spanning NCA, EPRA, and KENAS frameworks | Medium term (2-4 years) |
| Limited Availability Of Skilled FM Technicians In Regional Counties | -1.5% | National, with severity increasing outside Nairobi Metropolitan Area | Short term (≤ 2 years) |
| High Inflation Driven Cost Volatility In Cleaning And Maintenance Supplies | -1.2% | National, disproportionately affecting smaller local operators dependent on imported chemical and equipment inputs | Short term (≤ 2 years) |
| Slow Adoption Of Integrated FM Contracts Among Public Sector Bodies | -0.8% | National, with direct impact on institutional and public infrastructure | Long term (≥ 4 years) |
| Source: Mordor Intelligence | |||
Fragmented Regulatory Environment For FM Service Accreditation
Regulatory fragmentation still slows the Kenya integrated facility management market, especially for firms that want to offer integrated services across technical categories. FM operators often need to work across NCA-linked construction services, EPRA energy management requirements, and KENAS conformity structures, which creates separate approval paths and renewal cycles. The 2024 Business Laws amendments made KENAS accreditation mandatory for conformity assessment bodies, but the implementation framework has still been moving through consultation and rulemaking. This creates friction for firms that combine fire systems maintenance, energy services, asset care, and other specialist functions inside one contract. Public procurement adds another layer because there is no single standard template for integrated FM prequalification, so clients can apply different compliance filters from one tender to the next. Until a more unified standard is established, larger operators with broader compliance capacity will remain better positioned than smaller firms in the Kenya IFM market.
Limited Availability Of Skilled FM Technicians in Regional Counties
The shortage of trained technical labor is a real operating limit for the Kenya integrated facility management market outside Nairobi. The gap is most visible in MEP, HVAC, fire safety, and other hard FM functions where certification, experience, and response times all matter to the client. BrighterMonday Kenya found that 62.1% of employers reported a mismatch between graduate skills and labor market needs, with clear gaps in digital skills and technical knowledge. When the skill base is thin, providers rely more heavily on reactive maintenance, and that weakens service quality in assets that need tighter uptime control and compliance documentation. Regional counties feel the problem more sharply because talent pools are smaller and staff turnover can interrupt service continuity on complex sites. This keeps hard FM expansion slower than client demand would otherwise allow in parts of the Kenya integrated facility management (IFM) market.
*Our forecasts treat driver/restraint impacts as directional, not additive. The impact forecasts reflect baseline growth, mix effects, and variable interactions.
Segment Analysis
By Service Type: Soft FM Dominates While Hard FM Builds Faster Technical Depth
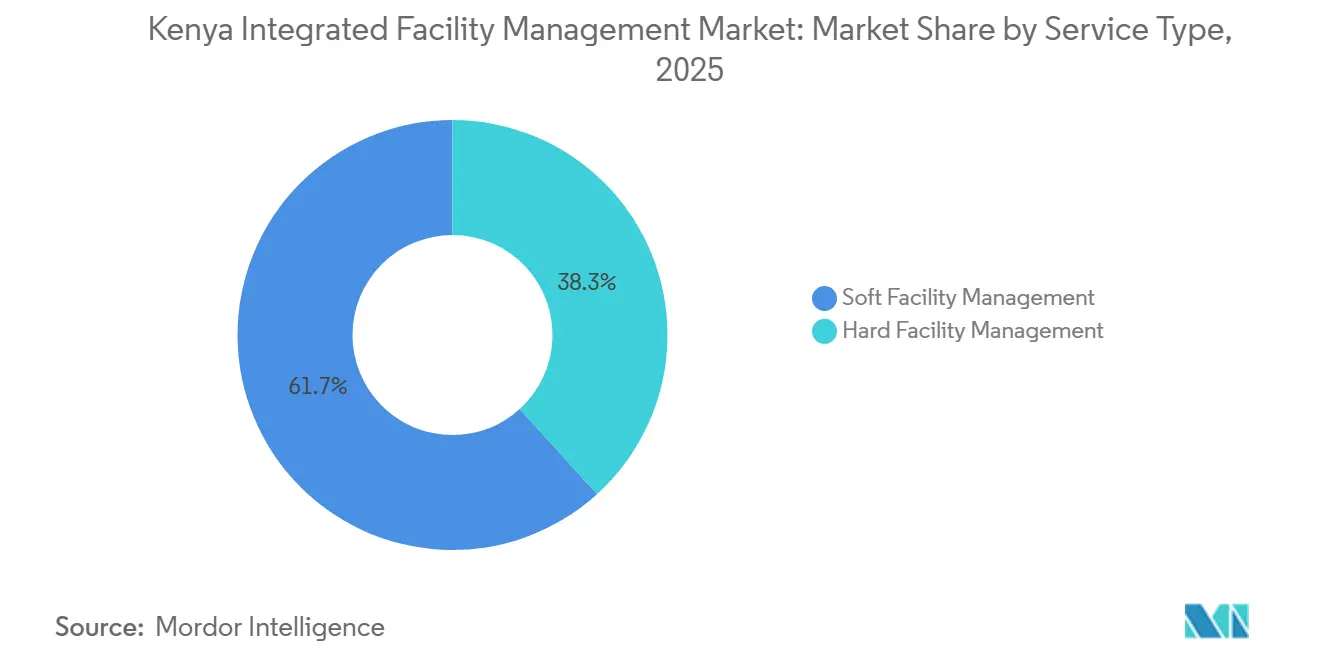
Soft Facility Management (Soft FM) held 61.73% of Kenya integrated facility management (IFM) market share in 2025, which shows how strongly the sector still depends on cleaning, security, office support, and catering contracts. This leading position came from the outsourcing habits of embassies, UN agencies, major corporates, healthcare facilities, and hospitality properties that adopted non-core service outsourcing earlier than many industrial users. The service base has also expanded with multi-tenant offices and flexible workspaces, where operators need daily cleaning, front-of-house support, guarding, and common-area management as part of routine occupancy support. IWG added 25,800 square feet across 3 new Nairobi co-working centers in late 2025, while Workstyle opened its 3rd outlet, which added more demand for bundled service support in shared office environments. Catering is also becoming more relevant in industrial parks and camp-style operations, where integrated providers such as TSEBO Facilities Solutions Kenya support food, hygiene, and site services under one delivery model.
Hard FM is the faster-growing side of the Kenya integrated facility management industry, with a 12.05% CAGR through 2031 as newer properties bring more equipment, compliance duties, and uptime requirements. The demand is being lifted by smart and green-certified buildings that depend on central plant systems, structured asset management, and better performance monitoring. EPRA’s Energy Management Regulations 2025 require designated facilities that consume more than 180,000 kWh a year to conduct audits and implement at least 50% of identified efficiency potential, which gives technical maintenance teams a larger role in compliance delivery. Kenya’s connected maintenance tools for elevators and escalators also show how major equipment support is moving from routine service rounds to predictive service models in the Kenya IFM market.
By End User: Industrial And Process Sector Leads While Commercial Demand Accelerates
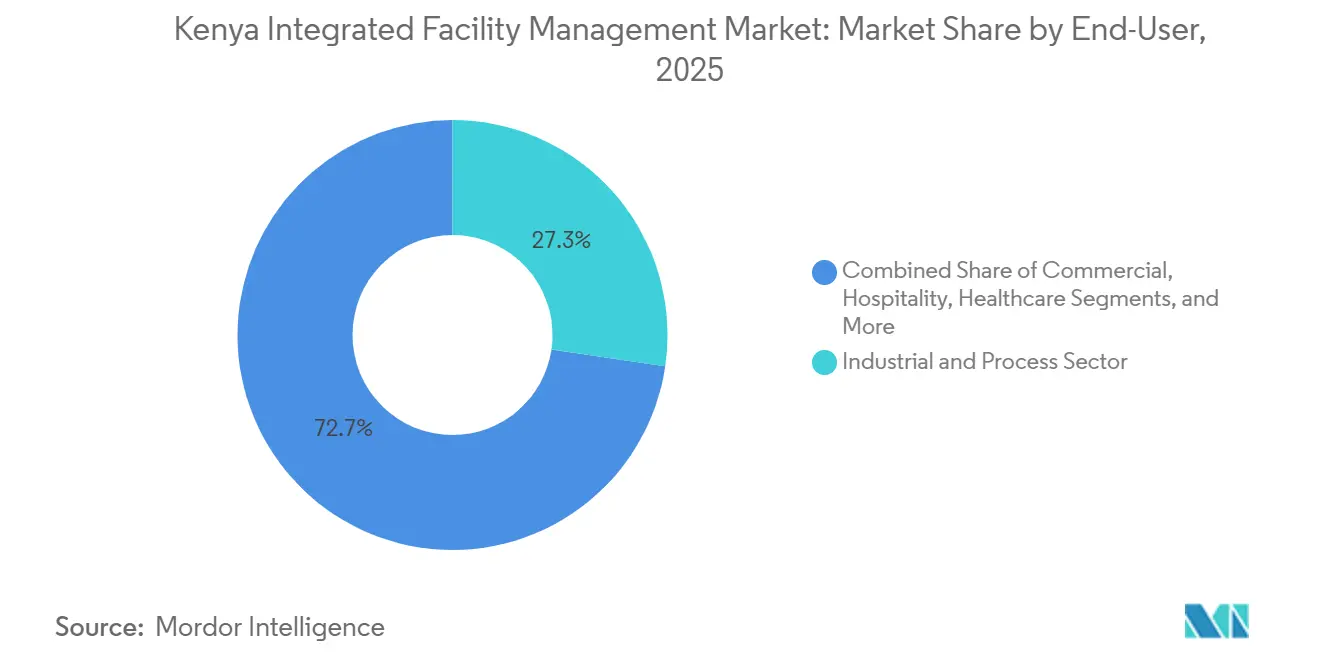
The industrial and process sector accounted for 27.32% of the Kenya integrated facility management market size in 2025, making it the largest end-user base in the country. That position reflects the operating demands of manufacturing plants, energy assets, mining-linked facilities, and industrial parks where safety, uptime, and specialist technical coverage matter more than pure cost minimization. Kenya’s push to expand manufacturing through SEZs, export processing zones, and industrial parks creates a direct path for bundled service contracts as new facilities move from commissioning into normal operations. Energy infrastructure adds another layer because grid projects and control-center assets need preventive maintenance, asset care, and technical supervision over long operating lives. Hospitality and healthcare are smaller in share, but both are deepening the contract base as hotel pipelines expand and hospital equipment programs create recurring maintenance needs.
The commercial segment is the fastest-growing part of the Kenya integrated facility management industry, with a 12.33% CAGR through 2031, supported by BFSI, IT, telecom, retail, and warehouse demand. TRIFIC SEZ’s decision to move ahead with a 2nd 22-storey Grade A office tower after full occupancy in its first tower shows how technology-intensive office campuses can compound contract demand when occupancy stays strong. Healthcare is also gaining structure as the MES program has deployed 8,613 medical equipment units across 98 hospitals, while JOOTRH’s move to national referral parastatal status in September 2025 adds more formal maintenance and waste management requirements in Kisumu. Public infrastructure remains slower because integrated FM procurement is less mature, but the broader Kenya integrated facility management market is still widening as more end users shift from fragmented vendors to structured service contracts.

Geography Analysis
Nairobi Metropolitan Area remains the main center of the Kenya integrated facility management market because it holds the deepest concentration of Grade A offices, multinational occupiers, diplomatic missions, and service-export campuses. Prime office occupancy reached 81.58% by December 2025, and the city also carried a future supply pipeline of 2.5 million square feet, most of it expected in 2027 and 2028, which supports a longer runway for new service contracts. International occupiers in Kenya continue to look for facilities that meet global operating standards, which supports demand for operators with stronger systems, certifications, and technical depth. Within the metro area, nodes such as Two Rivers SEZ and Nairobi Gate Industrial Park are building self-contained service clusters where utilities, security, landscaping, and maintenance are managed through bundled arrangements. This makes Nairobi the most mature contract environment in the Kenya integrated facility management market.
Mombasa and the wider coastal belt form the second key geography for the Kenya integrated facility management market because port logistics and hospitality development sit side by side. CMA CGM’s EUR 700 million (USD 756 million), commitment to Mombasa Port terminals in May 2026 adds a large base of technical infrastructure that will need sustained operation and maintenance support once new capacity comes online. Mitchell Cotts Freight SEZ also shows how port-linked industrial parks embed roads, water, power, security, and warehousing support directly into tenant packages. Hospitality growth along the Mombasa-Kilifi corridor is lifting service expectations as international hotel brands bring tighter standards for upkeep, hygiene, utility performance, and guest-facing operations.
Secondary cities such as Kisumu, Nakuru, Eldoret, Thika, and other regional counties remain the most under-served growth frontier in the Kenya integrated facility management (IFM) market. County-level industrial projects in Sagana, Kabati, Eldoret, and Nasewa are laying the first organized base for recurring service demand outside the Nairobi-Mombasa corridor. Kisumu is also gaining depth because JOOTRH’s upgraded national role brings stronger requirements for biomedical maintenance, waste handling, and critical utility support. The main limit is still the shortage of technical staff outside the capital, which makes it harder for regional clients to secure the same breadth and quality of services available in Nairobi. That gap leaves meaningful room for expansion as operators build county coverage and technical talent pipelines.
Competitive Landscape
The Kenya integrated facility management market remains moderately fragmented, with multinational groups, pan-African specialists, and Kenyan operators all competing across different contract types. Global brands such as CBRE Group, ISS A/S, Sodexo S.A., Compass Group PLC, JLL Kenya, and Cushman & Wakefield Kenya have stronger reach with multinational clients and premium properties, especially in Nairobi’s Grade A and institutional segments. Their advantages come from technology platforms, process discipline, and the ability to manage bundled contracts across multiple sites with standardized reporting. At the same time, the Kenya integrated facility management (IFM) market does not show a single dominant operator because local and regional firms still hold room in price-sensitive, underserved, and niche technical accounts.
Competition is also shifting from basic labor supply to contract outcomes. ISS Kenya has been differentiating through sensor-enabled predictive maintenance, which helps it position hard FM around uptime and asset performance rather than around simple headcount-based billing. Knight Frank Kenya and Broll Property Group Kenya use a different route by combining property management and FM delivery, which can lift retention because the client relationship is embedded across more than one service line. Security-led operators such as G4S Kenya and Fidelity Security Services Kenya are broadening their offers from guarding into wider integrated service packages, which raises pressure on pure soft-service firms. Technology-native local platforms are also influencing the Kenya IFM market, with VigilantFM using automated scheduling, biometric attendance, and digital incident reporting to improve consistency in malls, government buildings, and residential sites.
The clearest white space sits in energy-linked technical services and regional expansion. EPRA’s 2025 regulatory shift gives providers a firmer base for energy performance models, and the approach is already well established in other countries where Johnson Controls has implemented energy service work across more than 3,000 sites. Formalization is also likely to keep rising as industry bodies become more active, with TSEBO Facilities Solutions Kenya joining the Africa Facilities Management Association in February 2024 as part of a broader standards-led push. As contracts become more technical and compliance-led, smaller operators may need partnerships, acquisitions, or stronger accreditation to remain competitive in the Kenya integrated facility management market.
Kenya Integrated Facility Management Industry Leaders
-
CBRE Group, Inc.
-
ISS A/S
-
Sodexo S.A.
-
G4S Kenya Limited
-
Bidvest Prestige Kenya Limited
- *Disclaimer: Major Players sorted in no particular order
Recent Industry Developments
- May 2026: France's CMA CGM announced a EUR 700 million (USD 756 million) investment in Mombasa Port terminals through a PPP with the Kenyan government, covering expansion of container terminal capacity, modernization of freight management systems, and improvement of inland logistics networks. The long-term concession structure creates a multi-decade technical FM obligation for port infrastructure maintenance and operations.
- May 2026: Gulf Group of Companies broke ground on a Grade A office development in Lavington, Nairobi, 2 six-storey blocks built to international commercial standards to consolidate Gulf African Bank, GulfCap Investment Bank, and GulfCap Real Estate under one campus. The complex's advanced building systems and high-quality tenant amenities are expected to demand an integrated FM contract covering technical maintenance, security, and environmental management.
- December 2025: IWG added 25,800 square feet across 3 new co-working HQ centers in Nairobi, Loresho, Crescent Parklands, and Mombasa Road, while Workstyle opened its 3rd Nairobi outlet. The expansion of flexible workspace formats increases demand for shared-building FM services and multi-tenant cleaning, security, and technical maintenance contracts across Nairobi's commercial districts.
- November 2025: Choice Hotels International signed a master development agreement to add at least 15 properties across sub-Saharan Africa and South America by 2030, with 3 initial Kenya openings targeted for early 2026, an Ascend Collection property in Maasai Mara and a Clarion and Quality Inn in Nairobi's CBD. New branded hotel openings introduce standardized global FM service specifications to the Kenyan hospitality segment.
Kenya Integrated Facility Management Market Report Scope
The Kenya Integrated Facility Management Market Report is Segmented by Service Type (Hard Facility Management [Asset Management, MEP and HVAC Services, Fire Systems and Safety, and Other Hard Facility Management Services], and Soft Facility Management [Office Support and Security, Cleaning Services, Catering Services, and Other Soft Facility Management Services]), End User (Commercial [includes BFSI, IT and Telecom, Retail and Warehouses, etc.], Hospitality [includes Eateries, Restaurants and Large-Scale Hotels], Institutional and Public Infrastructure [includes Government Establishments, Education, Transportation such as Airports and Railways, etc.], Healthcare [includes Public and Private Healthcare Facilities], Industrial and Process Sector [includes Manufacturing, Energy including Oil and Gas Exploration, Mining, etc.], and Other End-User Industries [includes Multi-House Residential, Entertainment, Sports and Leisure]). The Market Forecasts are Provided in Terms of Value (USD).
| Hard Facility Management | Asset Management |
| MEP and HVAC Services | |
| Fire Systems and Safety | |
| Other Hard Facility Management | |
| Soft Facility Management | Office Support and Security |
| Cleaning Services | |
| Catering Services | |
| Other Soft Facility Management |
| Commercial |
| Hospitality |
| Institutional and Public Infrastructure |
| Healthcare |
| Industrial and Process Sector |
| Other End-User |
| By Service Type | Hard Facility Management | Asset Management |
| MEP and HVAC Services | ||
| Fire Systems and Safety | ||
| Other Hard Facility Management | ||
| Soft Facility Management | Office Support and Security | |
| Cleaning Services | ||
| Catering Services | ||
| Other Soft Facility Management | ||
| By End User | Commercial | |
| Hospitality | ||
| Institutional and Public Infrastructure | ||
| Healthcare | ||
| Industrial and Process Sector | ||
| Other End-User | ||
Key Questions Answered in the Report
What is the 2026 value and 2031 outlook for Kenya integrated facility management?
The Kenya integrated facility management market is estimated at USD 0.79 billion in 2026 and is projected to reach USD 1.37 billion by 2031, growing at an 11.64% CAGR over 2026-2031.
Which service category currently leads in Kenya?
Soft FM leads the country with 61.73% share in 2025 because cleaning, security, office support, and catering remain the most widely outsourced services across commercial, hospitality, and healthcare assets.
Which service category is expanding the fastest through 2031?
Hard FM is the fastest-growing service type with a 12.05% CAGR, helped by smart buildings, energy compliance rules, and more demand for MEP, HVAC, fire systems, and asset management.
Which end-user group creates the largest contract base in Kenya?
The industrial and process sector held 27.32% share in 2025, supported by manufacturing, energy, and industrial park demand where uptime, safety, and technical maintenance are critical.
Why is Nairobi still the main center for outsourced building services?
Nairobi has the highest concentration of Grade A offices, multinational occupiers, diplomatic facilities, and SEZ-linked campuses, with prime office occupancy reaching 81.58% by December 2025.
What are the main issues slowing wider adoption across the country?
The biggest constraints are fragmented accreditation requirements, shortages of skilled technical staff outside Nairobi, and inflation-led pressure on labor-intensive service lines such as cleaning and catering.