IV Hydration Therapy Market Size and Share
Market Overview
| Study Period | 2019 - 2030 |
|---|---|
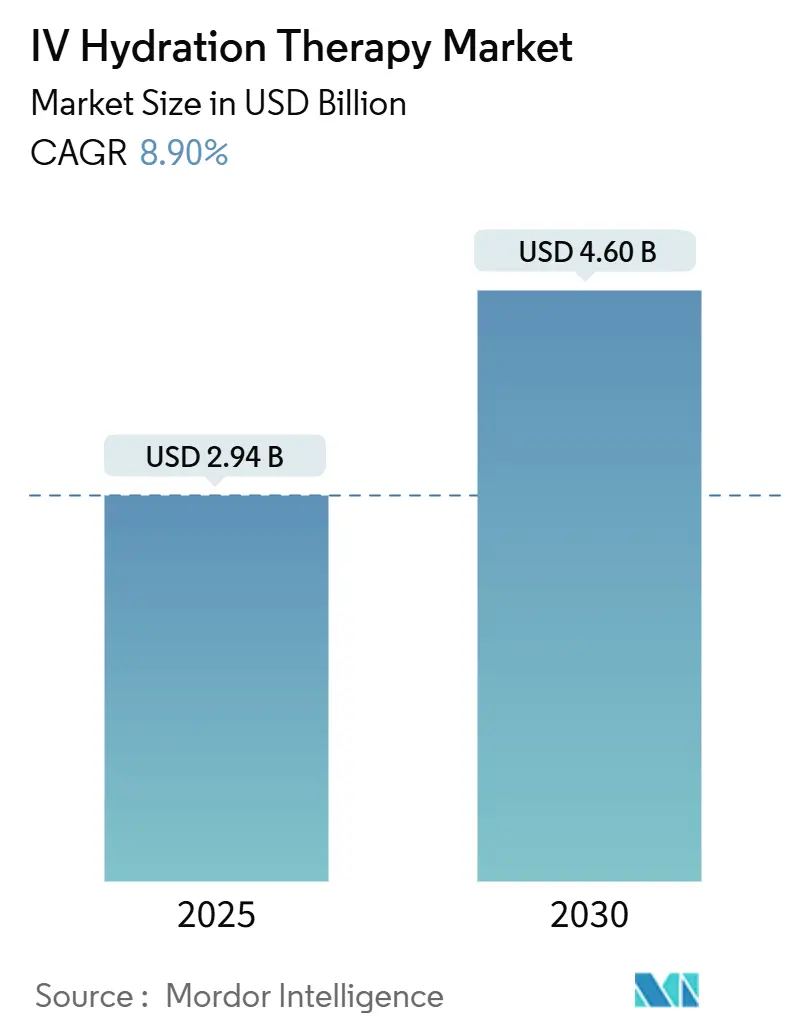
| Market Size (2025) | USD 2.94 Billion |
| Market Size (2030) | USD 4.60 Billion |
| Growth Rate (2025 - 2030) | 8.90% CAGR |
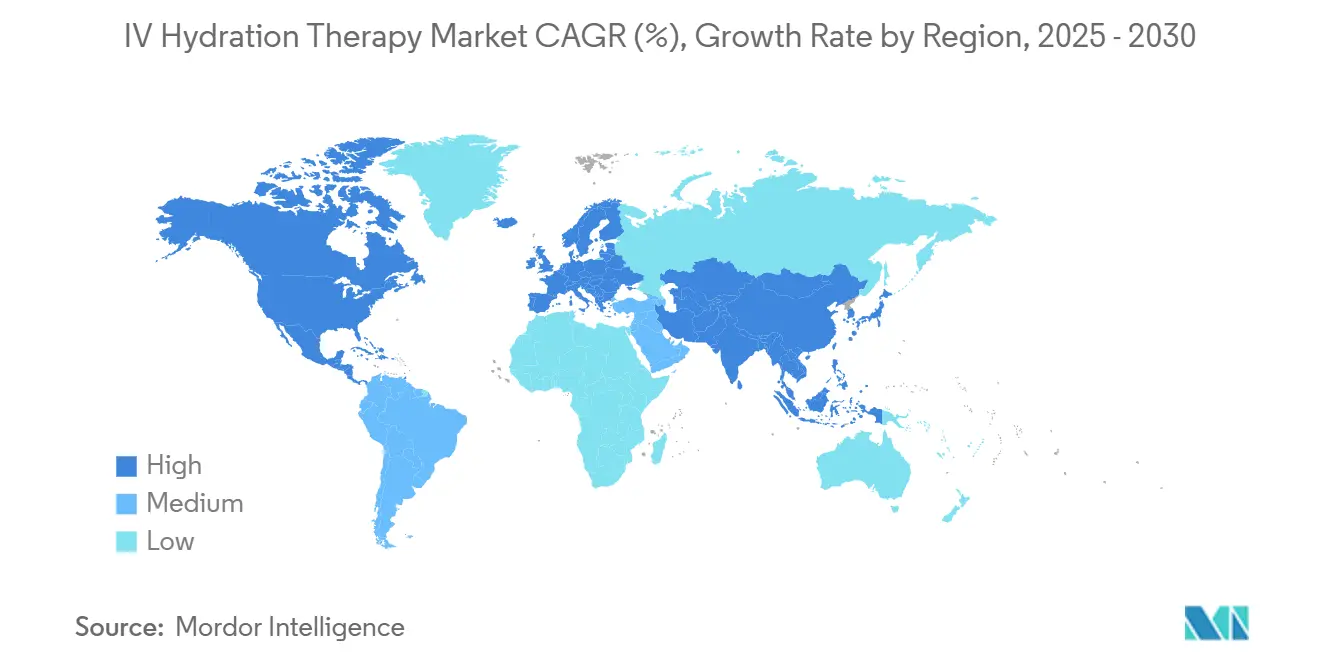
| Fastest Growing Market | Asia Pacific |
| Largest Market | North America |
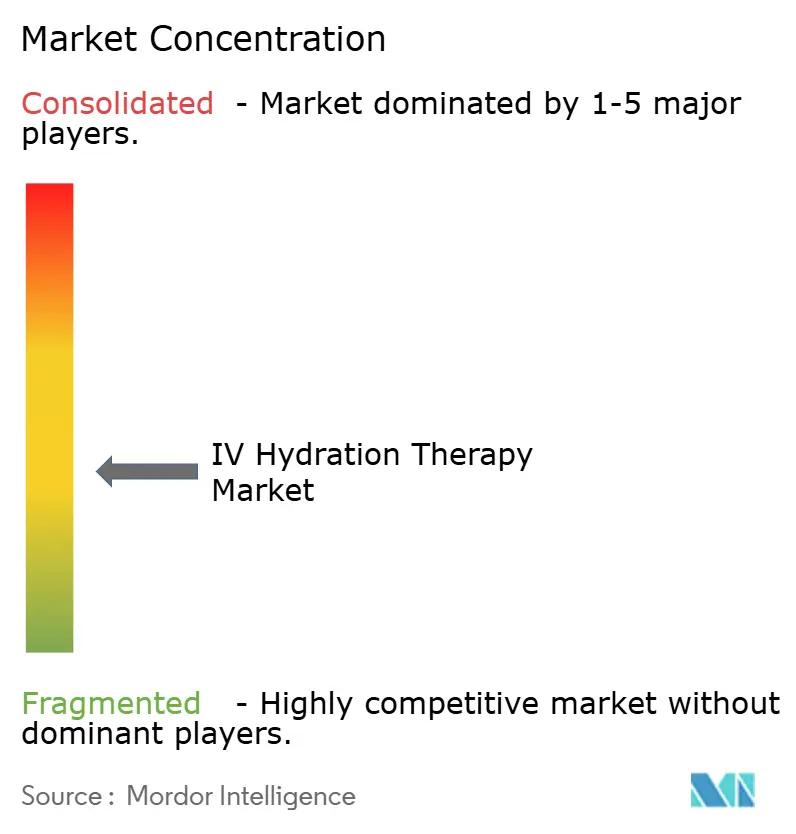
| Market Concentration | Medium |
Major Players *Disclaimer: Major Players sorted in no particular order Image © Mordor Intelligence. Reuse requires attribution under CC BY 4.0. | |
IV Hydration Therapy Market Analysis by Mordor Intelligence
The IV hydration therapy market size reached USD 2.94 billion in 2025 and is forecast to expand to USD 4.60 billion by 2030, translating into an 8.9% CAGR over the period. This solid growth trajectory reflects the collision of wellness-centric healthcare trends, celebrity-driven longevity narratives, and technology that lets licensed nurses deliver treatments door-to-door while physicians watch remotely. Demand no longer comes only from hospital patients: busy professionals, athletes, and travelers view elective drips as time-efficient tools for energy, immunity, and recovery. The IV hydration therapy market continues to diversify as corporate benefits budgets subsidize on-site drips, smart pumps slash dosage errors, and franchises lower the capital needed to open branded lounges. At the same time, chronic IV fluid shortages and new state laws requiring physician oversight inject supply-side risk that rewards operators with tight procurement and compliance playbooks.
Key Report Takeaways
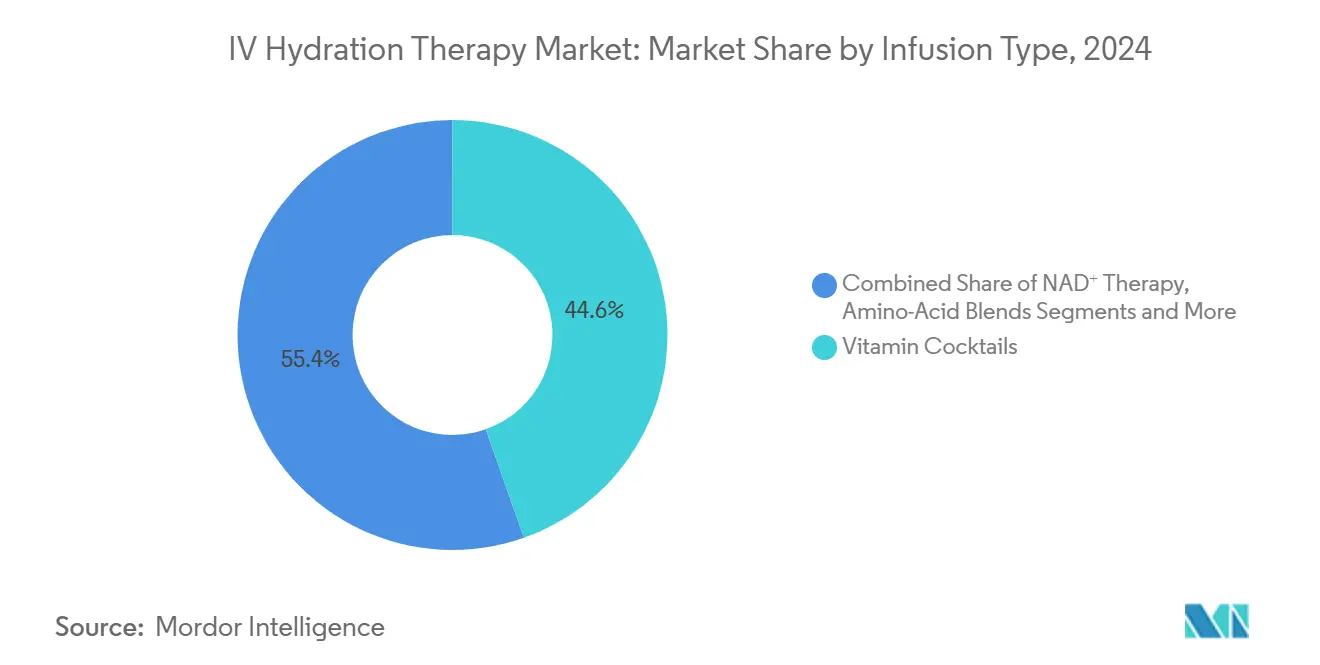
- By infusion type, vitamin cocktails captured 44.6% of IV hydration therapy market share in 2024, whereas NAD⁺ protocols are advancing at a segment-leading 15.2% CAGR to 2030.
- By service setting, in-clinic medical spas held a 46.3% share of the IV hydration therapy market size in 2024, while mobile and concierge services register the highest projected CAGR at 12.8% through 2030.
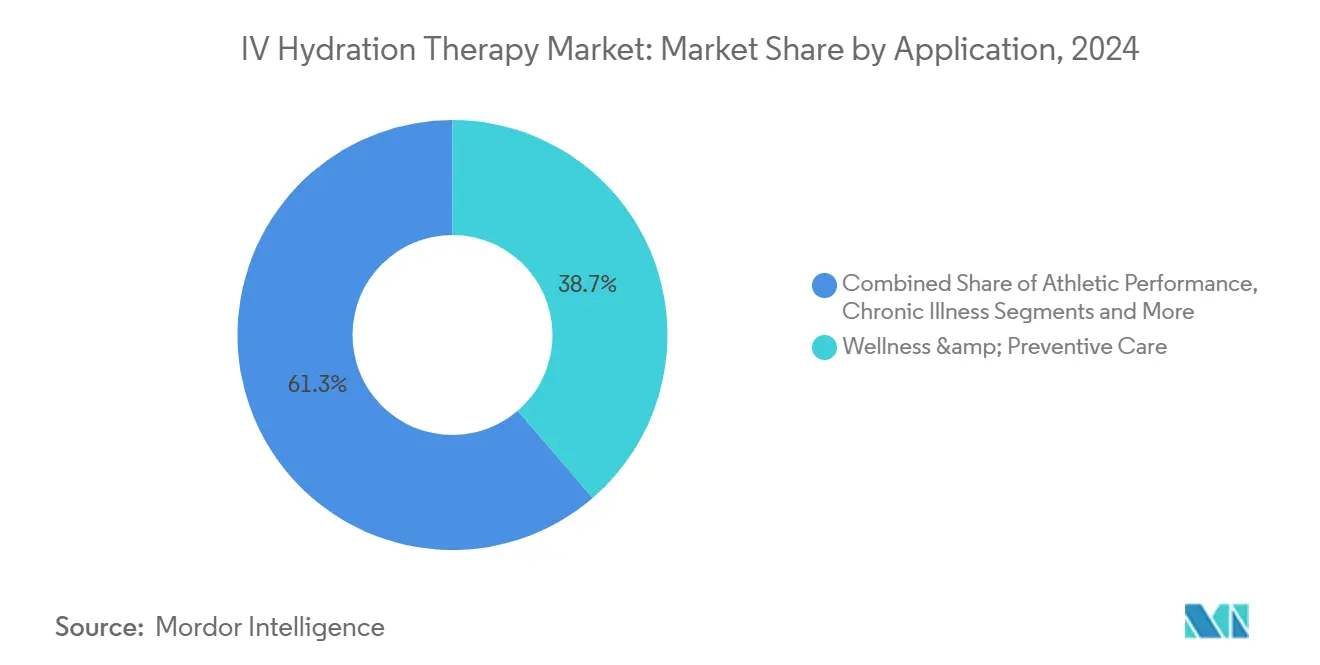
- By application, wellness and preventive care accounted for 38.7% of the IV hydration therapy market size in 2024 and athletic performance drips are expanding at an 11.4% CAGR through 2030.
- Geographically, North America led with a 39.6% slice of IV hydration therapy market share in 2024; Asia Pacific is forecast to record the fastest regional CAGR of 9.3% to 2030.
Global IV Hydration Therapy Market Trends and Insights
Drivers Impact Analysis*
| Driver | (~) % Impact on CAGR Forecast | Geographic Relevance | Impact Timeline |
|---|---|---|---|
| Rising popularity of wellness-centric medical spas | +2.10% | North America & Europe | Medium term (2-4 years) |
| Consumer pivot toward preventive healthcare & immunity optimization | +1.80% | Global | Long term (≥ 4 years) |
| Rapid growth of mobile/concierge IV services in urban hubs | +1.50% | North America & Asia Pacific | Short term (≤ 2 years) |
| Post-pandemic surge in travel-related hangover & jet-lag treatments | +1.20% | Tourism-dependent regions | Medium term (2-4 years) |
| Expansion of corporate on-site hydration benefit programs | +0.90% | North America & Europe | Medium term (2-4 years) |
| Technology-enabled remote-monitoring pumps for at-home infusions | +0.70% | Developed markets | Long term (≥ 4 years) |
| Source: Mordor Intelligence | |||
Rising Popularity of Wellness-Centric Medical Spas
Nearly 4 in 10 medical spas now list IV drips among their top revenue lines, signaling a structural shift from beauty-only menus to full-stack wellness offerings that sit comfortably between primary care and luxury hospitality.[1]American Med Spa Association, “2025 Medical Spa State of the Industry Report,” americanmedspa.org Operators bundle micronutrient cocktails with cryotherapy and red-light therapy, creating experiential packages that appeal to consumers who accept USD 300–350 session prices inside high-rise apartment towers and premium gyms. These venues offer the physician coverage regulators demand while preserving the Instagram-ready ambiance lifestyle clients expect, a balance that keeps the IV hydration therapy market visible on social timelines and credible in medical circles. Franchise chains deploy standardized protocols that streamline nurse training, inventory control, and electronic consent while pushing same-store revenue higher. As spa chains infiltrate residential and hospitality real estate, the IV hydration therapy market gains predictable foot traffic and cross-selling synergies that traditional clinics rarely match.
Consumer Pivot Toward Preventive Healthcare & Immunity Optimization
Three pandemic years recast health spending as an everyday priority, nudging consumers to chase immunity boosts with the same zeal once reserved for weight loss. Functional beverage sales growing at 7.3% CAGR underscore appetite for science-backed convenience solutions, a consumer mindset IV drips monetize by delivering 100% bioavailability in under 45 minutes. Cheaper precursors such as Niagen cut NAD⁺ drip list prices from USD 1,000 to roughly USD 300, widening access beyond celebrities to middle-income professionals intrigued by longevity science. The IV hydration therapy industry now occupies the white space between supplements and prescription medicine, positioning drips as proactive maintenance rather than post-illness rescue. Lower price points, transparent ingredient decks, and telehealth-enabled after-care together lift retention, giving the IV hydration therapy market an annuity-like revenue stream through prepaid membership models.
Rapid Growth of Mobile/Concierge IV Services in Urban Hubs
App-based scheduling and GPS-optimized nurse routing have made it feasible to infuse clients in apartments, hotel rooms, and offices without sacrificing sterility or documentation standards. Corporate HR leaders cite reduced absenteeism when dehydration-related fatigue is treated on-site, prompting benefit plans that reimburse group sessions during quarterly sales meetings. Lower rent overhead means mobile operators can undercut brick-and-mortar pricing while earning wider margins, accelerating market share gains inside the IV hydration therapy market. FDA-cleared elastomeric pumps that weigh under half a kilogram, such as Surefuser+, let nurses manage multiple appointments daily without bulky machinery. As smartphone-enabled vitals monitoring becomes commonplace, the IV hydration therapy market finds a scalable template for bringing regulated care directly to doorsteps.
Post-Pandemic Surge in Travel-Related Hangover & Jet-Lag Treatments
Rebounding air traffic has airlines, airports, and hotels racing to differentiate guest experiences, and IV bars meet that need with fast-acting recovery blends that command premium pricing. Miami International Airport added a four-menu drip lounge where travelers pay USD 199-299 to offset cabin dehydration, validating airports as high-yield retail real estate for the IV hydration therapy market. Resorts such as Wynn Las Vegas pair pre-party vitamin infusions with post-celebration detox drips, driving ancillary room revenue while aligning with luxury wellness branding.[2]Andrew Barton, Ed Fisher, and Martin Rees-Milton, “Elastomeric, Fillable Infusion Pumps: An Overview for Clinical Practice,” British Journal of Nursing, magonlinelibrary.comBecause leisure travelers tolerate higher prices and irregular schedules, hospitality partners enjoy margin lift without cannibalizing spa bookings. These visibility hubs also serve as first-touch conversion funnels, prompting repeat sessions in travelers’ home cities and thus enlarging the IV hydration therapy market user base.
Restraints Impact Analysis*
| Restraint | (~) % Impact on CAGR Forecast | Geographic Relevance | Impact Timeline |
|---|---|---|---|
| Patchwork regulatory oversight & scope-of-practice ambiguity | -1.40% | North America, Europe, APAC | Short term (≤ 2 years) |
| Intermittent global shortages of sterile IV fluids | -0.80% | Global | Medium term (2-4 years) |
| Rising scrutiny over efficacy/placebo concerns in elective use | -0.60% | Developed markets | Medium term (2-4 years) |
| Adverse-event publicity dampening consumer trust | -0.40% | Social-media-active regions | Short term (≤ 2 years) |
| Source: Mordor Intelligence | |||
Patchwork Regulatory Oversight & Scope-of-Practice Ambiguity
Seventeen U.S. states tabled bills in 2025 that redefine who may mix, prescribe, and administer IV drips, creating a compliance maze that slows franchising plans and raises legal fees. Texas’ Jenifer’s Law now compels on-site physician involvement and has become a bellwether for other jurisdictions weighing similar mandates. The FDA’s public warnings against unlicensed med-spa operators fuel consumer caution, highlighting the reputational stakes for brands that cut corners.[3]NPR, “FDA Warns of Risks in Unregulated Med-Spa IV Drips,” npr.org Smaller mobile start-ups often lack the capital for full-time medical directors or compounding audits, so regulatory tightening could consolidate the IV hydration therapy market around well-funded chains. Until federal harmonization emerges, regional fragmentation will temper nationwide rollout velocity.
Intermittent Global Shortages of Sterile IV Fluids
Hurricane Helene knocked 60% of U.S. IV saline output offline, forcing hospitals to ration bags and pushing elective clinics to cancel appointments for months. Governments from Australia to Canada are now funding domestic fill-finish plants, yet capacity will not fully come onstream until 2027, leaving the IV hydration therapy market exposed to periodic stock-outs. Because margins on commodity saline are thin, few new manufacturers rush in, and just-in-time inventories leave little buffer. Clinics hedge by pre-ordering excess stock, tying up working capital and crimping expansion budgets. Persistent supply insecurity therefore weighs on growth expectations even as demand remains robust.
*Our forecasts treat driver/restraint impacts as directional, not additive. The impact forecasts reflect baseline growth, mix effects, and variable interactions.
Segment Analysis
By Infusion Type: NAD⁺ Drives Premium Segment Growth
NAD⁺ protocols lifted their slice of the IV hydration therapy market size by posting a 15.2% CAGR and now account for a visible double-digit share, even though vitamin cocktails still lead with 44.6% of revenues. Consumers chasing longevity gains accept session pricing triple that of standard Myers’ blends, a premium operators leverage to lift average ticket values. Pharmaceutical-grade precursors reduce flushing and nausea incidents, strengthening clinical acceptance among supervising physicians who formerly deemed NAD⁺ too reactive. Meanwhile, amino-acid blends and electrolyte-only bags fill entry tiers aimed at budget-minded gym-goers and marathon trainees, ensuring the IV hydration therapy market appeals across income brackets. As influencers broadcast same-day cognitive boosts, NAD⁺ likely cements its role as the flagship upsell product, helping providers cushion margins against rising labor and saline costs.
In competitive terms, clinics highlight third-party lab certificates to differentiate NAD⁺ purity, while mobile fleets advertise low-discomfort push rates achieved via micro-drip pumps. Ongoing studies exploring mitochondrial rejuvenation will either validate or cap growth, but even placebo-adjusted effect sizes appear strong enough for recurring uptake. Given falling raw-material prices and standardized dosing algorithms, NAD⁺ looks set to deepen its imprint on the IV hydration therapy market over the forecast window.


By Service Setting: Mobile Services Disrupt Traditional Models
Brick-and-mortar medical spas still delivered 46.3% of 2024 session volume. Yet, the mobile/concierge channel, clocking a 12.8% CAGR, is clearly the engine of incremental revenue within the IV hydration therapy market. Deploying minimal capital—often a sedan, a portable cooler, and a rolling drip stand—nurses can serve five to eight clients per shift across dense downtowns, smashing the location friction that deters casual users. Clinics answer by adding curb-side “valet rooms” and bundling drips with higher-margin cryofacials, but remote-care convenience resonates most with tech-native millennials. Hospitals preserve a defensive niche by handling oncology and heart-failure infusions reimbursed by insurers, though growth is flat, underscoring how consumer dollars propel the broader IV hydration therapy market.
Franchise groups reduce operational chaos through centralized EMR, inventory, and scheduling platforms that automate everything from lot tracking to tip disbursement. By standardizing processes as rigorously as quick-service restaurants, these chains aim to convert fragmented demand into repeatable unit economics. This suggests the IV hydration therapy industry may evolve toward multi-state super-franchisors as regulation stabilizes.
By Application Purpose: Athletic Performance Gains Momentum
Wellness and preventive care still anchor 38.7% of spending, yet performance-oriented blends for endurance, muscle repair, and inflammation control now pilot the fastest 11.4% CAGR lane in the IV hydration therapy market. Thirty-minute drips shortcut the two-hour post-training recovery window, a benefit avid runners and CrossFit enthusiasts happily pay for, especially when membership pricing drops cost per session below USD 120. Sports dietitians inside pro locker rooms endorse drips for tournaments where oral hydration windows are narrow, adding institutional credibility and sponsorship visibility.
Hangover rescue remains a flashy niche, but corporate fitness challenges and hybrid work burnout open wider, steadier pipes of demand. Providers tailor amino-acid ratios and antioxidant doses based on wearable-captured vitals, inching the IV hydration therapy market closer to data-driven precision nutrition. Future regulation may separate medical claims from wellness marketing, yet athletic pipelines appear durable thanks to quantifiable benefits such as faster VO₂ recovery and delayed onset muscle soreness reduction.
Geography Analysis
North America commanded 39.6% of IV hydration therapy market share in 2024, driven by over 2,200 licensed medical spas, extensive nurse practitioner scope-of-practice laws, and consumer comfort with elective self-pay services. The United States remains the epicenter, but legislative churn—exemplified by Texas’ 2025 Jenifer’s Law—creates expansion friction that savvy franchises answer with in-house regulatory counsel and tele-supervision platforms. Supply chain scares after Hurricane Helene spurred clinics to stockpile saline and diversify vendor lists, reinforcing that operational resilience, not mere branding, anchors profitability in the IV hydration therapy market.
Asia Pacific logs the fastest 9.3% CAGR as urban professionals in Seoul, Shanghai, and Sydney embrace drips for midday productivity boosts at USD 18–45 price points, proving that lower ticket size can still yield scale when volume is high. Chinese e-commerce giants promote powdered hydration sticks that funnel curious users into brick-and-mortar or mobile IV upgrades, a converged funnel Western providers now watch closely. Japan and Australia, with mature health systems, are experimenting with prescription-adjacent home programs for chronic fatigue and peri-operative recovery, hinting at medical-wellness cross-pollination that could expand insurer participation in the IV hydration therapy market by decade’s end.
Europe’s trajectory is steadier: Germany, France, and the United Kingdom enforce tighter clinic licensing yet benefit from robust medical tourism flows that package drips with cosmetic surgery. Middle East & Africa use luxury hotels in Dubai and Doha as entry nodes; affluent travelers tack USD 250 drips onto spa itineraries, creating halo demand in local populations. South America, led by Brazil, shows promise but swings with currency volatility; franchisors adopt master-license models to hedge risk and seed brand recognition before macro conditions stabilize. Collectively, these regional dynamics produce a nuanced path where regulation, disposable income, and cultural attitudes dictate how the IV hydration therapy market unfolds country by country.

Competitive Landscape
The IV hydration therapy market remains fragmented; the top five brands collectively control well under 25% of global revenue, leaving ample white space for regionals and independents. Restore Hyper Wellness tops unit count at 225+ U.S. studios, leveraging USD 177 million in funding to roll out proprietary EMR and loyalty apps that shorten check-in to under three minutes. REVIV uses a royalty-light global master-franchise model spanning 47 countries, now super-charged by a 2025 investment from Cardone Ventures that adds a patented precision-genetics test to personalize drips. Prime IV Hydration, IV Nutrition, and Hydralive Therapy round out the franchisor cohort, targeting suburban strip malls where parking is plentiful and lease costs lower.
Technology vendors such as B. Braun and ICU Medical court providers with interoperable smart pumps that reduce programming errors by up to 90.5%, a patient-safety selling point that helps clinics negotiate malpractice premiums. In-house compounding labs gain traction to mitigate saline shortages while preserving sterility chains. Marketing wars shift to TikTok and Instagram Reels, with micro-influencers touting post-drip “glow” metrics that blur cosmetic and medical narratives—an approach regulators monitor closely. Strategic partnerships with coworking spaces, apartment communities, and airports extend reach, and successful pilots often mature into exclusivity agreements that block rivals from high-traffic nodes. Overall, the competitive field rewards agility: firms that master compliance, procurement, and consumer experience will outpace those relying on aesthetics alone within the IV hydration therapy market.
IV Hydration Therapy Industry Leaders
Reviv
Restore Hyper Wellness
Drip Hydration
Hydrate IV Bar
The IV Doc
- *Disclaimer: Major Players sorted in no particular order

Recent Industry Developments
- June 2025: Grant Cardone’s Cardone Ventures invested in REVIV Global to launch a patented Precision Nutrition System and genetics test curriculum.
- February 2025: XpresSpa opened a four-menu IV drip lounge inside Miami International Airport, signaling airports as high-margin real estate for the IV hydration therapy market.
- December 2024: Restore Hyper Wellness appointed Steve Welch CEO and expanded its C-suite to drive the next wave of franchise scaling.


Global IV Hydration Therapy Market Report Scope
| Electrolyte-Only Hydration |
| Vitamin Cocktails (e.g., Myers) |
| NAD? Therapy |
| Amino-Acid Blends |
| Custom Formulations |
| In-Clinic Medical Spas |
| Mobile / Concierge Services |
| Hospital-based Outpatient Centers |
| Home-Infusion Programs |
| Corporate / Hotel Partnerships |
| Wellness & Preventive Care |
| Athletic Performance & Recovery |
| Chronic Illness Support |
| Immunity Boost |
| Hangover & Detox Recovery |
| North America | United States |
| Canada | |
| Mexico | |
| Europe | Germany |
| United Kingdom | |
| France | |
| Italy | |
| Spain | |
| Rest of Europe | |
| Asia Pacific | China |
| Japan | |
| India | |
| South Korea | |
| Australia | |
| Rest of Asia Pacific | |
| Middle East & Africa | GCC |
| South Africa | |
| Rest of Middle East & Africa | |
| South America | Brazil |
| Argentina | |
| Rest of South America |
| By Infusion Type | Electrolyte-Only Hydration | |
| Vitamin Cocktails (e.g., Myers) | ||
| NAD? Therapy | ||
| Amino-Acid Blends | ||
| Custom Formulations | ||
| By Service Setting | In-Clinic Medical Spas | |
| Mobile / Concierge Services | ||
| Hospital-based Outpatient Centers | ||
| Home-Infusion Programs | ||
| Corporate / Hotel Partnerships | ||
| By Application | Wellness & Preventive Care | |
| Athletic Performance & Recovery | ||
| Chronic Illness Support | ||
| Immunity Boost | ||
| Hangover & Detox Recovery | ||
| By Geography | North America | United States |
| Canada | ||
| Mexico | ||
| Europe | Germany | |
| United Kingdom | ||
| France | ||
| Italy | ||
| Spain | ||
| Rest of Europe | ||
| Asia Pacific | China | |
| Japan | ||
| India | ||
| South Korea | ||
| Australia | ||
| Rest of Asia Pacific | ||
| Middle East & Africa | GCC | |
| South Africa | ||
| Rest of Middle East & Africa | ||
| South America | Brazil | |
| Argentina | ||
| Rest of South America | ||


Key Questions Answered in the Report
How large is the IV hydration therapy market in 2025?
The IV hydration therapy market size stands at USD 2.94 billion in 2025 and is projected to reach USD 4.60 billion by 2030.
Which infusion type is expanding the fastest?
NAD? drips are registering a 15.2% CAGR, outpacing all other formulations through 2030.
Why are mobile IV services gaining traction?
App-based nurse dispatch, lower overhead, and corporate wellness demand push the mobile channel to a 12.8% CAGR, the quickest within service settings.
Which region is growing fastest?
Asia Pacific posts the strongest regional CAGR at 9.3%, driven by urban professionals seeking productivity and wellness enhancements.
What new regulations affect providers in 2025?
Texas Jenifers Law, effective September 2025, requires physician oversight for elective drips and may serve as a template for other U.S. states.
How fragmented is competition?
With the top five players controlling under 25% of revenue, the market scores a 2 on the concentration scale, indicating high fragmentation yet ample room for consolidation.
Page last updated on:


