
Overactive Bladder Treatment Market Size and Share
Market Overview
| Study Period | 2020 - 2031 |
|---|---|
| Market Size (2026) | USD 4 Billion |
| Market Size (2031) | USD 4.72 Billion |
| Growth Rate (2026 - 2031) | 3.38 % |
| Fastest Growing Market | Asia Pacific |
| Largest Market | North America |
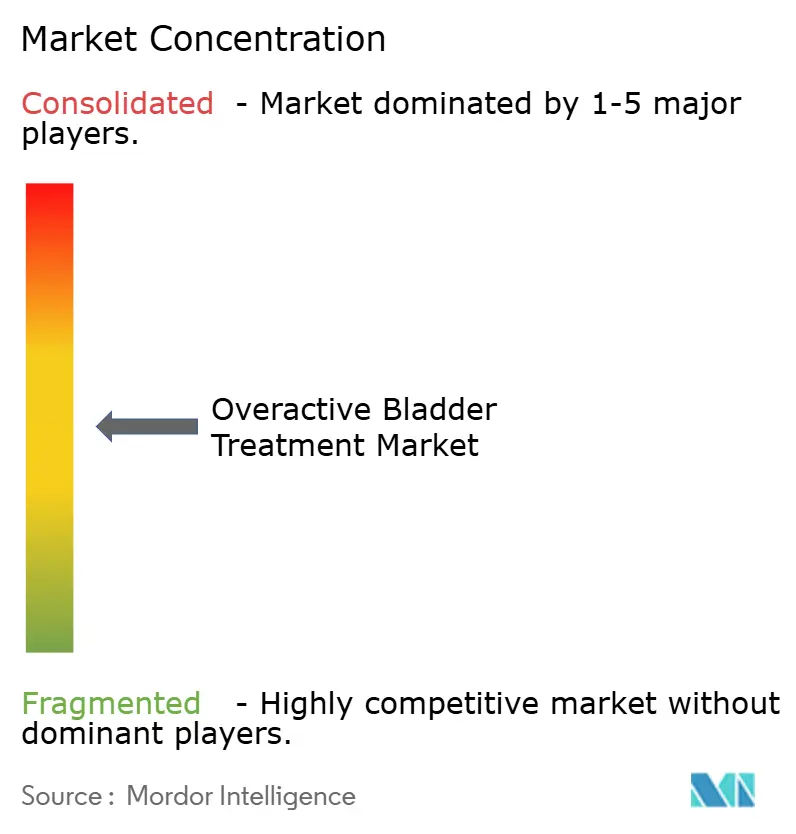
| Market Concentration | Medium |
Major Players *Disclaimer: Major Players sorted in no particular order Image © Mordor Intelligence. Reuse requires attribution under CC BY 4.0. | |
Overactive Bladder Treatment Market Analysis by Mordor Intelligence
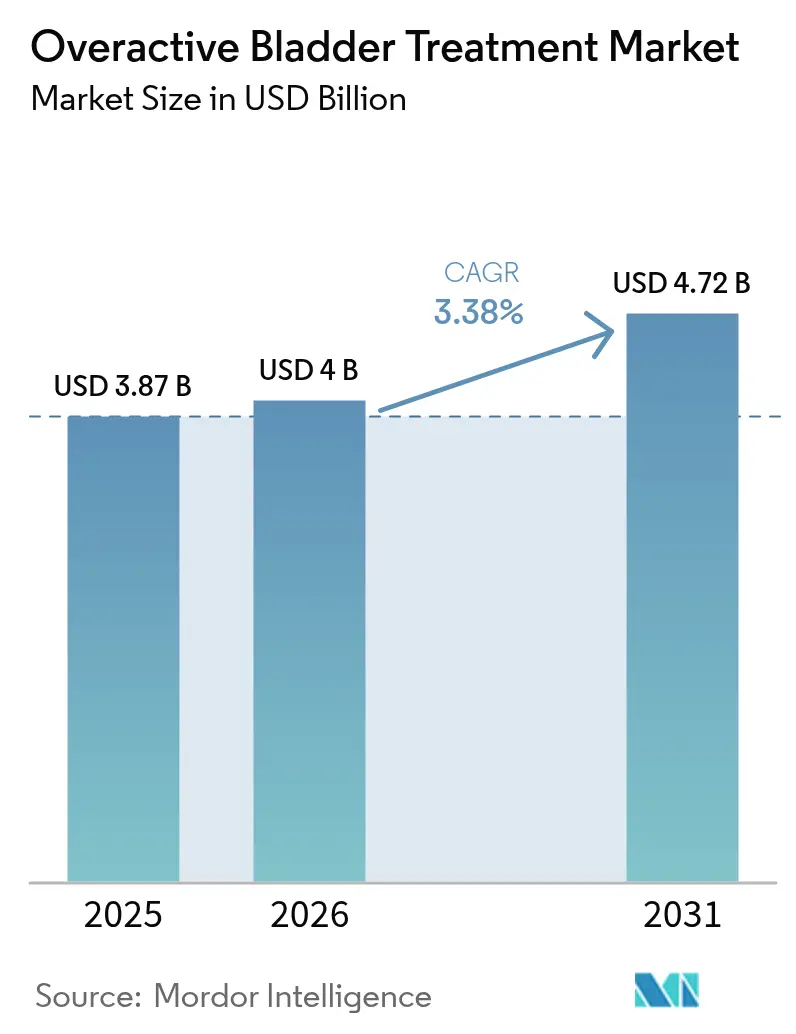
The overactive bladder treatment market size in 2026 is estimated at USD 4 billion, growing from 2025 value of USD 3.87 billion with 2031 projections showing USD 4.72 billion, growing at 3.38% CAGR over 2026-2031. Demand is sustained by population aging, the clinical shift toward β3-adrenergic agonists, and expanding device‐based options. Anticholinergics still provide scale advantages but face cognitive‐safety headwinds that accelerate prescribing changes. β3-agonists gain share on the back of new approvals, while reimbursement expansion for neuromodulation and botulinum toxin widens access to third-line care. Digital diagnostics further broaden reach, especially in regions with urologist shortages, and corporate consolidation is reshaping competitive dynamics in both pharma and devices.
Key Report Takeaways
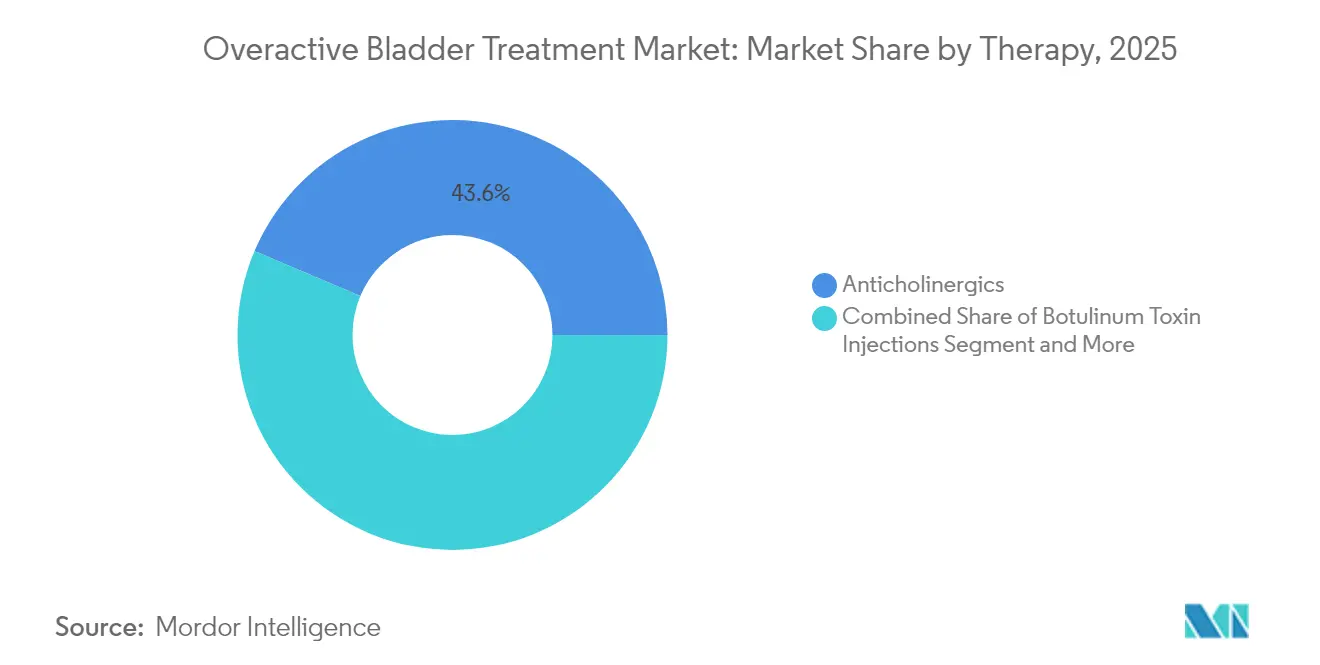
- By therapy class, anticholinergics led with 43.62% of overactive bladder treatment market share in 2025, whereas β3-agonists are projected to grow at 7.92% CAGR through 2031.
- By disease type, idiopathic cases generated 75.10% of 2025 revenue, while neurogenic cases are expanding at a 6.62% CAGR to 2031.
- By geography, North America commanded 38.55% revenue in 2025; Asia-Pacific is set to post the fastest 7.46% CAGR through 2031.
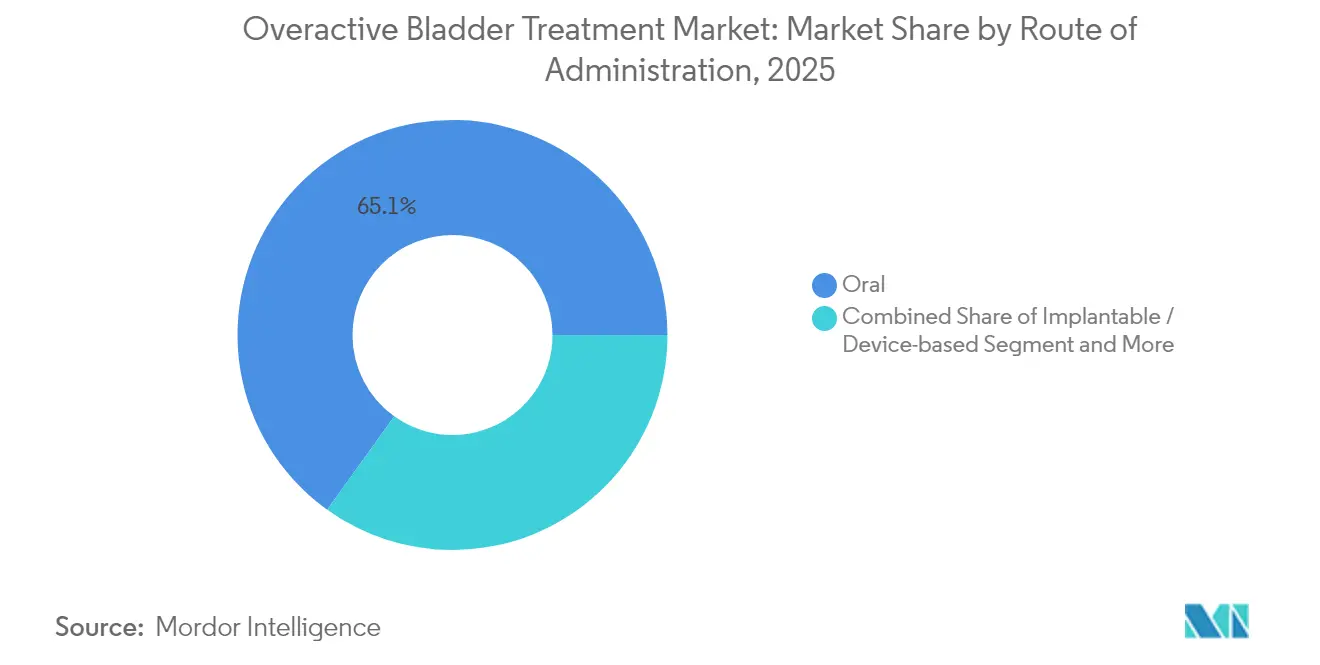
- By route of administration, oral therapies accounted for 65.10% of the 2025 overactive bladder treatment market size, while implantable devices are poised for a 9.08% CAGR.
- By end user, hospitals captured 53.40% revenue in 2025; homecare and telehealth services are advancing at 9.15% CAGR.
Note: Market size and forecast figures in this report are generated using Mordor Intelligence’s proprietary estimation framework, updated with the latest available data and insights as of 2026.
Global Overactive Bladder Treatment Market Trends and Insights
Drivers Impact Analysis*
| Driver | (~) % Impact on CAGR Forecast | Geographic Relevance | Impact Timeline |
|---|---|---|---|
| Aging Population & Rising Prevalence Of Urinary Disorders | +1.2% | Global, concentrated in North America & Europe | Long term (≥ 4 years) |
| Adoption Of β3-Adrenergic Agonists With Favorable Cognition Profile | +0.8% | North America & EU, expanding to Asia-Pacific | Medium term (2-4 years) |
| Expanding Reimbursement For Neuromodulation & Botox In Asia | +0.6% | Asia-Pacific core, spill-over to MEA | Medium term (2-4 years) |
| Growth In Tele-Urology & Digital Diagnostics | +0.4% | Global, early gains in North America | Short term (≤ 2 years) |
| AI-Assisted Discovery Accelerating Novel Small-Molecule Pipeline | +0.3% | Global, R&D centers in US & EU | Long term (≥ 4 years) |
| Clinical Validation Of Plant-Derived Anti-Muscarinic Compounds | +0.2% | Asia-Pacific, traditional medicine regions | Long term (≥ 4 years) |
| Source: Mordor Intelligence | |||
Aging Population & Rising Prevalence of Urinary Disorders
People aged 65 years and older experience overactive bladder prevalence above 30%, compared with 16-18% in general adult cohorts. In Japan, roughly 12.4 million adults require symptom management, prompting payers to prioritize cost-effective care models. Similar demographic shifts in China, South Korea, and European countries enlarge the overactive bladder treatment market while encouraging health-system investment in urological capacity. As national insurance schemes expand to cover continence services, demand for pharmacologic and device-based therapies rises across all economic strata.
Adoption of β3-Adrenergic Agonists With Favorable Cognition Profile
Long-term studies link oxybutynin to a 12% higher dementia risk in women older than 65, accelerating clinician pivot toward β3-agonists. A 1.49-million-participant Japanese cohort confirmed lower cognitive risk with mirabegron and vibegron. The December 2024 FDA approval of vibegron for men with benign prostatic hyperplasia-related symptoms opens a new addressable population and reinforces the safety narrative.
Expanding Reimbursement for Neuromodulation & Botulinum Toxin in Asia
Taiwan and South Korea recently broadened coverage criteria, elevating mirabegron adherence to 68.5% versus 60.4% for antimuscarinics[1]J. Chen et al., “Treatment Patterns With Mirabegron and Antimuscarinics for Overactive Bladder,” link.springer.com. Medicare’s structured pathway in the United States—requiring conservative failure before 100-unit botulinum toxin dosing—serves as a template for Asian payers. These moves increase device penetration and stimulate regional supplier investment.
Growth in Tele-Urology & Digital Diagnostics
AI algorithms now deliver 97% concordance with manual bladder scans and 100% specificity for elevated post-void residuals. Remote monitoring platforms bridge specialist gaps in rural zones, reduce appointment backlogs, and sustain therapy adherence among older adults. Precision-based dosing adjustments via telehealth improve outcomes and trim hospital visits, expanding the overactive bladder treatment market without proportionate infrastructure costs.
Restraints Impact Analysis*
| Restraint | (~) % Impact on CAGR Forecast | Geographic Relevance | Impact Timeline |
|---|---|---|---|
| Cognitive Safety Concerns Of Chronic Anticholinergic Use | -0.9% | Global, acute in aging populations | Medium term (2-4 years) |
| Patent Cliffs For Leading Antimuscarinics Dampening R&D Spend | -0.7% | Global, concentrated in developed markets | Short term (≤ 2 years) |
| Limited Urologist Density In Low-Income Regions | -0.5% | Sub-Saharan Africa, rural Asia, Latin America | Long term (≥ 4 years) |
| Fragmented Payer Coverage For β3-Agonists In US & EU | -0.4% | North America & EU, insurance-dependent | Medium term (2-4 years) |
| Source: Mordor Intelligence | |||
Cognitive Safety Concerns of Chronic Anticholinergic Use
A Korean national cohort revealed increased dementia incidence with anticholinergics versus β3-agonists, triggering formulary re-ranking across insurance plans. U.S. Medicare now favors cognitive-sparing options, constraining legacy drug volumes while directing investment toward novel mechanisms. Clinicians adopt shared-decision tools that weigh symptom relief against cognitive risk, slowing anticholinergic unit sales.
Patent Cliffs for Leading Antimuscarinics Dampening R&D Spend
Generic erosion has cut cash flows for first-generation molecules, leading Sumitomo Pharma to reduce its U.S. workforce by 400 employees in 2024[2]Sumitomo Pharma Co., “Reduction of Workforce and Other Rationalization Measures,” sumitomo-pharma.com. Budget reallocation toward β3-agonists and combination regimens leaves fewer resources for incremental anticholinergic innovation, narrowing the near-term development slate and affecting overactive bladder treatment industry pipelines.
*Our forecasts treat driver/restraint impacts as directional, not additive. The impact forecasts reflect baseline growth, mix effects, and variable interactions.
Segment Analysis
By Therapy: β3-Agonists Challenge Anticholinergic Dominance
The overactive bladder treatment market size for anticholinergics reached USD 1.69 billion in 2025, equal to 43.62% of total revenue. Cost advantage and guideline familiarity sustain their lead, yet mounting cognitive concerns restrain growth. β3-agonists captured 23.45% in 2025 and are forecast to expand at an 7.92% CAGR, outpacing all other modalities. Vibegron’s new indication for men with benign prostatic hyperplasia underpins this surge, while mirabegron’s long-term data reinforce safety perceptions. Botulinum toxin retains niche status but boasts 74.5% complete pad discontinuation over 15 years, attracting refractory cases. Boston Scientific’s 2024 purchase of Axonics intensifies competition in sacral neuromodulation, promising next-generation lead technology and rechargeable IPGs that lengthen device life cycles.
Clinical practice increasingly trials hybrid protocols—such as duloxetine-tolterodine—returning 77.4% patient satisfaction in mixed incontinence cohorts. Plant-derived candidates, including rhynchophylline, enter exploratory trials focused on M3 receptor modulation, adding a low-cost innovation layer. As patent cliffs depress traditional R&D spend, alliances between digital diagnostic firms and pharma players accelerate patient identification, amplifying therapy uptake across the overactive bladder treatment market.



By Disease Type: Neurogenic Cases Drive Disproportionate Growth
Idiopathic presentations generated USD 2.91 billion in 2025, translating to a 75.10% share within the overactive bladder treatment market. Streamlined work-ups and primary-care familiarity underpin consistent demand. Neurogenic cases, valued at USD 0.96 billion in 2025, will grow 6.62% annually through 2031, fueled by heightened surveillance in spinal cord injury, Parkinson’s disease, and multiple sclerosis populations. Ultrasound-guided botulinum toxin injections reduce procedural risks, broadening provider adoption. Premium pricing for device-based regimens and complex pharmacologic formulations offsets smaller volumes, lifting revenue per patient and improving manufacturer margins.
Policy makers note that aggressive neurogenic management curbs urinary tract infections and renal complications, generating downstream savings. These economic arguments help justify payer coverage for high-ticket interventions such as sacral and tibial nerve stimulation, fortifying the neurogenic revenue pool in the overactive bladder treatment market.
By Route of Administration: Device Innovation Challenges Oral Dominance
Oral agents generated USD 2.52 billion in 2025, controlling 65.10% of the overactive bladder treatment market size. Once-daily β3-agonists reinforce adherence, and widespread generic anticholinergics keep entry costs low in developing health systems. Nevertheless, implantable neuromodulation devices are set for a 9.08% CAGR, aided by single-incision techniques and improved MRI compatibility. Boston Scientific’s USD 3.7 billion Axonics acquisition consolidates engineering talent, potentially shortening product cycles. Transdermal patches supply a non-invasive alternative for patients with swallowing difficulties, though pricing still limits uptake.
Botulinum toxin remains injection-based yet enjoys expanding reimbursement and streamlined prior authorization protocols. Together, minimally invasive devices and injectables chip away at oral primacy, diversifying revenue sources across the overactive bladder treatment market.
By End User: Homecare Adoption Accelerates Through Digital Health
Hospitals delivered 53.40% of 2025 sales, reflecting concentration of invasive procedures and complex diagnostics. Specialist centers with full urodynamic labs facilitate accurate subtype stratification and immediate therapy initiation. Tele-urology has emerged as a viable extension, leveraging AI ultrasound to transmit bladder metrics with 97% accuracy to remote clinicians. Home-based adherence apps remind patients to take β3-agonists and track symptom diaries, elevating persistence rates.
Homecare and virtual platforms are forecast to post a 9.15% CAGR, supported by payer incentives that counter costly emergency admissions for incontinence-related falls. Specialty clinics bridge the gap by offering tailored sessions for pelvic-floor training and on-site botulinum toxin injections, expanding choice within the overactive bladder treatment industry’s delivery ecosystem.
Geography Analysis
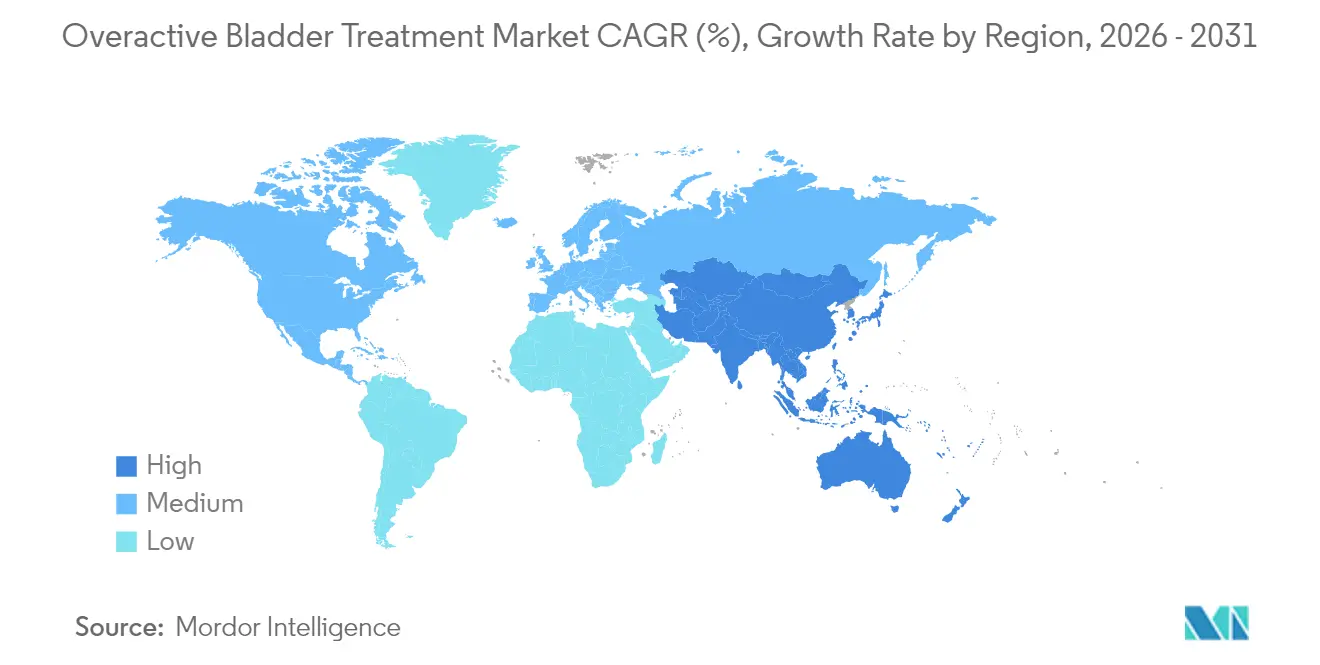
North America produced USD 1.49 billion in 2025, equivalent to 38.55% of the overactive bladder treatment market. Robust insurance coverage and early uptake of β3-agonists sustain revenue, while Medicare’s clear algorithms for neuromodulation keep device channels healthy. Hospital system consolidation encourages formulary leverage, ensuring rapid deployment of new cognitive-sparing molecules once licensed.
Europe contributed USD 1.12 billion in 2025, buttressed by the July 2024 pan-EU authorization for vibegron. Harmonized labeling streamlines launch costs and unifies pharmacovigilance reporting. National health services, particularly in Germany and the Nordics, pilot bundled payments that reward longitudinal symptom control, benefiting device makers.
Asia-Pacific, valued at USD 0.89 billion in 2025, is on track for a 7.46% CAGR to 2031, the fastest expansion among all regions. Japan’s advanced aging profile and clinical trial infrastructure elevate guideline compliance, while Taiwan and South Korea report 68.5% persistence on mirabegron versus 60.4% for antimuscarinics. China and India ramp diagnostic capacity through public-private partnerships, framing overactive bladder as a treatable disorder rather than a normal aging outcome. Improved device reimbursement and local manufacturing hubs shrink acquisition costs, deepening penetration of neuromodulation platforms within the overactive bladder treatment market.

Competitive Landscape
Boston Scientific closed its USD 3.7 billion purchase of Axonics in November 2024, forging a neuromodulation powerhouse and igniting patent clashes with Medtronic over MRI-safe components. The alignment of sacral and tibial stimulation assets under one roof grants Boston Scientific broad procedural coverage, pressuring smaller entrants to locate untapped niches such as closed-loop systems.
Pharmaceutical competition pivots on cognitive safety. Sumitomo Pharma centers growth plans on vibegron, even as generic erosion in other franchises prompts workforce reductions. U.S. and EU payers respond by reevaluating formulary tiers: plans uplift β3-agonists and restrict high-risk anticholinergics to second-line status, swaying prescription patterns across the overactive bladder treatment market.
Venture funding favors convergence themes: Amber Therapeutics raised USD 100 million for adaptive neuromodulation that syncs device output with real-time bladder signals, and multiple AI firms partner with pharma to accelerate molecule discovery. Competition therefore hinges on an integrated proposition—safe drug, smart device, and data-driven follow-up—rather than isolated product advantages, reshaping standard-of-care pathways throughout the overactive bladder treatment industry.
Overactive Bladder Treatment Industry Leaders
Medtronic PLC
Astellas Pharma, Inc.
Macleods Pharmaceuticals Ltd
Pfizer, Inc
AbbVie Ltd.
- *Disclaimer: Major Players sorted in no particular order

Market Opportunities and Future Outlook
The clearest commercial whitespace sits between second-line oral therapy and third-line procedures, where cognitive-sparing pharmacotherapy and earlier escalation pathways are reshaping care models. Regulatory and access tailwinds for vibegron expand the addressable pool across major markets, including the European Commission centralized authorization (July 2024) and the US FDA indication expansion for GEMTESA (vibegron) in men receiving pharmacological therapy for benign prostatic hyperplasia (December 2024); the UK MHRA also granted marketing authorisation for vibegron (Obgemsa) in 2024. These steps support broader use of beta-3 agonists in older cohorts facing anticholinergic cognitive-safety headwinds and create room for differentiated payer strategies around persistence, dosing simplicity, and step-therapy sequencing.
Device and procedure pathways are also expanding beyond specialist bottlenecks through evidence-building and reimbursement broadening, particularly for neuromodulation and botulinum toxin access. Medtronic advancing post-approval evidence for implantable tibial neuromodulation (Altaviva) and Boston Scientific integrating Axonics into a scaled neuromodulation platform highlight intensified competition around minimally invasive options, improved MRI compatibility, and therapy monitoring. Adjacent innovation adds longer-horizon opportunity: localized gene therapy approaches such as URO-902 (pVAX/hSlo) and interventional approaches like detrusor nerve radiofrequency ablation (ClinicalTrials.gov NCT07209397) signal new mechanism and delivery routes aimed at refractory patients. Digital health is moving from concept to clinical validation, with published results on the INKA mobile application (2026) supporting potential adjunctive pathways for therapy-refractory overactive bladder and mixed incontinence, aligning with health systems using tele-urology to extend capacity where urologist density is limited.
Recent Industry Developments
- April 2026: Medtronic enrolled the first patient in the ENDURANCE post-approval study for the Altaviva implantable tibial neuromodulation device indicated for urge urinary incontinence. Advancing post-market evidence supports physician confidence, payer discussions, and protocol refinement for tibial neuromodulation within third-line overactive bladder pathways.
- September 2025: Medtronic secured US FDA approval for the Altaviva device, positioned as an implantable tibial neuromodulation option for treating urge urinary incontinence. The approval broadened the competitive set in neuromodulation beyond sacral stimulation and strengthened device-based alternatives to chronic oral therapy.
- December 2024: The US FDA approved GEMTESA (vibegron) for men with overactive bladder symptoms receiving pharmacological therapy for benign prostatic hyperplasia. This indication expansion opened a defined new prescribing segment for beta-3 agonists and reinforced the class shift toward cognitive-sparing therapies.


Research Methodology Framework and Report Scope
Market Definition and Coverage
This market covers revenues generated from treating overactive bladder, where urgency and frequent urination are managed using prescription drugs, botulinum toxin injections, and procedure-based neuromodulation therapies delivered in clinical settings.
Scope exclusions: Non-therapeutic absorbent hygiene products, such as incontinence pads and liners, are excluded to avoid double counting with consumer hygiene categories.
Segmentation Overview
- By Therapy
- Anticholinergics
- Beta-3-Adrenergic Agonists
- Botulinum Toxin Injections
- Neuromodulation & Sacral Stimulation
- Intravesical Instillation
- Combination Therapy
- Herbal & Nutraceuticals
- Other Emerging Therapies
- By Disease Type
- Idiopathic Overactive Bladder
- Neurogenic Overactive Bladder
- By Route of Administration
- Oral
- Transdermal
- Injectable
- Implantable / Device-based
- By End User
- Hospitals
- Specialty Clinics & Urology Centers
- Homecare & Telehealth
- Geography
- North America
- United States
- Canada
- Mexico
- Europe
- Germany
- United Kingdom
- France
- Italy
- Spain
- Rest of Europe
- Asia-Pacific
- China
- Japan
- India
- South Korea
- Australia
- Rest of Asia-Pacific
- Middle East and Africa
- GCC
- South Africa
- Rest of Middle East and Africa
- South America
- Brazil
- Argentina
- Rest of South America
- North America
Data Sources, Market Sizing, and Validation
Desk Research
Desk research starts by building the demand pool and treatment pathway using public sources that can be checked again later. We typically refer to sources such as the US CDC and NIH for population and condition context, OECD health statistics for system-level benchmarks, and WHO and World Bank datasets for macro health and demographic baselines.
To keep assumptions realistic, supporting signals are pulled from peer-reviewed urology journals, regulatory and safety information from agencies such as the US FDA, and open trade and customs statistics where relevant for device shipment directional checks. Company annual reports, earnings decks, and reputable press are then used to understand product mix, launch timing, and geographic exposure, with limited use of paid databases for company financials and patent databases to validate pipeline and innovation activity. The sources listed here are illustrative, and many other public references were used to collect data, validate assumptions, and clarify open questions.
Primary Interviews and Surveys
Primary work is used to test what desk research cannot fully answer, especially real-world treatment sequencing, patient persistence, and pricing movement by country. We interview a mix of prescribers, hospital and clinic administrators, payers, distributors, and device-focused practitioners across major regions so regional reimbursement and access differences are reflected in the final model.
Distribution of primary research fieldwork respondents
| Company type | Respondent position | Region |
|---|---|---|
| Top tier: 25% | CXOs: 18% | APAC: 44% |
| Mid tier: 55% | Functional/Unit leaders: 35% | EMEA: 33% |
| Smaller Players: 20% | Managers: 47% | Americas: 23% |
Market-Sizing & Forecasting
Sizing starts with a top-down demand build that uses epidemiology and care-seeking logic to reconstruct the treated population, then applies treatment-share and price layers to convert it into revenue. For overactive bladder, key inputs include adult population by age band, estimated OAB prevalence split between idiopathic and neurogenic cases, diagnosis and treatment-seeking rates, third-line adoption indicators for botulinum toxin and neuromodulation, and typical annual therapy cost ranges by country.
Those totals are pressure-tested with selective bottom-up approximations, such as sampled pricing checks, channel feedback on therapy uptake, and supplier-side sanity checks on device procedure volumes where information is available. When local gaps exist, nearby country analogs are used and then adjusted using healthcare spend and access indicators so the numbers do not drift.
For forecasting, we use scenario analysis supported by regression-style relationships between aging, access expansion, and therapy mix shift, and then review the outputs with experts before finalizing year-by-year growth assumptions.
Data Validation & Update Cycle
Validation is done through multiple passes so unusual results get surfaced early. We compare outputs against independent signals such as procedure adoption trends, published clinical guideline shifts, and observable reimbursement or formulary changes, then investigate variances before sign off.
A second analyst review is completed for logic consistency, unit checks, and currency conversions, followed by targeted re-contact with respondents when a material mismatch is seen. The report is refreshed annually, and interim updates are made when major approvals, safety actions, or reimbursement changes meaningfully alter the demand pool. Before delivery, the model is rechecked so the latest available public information is reflected in the final numbers.
Mordor Intelligence's Overactive Bladder Treatment Market Sizing Compared With Other Published Estimates
Published market values for overactive bladder treatment can look different because firms do not always count the same treatment set, the same patient pool, or the same year of price and utilization inputs. Differences also show up when one estimate leans more on a single base year and then extrapolates forward without enough checkpoints.
The spread is usually driven by whether device-based neuromodulation and botulinum toxin revenues are fully included, whether the patient pool mixes idiopathic and neurogenic OAB in the same way, and how therapy prices are converted across currencies and updated for post launch changes. Another common reason is the refresh cadence, since new access decisions and guideline-driven switching can shift shares before the next published update, which is handled through a defined inclusion rule set and annual model refresh by Mordor Intelligence.
Benchmark comparison
| Source | Market Size | Gaps in Research Methodology |
|---|---|---|
| Mordor Intelligence | USD 4.00 B (2026) | |
| Industry Research Publisher A | USD 3.84 B (2024) | Uses an earlier base year and can under represent third line therapy value if procedure based neuromodulation and injection use are not fully normalized across countries, which shifts the total downward versus a treated patient pathway build. |
| Industry Research Publisher B | USD 3.79 B (2023) | Anchors on a historical year and may apply faster forward growth from a broader therapy basket, where assumptions on uptake and price progression are not consistently checked against diagnosis, persistence, and access constraints. |
Overall, the table shows that scope and timing drive most of the gap, not just math. When the treated population, third line adoption, and currency timing are written out step by step, the final value becomes easier to audit and repeat across updates, which is what keeps the estimate stable when new evidence arrives.


Key Questions Answered in the Report
What is the current size of the global overactive bladder treatment market and how fast is it growing?
The market is valued at USD 4 billion in 2026 and is projected to reach USD 4.72 billion by 2031, advancing at a 3.38% CAGR.
Which therapy class is expanding the fastest?
Β3-adrenergic agonists are the fastest-growing class, expected to post an 7.92% CAGR through 2031 due to their favorable cognitive safety profile and new indication approvals.
Where is regional growth most pronounced?
Asia-Pacific is forecast to achieve the quickest expansion at a 7.46% CAGR, driven by aging populations, broader reimbursement, and improving healthcare infrastructure.
How are device-based treatments impacting the market?
Implantable neuromodulation systems and other devices are projected to grow at a 9.08% CAGR, challenging oral therapy dominance and attracting investment after major acquisitions.
What key factor is reshaping prescribing patterns for anticholinergics?
Large-scale studies linking chronic anticholinergic use to increased dementia risk are shifting clinicians toward cognitive-sparing alternatives such as β3-agonists.
Page last updated on:


 Your data is secure and never sold or shared.


