Market Overview
| Study Period | 2020 - 2031 |
|---|---|
| Market Size (2026) | USD 39.87 Billion |
| Market Size (2031) | USD 91.94 Billion |
| Growth Rate (2026 - 2031) | 18.19% CAGR |
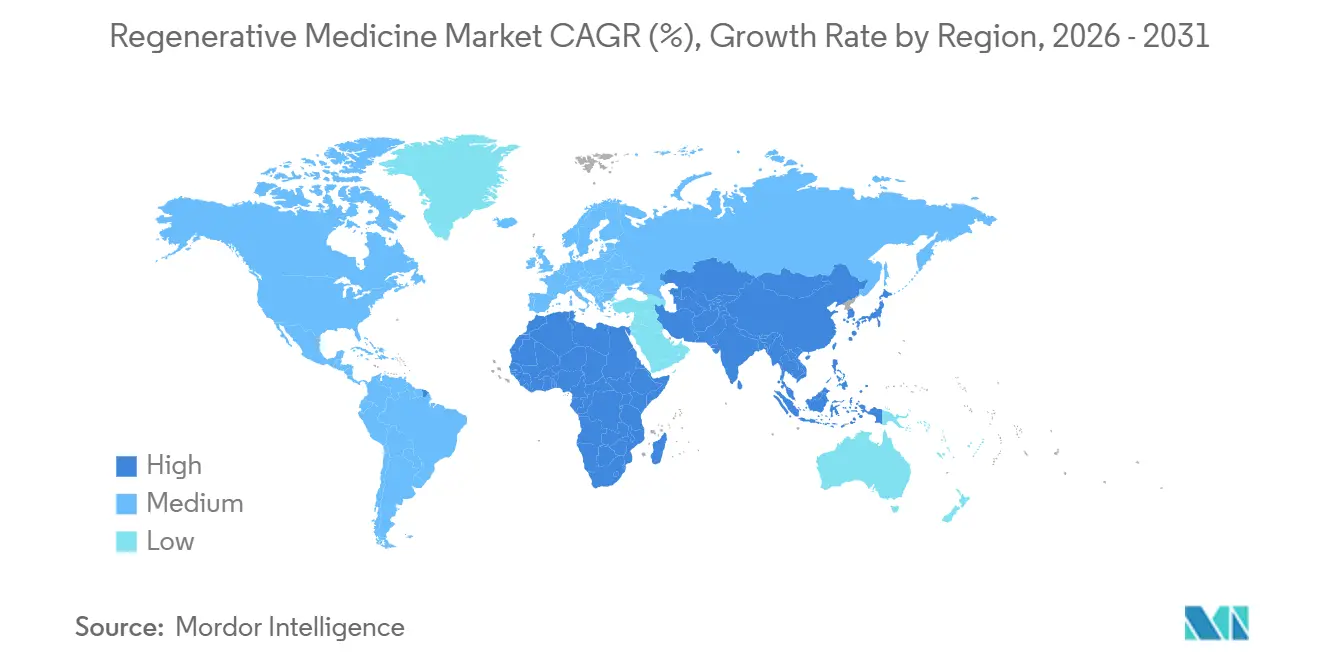
| Fastest Growing Market | Asia Pacific |
| Largest Market | North America |
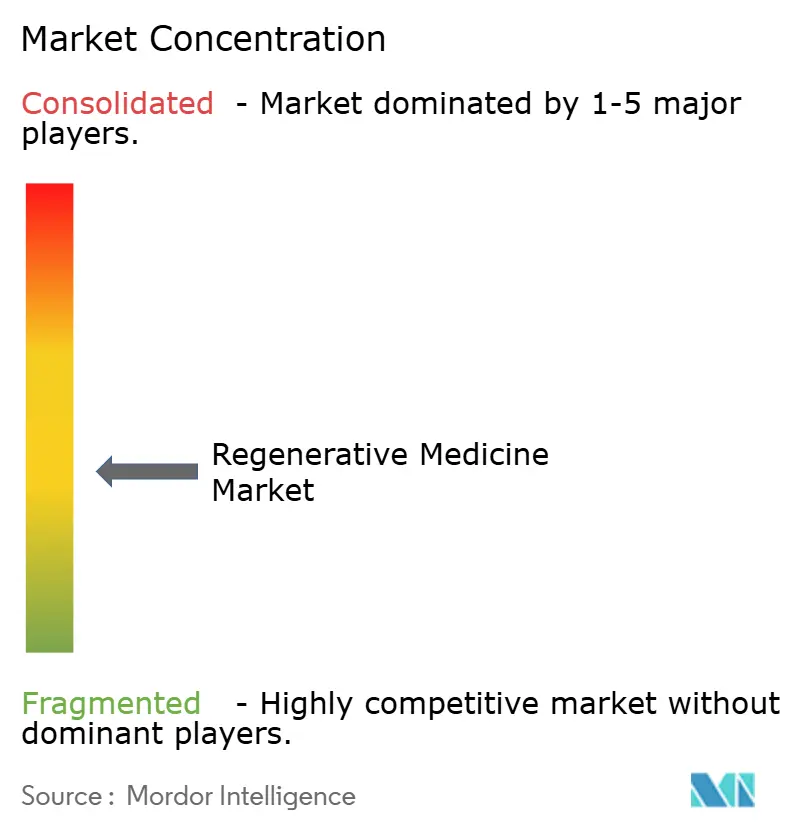
| Market Concentration | Medium |
Major Players *Disclaimer: Major Players sorted in no particular order Image © Mordor Intelligence. Reuse requires attribution under CC BY 4.0. | |
Regenerative Medicine Market Analysis by Mordor Intelligence
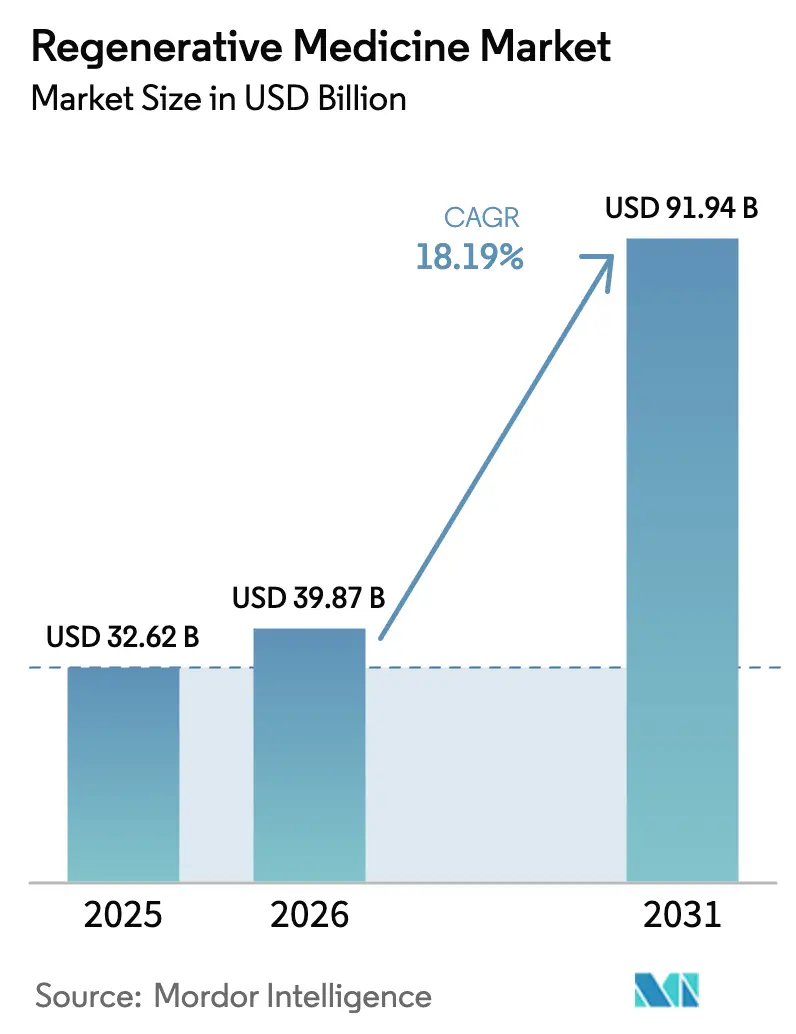
The Regenerative Medicine Market size is projected to be USD 32.62 billion in 2025, USD 39.87 billion in 2026, and reach USD 91.94 billion by 2031, growing at a CAGR of 18.19% from 2026 to 2031.
This brisk trajectory indicates that investors are shifting capital from symptomatic care toward curative technologies, a trend reinforced by eight cell- and gene-therapy approvals in 2024 and by manufacturing advances that have reduced the cost of goods by 30-40% in early commercial programs. Regulatory agencies in the United States, Europe, and China now clear late-stage candidates within 12-18 months, compared with the decade-long timelines typical only five years ago. Contract manufacturers are responding with continuous-perfusion processes that quadruple viral-vector titers and portable bioreactors that enable same-week autologous dosing, together lifting the regenerative medicine market’s addressable patient pool. Competitive intensity remains high because intellectual property moats surrounding AAV capsid design and iPSC differentiation protocols continue to fragment the supply chain, encouraging both vertical integration and cross-licensing deals among large developers and specialty suppliers.
Key Report Takeaways
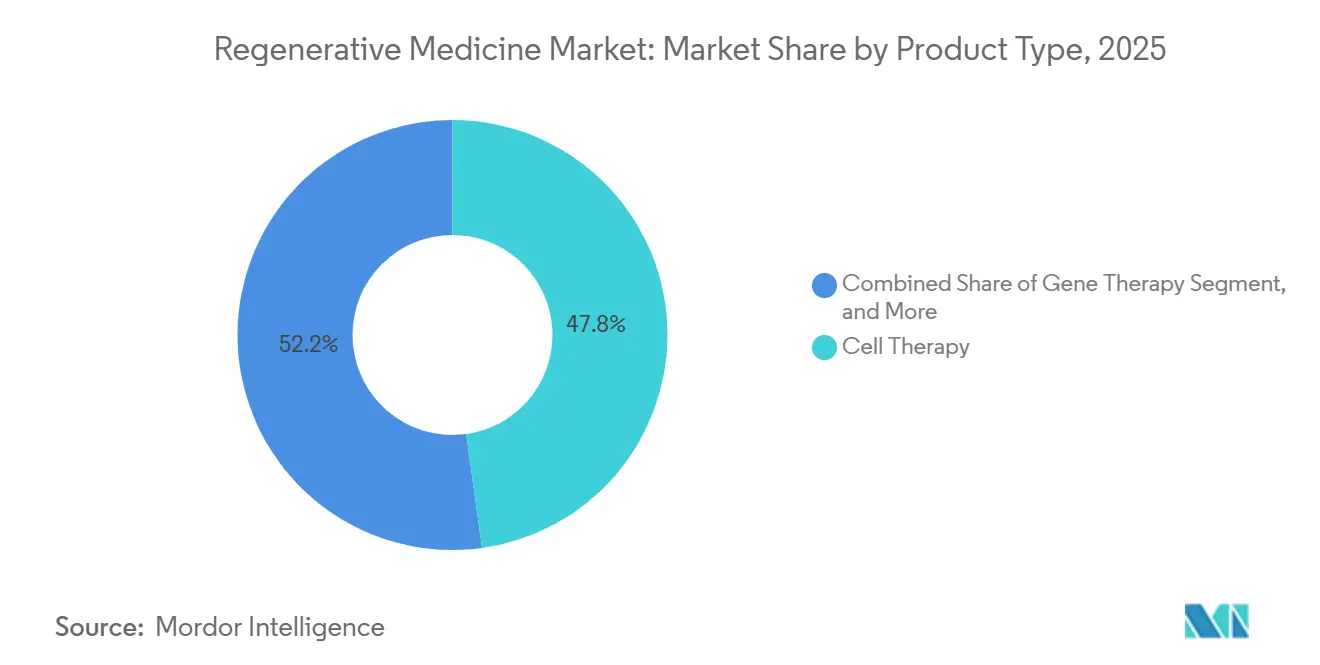
- By product type, cell therapy held 47.81% of the regenerative medicine market share in 2025, while gene therapy is projected to expand at a 20.73% CAGR through 2031.
- By therapeutic area, oncology commanded 34.52% of 2025 revenue, and neurology is advancing at a 22.08% CAGR.
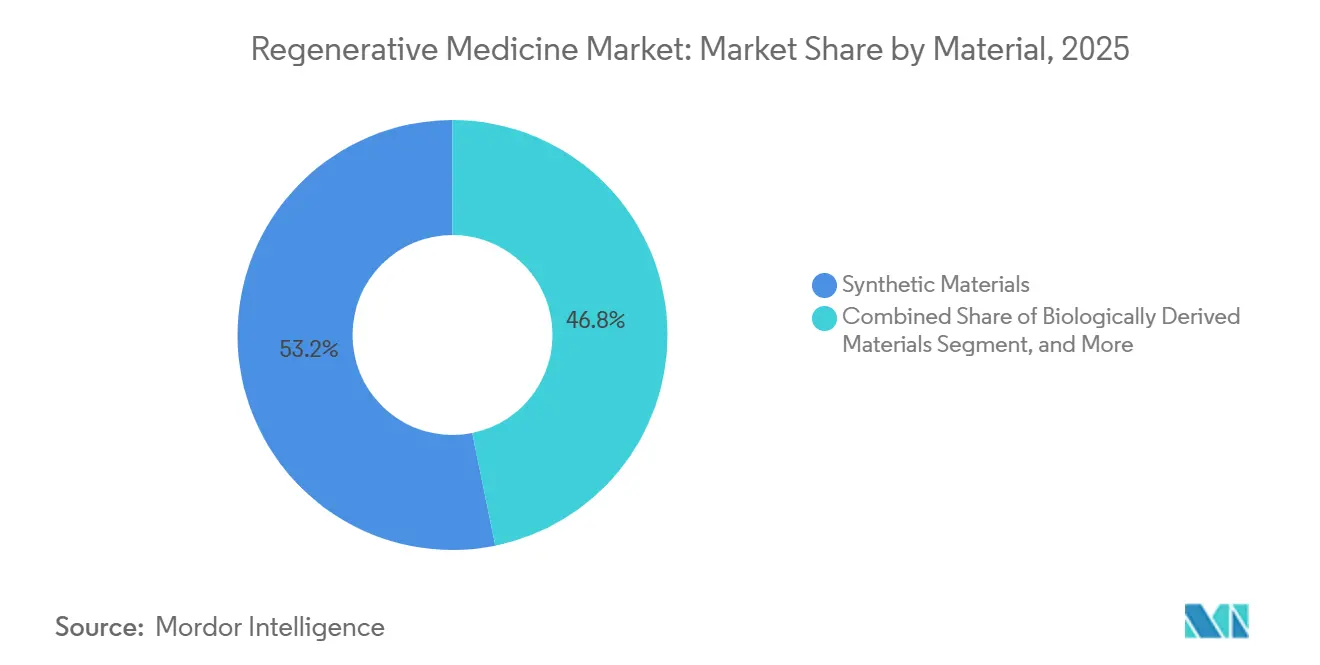
- By material, synthetic materials led with 53.18% share in 2025, whereas genetically engineered materials are forecast to grow at an 18.12% CAGR.
- By end user, hospitals retained a 52.36% share in 2025, and specialty clinics are set to grow at a 21.76% CAGR to 2031.
- By geography, North America contributed 44.16% of the 2025 revenue, and the Asia-Pacific region is poised for a 23.76% CAGR.
Note: Market size and forecast figures in this report are generated using Mordor Intelligence’s proprietary estimation framework, updated with the latest available data and insights as of January 2026.
Global Regenerative Medicine Market Trends and Insights
Drivers Impact Analysis*
| Driver | (~) % Impact on CAGR Forecast | Geographic Relevance | Impact Timeline |
|---|---|---|---|
| Rising Chronic Disease Burden | +3.2% | Global, with acute pressure in North America and Europe | Long term (≥ 4 years) |
| Accelerating Approvals & Reimbursement of Cell/Gene Therapies | +4.5% | North America, Europe, Asia-Pacific (China, Japan) | Medium term (2-4 years) |
| Advances in Stem-Cell Bioprocessing Scalability | +2.8% | Global, concentrated in North America and Asia-Pacific manufacturing hubs | Medium term (2-4 years) |
| AI-Enabled Closed-System Manufacturing Cuts Cost of Goods | +3.1% | North America, Europe, emerging in Asia-Pacific | Short term (≤ 2 years) |
| Regulatory Sandboxes Attracting FDI | +2.3% | Asia-Pacific (Singapore, UAE), United Kingdom | Medium term (2-4 years) |
| Battlefield Bioprinting Spin-Offs for Civilian Trauma Care | +1.4% | North America, spill-over to Europe and Middle East | Long term (≥ 4 years) |
| Source: Mordor Intelligence | |||
Rising Chronic Disease Burden
Non-communicable diseases caused 43 million deaths worldwide in 2021, and diabetes prevalence rose 16% to 537 million adults by 2024, prompting payers to prioritize therapies that regenerate beta-cell function over lifelong insulin dependence. Musculoskeletal disorders are projected to impair 78 million U.S. adults by 2030, opening a USD 12 billion annual opportunity for cartilage-repair products that can defer joint-replacement surgery.[1]Centers for Disease Control and Prevention, “Arthritis Data and Statistics,” cdc.gov Hematologic malignancies illustrate the shift: five-year overall survival for diffuse large B-cell lymphoma surpassed 50% with CAR-T, compared with 15% on salvage chemotherapy, enlarging the patient cohort eligible for successive regenerative interventions. Cardiovascular programs trail oncology in revenue but demonstrated a 37% reduction in major adverse events after allogeneic mesenchymal stem-cell infusion, suggesting a move toward curative adjuncts to ventricular-assist devices. As populations age and multimorbidity increases, demand for durable, one-time treatments underpins the growth trajectory of the regenerative medicine market.
Accelerating Approvals & Reimbursement of Cell/Gene Therapies
The U.S. FDA cleared eight regenerative medicine advanced therapies in 2024, including the first solid-tumor CAR-T therapy for synovial sarcoma. Meanwhile, the European Medicines Agency granted conditional approval for the first ex vivo therapy for metachromatic leukodystrophy that same year.[2]European Medicines Agency, “First Gene Therapy to Treat Metachromatic Leukodystrophy,” ema.europa.eu CMS expanded National Coverage Determination 110.23 to include allogeneic stem cell transplants for myelodysplastic syndrome, adding approximately 15,000 Medicare beneficiaries and USD 450 million in annual reimbursement. A new Transitional Coverage for Emerging Technologies rule promises provisional Medicare payment within six months of FDA clearance, compressing the commercialization gap that once slowed uptake. Thirty-five state Medicaid programs now pool risk under the Cell and Gene Therapy Access Model, collectively funding treatments priced above USD 2 million for the treatment of sickle-cell disease. China’s regulator approved six domestic CAR-T products in 2024, priced 60% below Western benchmarks, catalyzing adoption across 18 provincial hospitals.
Advances in Stem-Cell Bioprocessing Scalability
AI-optimized upstream workflows introduced by WuXi Biologics increased monoclonal antibody titers by 26.8%. They showed similar gains in mesenchymal stem-cell suspensions, while Lonza’s Houston site quadrupled AAV output via continuous perfusion, driving dose costs from USD 450,000 to USD 120,000.[3]Lonza Group, “Lonza Expands Houston Viral Vector Facility,” lonza.com A microfluidic bioreactor, published in 2024, expanded CAR-T cells ten times faster than gas-permeable bags, enabling same-week dosing and reducing capital needs for manufacturing suites. The FDA’s BioFoundry initiative aims for 90% reproducibility in iPSC differentiation across 12 partner laboratories by 2027, a milestone expected to trim regulatory submission timelines by 18 months. Japan earmarked JPY 15 billion in 2024 to scale up iPSC-derived cardiomyocytes to 500,000 doses per year by 2028, signaling a government commitment to industrial-scale production. Together, these breakthroughs unlock clinical assets worth an estimated USD 8 billion that had stalled due to a lack of capacity.
AI-Enabled Closed-System Manufacturing Cuts Cost of Goods
Machine-learning models embedded in the BioFoundry project predict transfection parameters that previously required months of manual trial, reducing development cycles from 24 months to nine and cutting material waste by 35%. WuXi’s Smart Lab tracks 1.2 million data points per batch, adjusting dissolved oxygen and pH in real time to eliminate 70% of manual interventions. Closed-system units from Sartorius shield cultures from contamination that historically scrapped up to 12% of cell-therapy lots, saving USD 1.2 million per failure. A 2024 Nature Biotechnology study calculated that AI-guided CAR-T expansion reduced the cost of goods from USD 250,000 to USD 85,000 per patient dose by halving the culture time. Lower production costs enable broader outcome-based pricing where payers only reimburse if predefined clinical milestones are met; a model already adopted by 22 U.S. health systems.
Restraints Impact Analysis*
| Restraint | (~) % Impact on CAGR Forecast | Geographic Relevance | Impact Timeline |
|---|---|---|---|
| High Therapy Cost & Limited Payer Coverage | -2.8% | Global, acute in emerging markets (Latin America, Middle East, Africa) | Short term (≤ 2 years) |
| Multi-Jurisdiction Regulatory Complexity | -1.6% | Global, particularly Europe and Asia-Pacific | Medium term (2-4 years) |
| Viral-Vector Supply Bottlenecks | -2.1% | Global, concentrated impact in North America and Europe | Short term (≤ 2 years) |
| Non-Biologic Molecular Alternatives Shrinking Addressable TAM | -1.9% | North America, Europe, emerging in Asia-Pacific | Long term (≥ 4 years) |
| Source: Mordor Intelligence | |||
High Therapy Cost & Limited Payer Coverage
Autologous CAR-T products are listed at USD 373,000-515,000, and total care can reach USD 1.2 million once hospitalization and adverse-event management are factored in. These costs, which 40% of U.S. commercial insurers rejected in 2024 due to concerns about patient churn, are high. Hemophilia gene therapies, for USD 3.5 million, require a decade-long amortization, a commitment that many payers view as risky, given the limited durability data. Medicaid prior-authorization rules in 15 U.S. states mandate failure of two earlier regimens, delaying access by four to six months, and excluding patients with deteriorating conditions. In emerging markets, out-of-pocket expenses exceed annual household income by over ten times, restricting uptake to a narrow, affluent cohort. While outcome-based contracts that rebate 50-80% of price upon non-response mitigate payer risk, they introduce revenue volatility that complicates fundraising, as shown by Bluebird Bio’s discounted USD 450 million cash call in 2024.
Multi-Jurisdiction Regulatory Complexity
Developers eyeing global launches face divergent data collection, manufacturing change, and post-marketing surveillance rules that add USD 80-120 million per product. The EMA requires a five-year follow-up for gene therapies, compared to two years for the FDA, obliging sponsors to fund parallel registries that consume up to 20% of launch budgets. China’s NMPA requires domestic trials even when global Phase III data exist, extending timelines two years, a lag illustrated by Kymriah’s 2024 approval seven years after its U.S. debut. Harmonization via the International Council for Harmonisation is under way but won’t fully align rules until 2027.
*Our forecasts treat driver/restraint impacts as directional, not additive. The impact forecasts reflect baseline growth, mix effects, and variable interactions.
Segment Analysis
By Product Type: Gene Therapy Extends Lead in Growth
Gene therapy, the fastest-advancing product type, is projected to log a 20.73% CAGR through 2031, driven by viral-vector intensification that increased AAV titers fourfold at Lonza’s Houston campus in 2025. Cell therapy still dominates revenue, capturing 47.81% in 2025 thanks to 18,000 patients treated with commercial CAR-T products that year. Allogeneic CAR-T platforms in late-phase trials promise 48-hour manufacturing cycles, down from two weeks, positioning off-the-shelf products to erode the market share of autologous products. Platelet-rich plasma remains a niche but profitable option, with 22% of U.S. insurers reimbursing orthopedic injections.
Cell therapy’s near-term growth hinges on label expansions into earlier-line hematologic settings and the first solid-tumor approval achieved in 2024, while stem-cell subsegments benefit from Japan’s iPSC scale-up initiative. Gene-therapy pipelines are diversifying from hemophilia and retinal disorders into neurodegeneration and metabolic diseases, thanks to platform manufacturing guidance that reduces the number of validation steps. Tissue-engineering firms pursue modular scaffolds that accept CRISPR-edited cells, creating hybrid products that blur traditional segment boundaries in the regenerative medicine market. Together, these dynamics maintain robust investment across modalities, even as gene therapy outpaces the field in terms of velocity.


By Therapeutic: Neurology Takes the Growth Spotlight
Neurological disorders are projected to grow at a 22.08% CAGR, the fastest therapeutic rate, propelled by AAV-GDNF vectors in Phase III Parkinson’s trials and by Bluebird Bio’s broader U.S. coverage for Lenti-D in cerebral adrenoleukodystrophy. Oncology remains the revenue anchor, accounting for 34.52% of 2025 sales; however, its growth moderates as hematologic indications saturate and solid-tumor biology poses immunosuppressive barriers. Musculoskeletal segments expand steadily on rising osteoarthritis prevalence, while wound-care revenues accelerate following Affinity’s commercial launch.
Oncology’s next leg of growth hinges on tumor-microenvironment modulators and dual-target CAR architectures aimed at sarcoma and glioblastoma. In neurology, real-world durability data will determine payer acceptance of high-priced one-time therapies versus chronic small-molecule regimens. Cardiovascular ventures pivot to allogeneic mesenchymal cells that integrate with mechanical devices, pursuing adjunct indications rather than standalone cures. Collectively, therapeutic diversification insulates the overall regenerative medicine market growth from the volatility of single indications.
By Material: Engineered DNA Vectors Accelerate
Synthetic polymers accounted for 53.18% of the 2025 material revenue, dominating scaffold fabrication with PLGA and PCL blends that degrade within a year. Genetically engineered materials, however, post an 18.12% CAGR as AAV2, AAV5, and AAV9 vectors demonstrate 80-95% transduction in liver, muscle, and CNS tissues. The regenerative medicine market share held by synthetic materials is expected to narrow as programmable bio-inks incorporating CRISPR-edited cells gain traction. Hydrogel and xenogeneic matrices broaden their clinical indications after decellularization techniques eliminate immunogenic epitopes. Pharmaceutical adjuncts, such as Wnt agonists, represent a small but strategic slice, often bundled with scaffolds under FDA combination-product guidance, which shortens review times by 12 months.
DNA-vector innovation focuses on capsid re-engineering to escape neutralizing antibodies, while 3D printing firms refine GelMA-based inks that mirror organ-specific stiffness and porosity. Artificial vascular graft developers near market with long-term patency data, and collagen-based matrices secure new reimbursements following superior healing endpoints. Altogether, material science advances fortify the regenerative medicine market’s ability to tackle larger tissue volumes and more complex organ systems.
By End User: Outpatient Models Gain Momentum
Hospitals retained 52.36% of 2025 revenue, yet specialty clinics are on track for a 21.76% CAGR through 2031 as outpatient CAR-T protocols slash per-patient costs by USD 150,000 and compress authorization time from 18 to six days. The regenerative medicine market size generated by clinics could double by 2028 if CMS finalizes draft guidance allowing lower-risk autologous therapies outside hospital REMS programs. Academic centers remain pivotal for early-phase trials, capturing 18.4% of 2025 spending. Ambulatory surgery centers and long-term care facilities handle lower-complexity platelet-rich plasma and stem cell applications, collectively comprising 8% of revenue.
Hospitals will continue to dominate high-risk gene-therapy infusions and allogeneic transplants, which require prolonged monitoring. Clinics, meanwhile, utilize standardized workflows to increase throughput by 40%, while payers prefer their lower facility fees. Regulatory risk-tiering on the horizon could shift a further 30% of volume into outpatient settings, altering referral patterns and reimbursement flows across the regenerative medicine market.
Geography Analysis
North America captured 44.16% of the 2025 revenue, supported by CMS rules that reimburse CAR-T for multiple lines of hematologic cancers and by the Transitional Coverage for Emerging Technologies pathway, which guarantees provisional payment within six months of FDA approval. Outcome-based contracts adopted by 22 health systems mitigate budget impact and foster broader patient access. Canada negotiated 40% pricing concessions through volume commitments, while Mexico granted two CAR-T approvals but faces affordability constraints due to out-of-pocket costs exceeding USD 200,000.
The Asia-Pacific, the fastest-growing region at a 23.76% CAGR, benefited from six domestic CAR-T approvals in China, priced at CNY 1.2 million (USD 165,000), accelerating adoption across 18 provincial hospitals. Japan’s conditional approvals of four iPSC-derived therapies shorten timelines by three years, and India’s 18-month Phase I-II path wooed USD 2.1 billion in foreign direct investment to Hyderabad and Bengaluru CDMO clusters. Singapore’s 90-day review rule draws high-value manufacturing into Tuas Biomedical Park, while South Korea’s lower CAR-T production costs unlock export opportunities to Southeast Asia.
Europe held 22.8% of 2025 revenue, underpinned by conditional Lenmeldy approval and national outcome-based contracts that tied reimbursement to six-month remission rates. The United Kingdom’s expanded Early Access to Medicines Scheme brings forward revenue by 18 months, and Germany’s rebate model spurs value-based competition among suppliers. Italy and Spain capped gene-therapy expenditures via managed-entry agreements that still provide full access to pediatric indications. In the Middle East and Africa, sandbox incentives account for 4.6% of revenue, with reliance on these incentives being particularly notable in the UAE, and limited approvals are available in South Africa. Meanwhile, South America’s 3.9% share is concentrated in Brazil’s high-complexity centers due to cost barriers.
Overall, the regenerative medicine market exhibits regional divergence, with reimbursement depth driving growth in North America, cost innovation fueling growth in the Asia-Pacific, and managed-entry agreements moderating expansion in Europe. Supply-chain localization - AAV suites in China, iPSC factories in Japan, and bio-printing hubs in the United States - further anchor production to the fastest-growing demand centers.

Regulatory Landscape
Regenerative medicine regulation continues to be shaped by expedited review frameworks and changing expectations for chemistry, manufacturing, and controls (CMC) across major agencies. In the United States, the FDA issued a draft update in September 2025 for its expedited programs for regenerative medicine therapies for serious conditions (RMAT-related guidance), and in January 2026 it outlined a more flexible approach to certain CMC requirements for cell and gene therapies to support innovation while maintaining product quality and patient safety.
In Europe, the EMA Committee for Advanced Therapies (CAT) continued to progress advanced therapy medicinal products through the centralized process in 2026, with positive draft opinions recorded in early 2026 for products including Adstiladrin, followed by European Commission marketing authorization in May 2026 for Adstiladrin. Japan retains a distinct pathway for regenerative medical products, supported by PMDA guidance (published March 2024) on Conditional and Time-Limited Approval to improve predictability for sponsors while balancing lifecycle evidence generation requirements.
Value Chain Analysis
The regenerative medicine value chain spans starting material procurement (donor tissue, apheresis collections, plasmids, viral vectors, and growth factors), process development and GMP manufacturing (in-house and CDMOs), quality control and release testing, cold-chain logistics with chain-of-identity/chain-of-custody controls, and finally administration in certified hospitals and increasingly in specialty clinics for lower-risk protocols. Key constraints remain around constrained apheresis and specialized lab capacity in major metro areas, viral-vector and critical raw-material availability, and failure risk from fragmented vendor handoffs, which increases the operational premium on closed systems, standard workcells, and integrated data capture.
In 2026, industry responses show further movement toward integrated supply models and automation. Made Scientific and RoosterBio formed a strategic technology partnership (May 2026) to connect scalable MSC and extracellular vesicle platforms with end-to-end GMP CDMO operations, while CCRM, OmniaBio, and Avectas partnered (June 2026) to evaluate automated cell therapy manufacturing for a hub-and-spoke model. At the same time, evolving compliance requirements are increasing the importance of traceability infrastructure, including EU-focused initiatives that emphasize long-lived donor-to-patient traceability and mandatory reporting, pushing manufacturers and logistics operators to invest in interoperable tracking systems and standardized documentation across sites.
Competitive Landscape
The regenerative medicine sector is moderately fragmented: the top five companies - Novartis, Gilead Sciences, Bristol-Myers Squibb, Takeda, and Bluebird Bio - command a high share of 2025 revenue, while 18 mid-caps and venture-backed firms share a further 42%. Novo Holdings’ USD 16.5 billion takeover of Catalent consolidated viral-vector capacity, tightening supply and extending lead times to 24 months for small developers. Large pharma respond with vertical integration; Gilead and Bristol-Myers each invested over USD 400 million in proprietary vector plants, halving their dependence on contract slots.
Disruptors Allogene Therapeutics and CRISPR Therapeutics are advancing allogeneic CAR-T platforms that could capture 25% of the segment by 2030, driven by 60% cost reductions and 48-hour manufacturing cycles. WuXi Biologics’ AI-driven Smart Lab, adopted by multiple CDMOs, improved titers 26.8% and slashed batch failures to 3%, illustrating the productivity premium embedded in advanced analytics. Patent trench warfare centers on AAV capsid libraries, with Novartis, Spark, and the University of Pennsylvania holding 42% of foundational claims, adding USD 20-40 million in licensing costs for newcomers.
Pricing models bifurcate into outcome-based agreements, which rebate up to 80% upon non-response, and traditional per-dose fees. Hospitals holding REMS certification exert leverage in negotiations, while specialty clinics differentiate on faster patient throughput. As solid-tumor CAR-T technology matures, firms with tumor-microenvironment assets may leapfrog early leaders confined to the field of hematology.
Regenerative Medicine Industry Leaders
Organogenesis Holdings Inc.
Baxter International Inc.
Medtronic
Integra LifeSciences Holdings Corporation
Smith & Nephew plc
- *Disclaimer: Major Players sorted in no particular order

Market Opportunities and Future Outlook
Manufacturing scale-up and component localization remain prominent whitespace areas as developers move beyond early commercial volumes into broader indications and geographies. In 2026, FUJIFILM Cellular Dynamics opened a large iPSC manufacturing facility in Madison, Wisconsin (175,000 square feet) to expand iPSC research and services capacity, while Sartorius Stedim Biotech opened a EUR 140 million competence center in Freiburg, Germany, to increase output of quality-critical cell and gene therapy components. These investments support opportunities for platform suppliers (single-use systems, growth factors, analytical assays, and traceability software) and for CDMOs offering integrated development-to-commercial pathways for cell therapy, gene therapy, and tissue-engineered products.
Regulatory system design is also creating new commercial lanes in specific markets by reducing uncertainty around licensing and oversight. India notified the Drugs (Eighth Amendment) Rules, 2026 (effective June 29, 2026), bringing cell, stem cell, and gene therapies, along with xenografts, under a centralized licensing framework (CLAA), which clarifies compliance expectations for manufacturers and importers and supports structured market entry for advanced therapies. Capacity additions in Asia further indicate adoption-led opportunities, with CG Bio commencing full-scale operations at its Novo Factory in South Korea in 2026, including stated annual capacity of 400,000 units for orthopedic regenerative products, reinforcing demand for standardized manufacturing, distribution, and hospital procurement models in high-throughput musculoskeletal use cases.
Recent Industry Developments
- April 2026: Organogenesis announced successful completion of a randomized controlled trial for PuraPly AM in diabetic foot ulcers, achieving a statistically significant wound-closure endpoint at 12 weeks. The readout strengthens clinical evidence for advanced wound-care products and supports payer and provider decisions that increasingly hinge on comparative outcomes.
- December 2025: Organogenesis initiated a rolling Biologics License Application submission to the US FDA for ReNu, a cryopreserved amniotic suspension allograft for knee arthritis. The filing activity signals continued momentum for regulated tissue-based and cell-adjacent products moving toward broader commercial access pathways.
- September 2024: Poseida Therapeutics received FDA RMAT designation for P-BCMA-ALLO1, an allogeneic CAR-T therapy under evaluation for multiple myeloma. RMAT status can streamline development interactions and reinforces the shift toward off-the-shelf cell therapy platforms that reduce turnaround time and manufacturing complexity versus autologous approaches.


Research Methodology Framework and Report Scope
Market Definition and Coverage
This market is defined as revenues generated from regenerative medicine products and enabling technologies that help repair, replace, or regenerate human cells, tissues, or organs across major care settings and research-linked clinical use.
Scope exclusions: Veterinary use and purely aesthetic platelet-rich plasma kits are excluded from the market numbers.
Segmentation Overview
- By Product Type
- Cell Therapy
- Autologous
- Allogeneic
- Stem Cell Therapy
- Embryonic Stem Cell
- Adult Stem Cell
- Induced Pluripotent Stem Cell
- Gene Therapy
- Viral Vector-based
- Non-viral Vector-based
- Tissue Engineering
- Scaffolds
- Biomaterials
- Engineered Tissue Constructs
- Platelet-Rich Plasma
- Cell Therapy
- By Therapeutic
- Oncology
- Musculoskeletal Disorders
- Wound Care & Dermatology
- Cardiovascular Diseases
- Neurology
- Ophthalmology
- Other Therapeutics
- By Material
- Synthetic Materials
- Biodegradable Polymers
- Hydrogel Materials
- Artificial Vascular Graft Materials
- Biologically Derived Materials
- Collagen
- Xenogeneic Materials
- Genetically Engineered Materials
- DNA Vectors
- 3-D Polymer Technology
- Pharmaceuticals (Small Molecule & Biologic)
- Synthetic Materials
- By End User
- Hospitals
- Specialty Clinics
- Academic & Research Institutes
- Other End Users
- By Geography
- North America
- United States
- Canada
- Mexico
- Europe
- Germany
- United Kingdom
- France
- Italy
- Spain
- Rest of Europe
- Asia-Pacific
- China
- Japan
- India
- Australia
- South Korea
- Rest of Asia-Pacific
- Middle East & Africa
- GCC
- South Africa
- Rest of Middle East & Africa
- South America
- Brazil
- Argentina
- Rest of South America
- North America
Data Sources, Market Sizing, and Validation
Desk Research
Desk work was used to set the market boundaries and build the initial set of global and regional demand signals before interviews began. We mainly rely on public sources that are easy to audit, such as World Health Organization disease burden data, the US FDA and European Medicines Agency product and approval databases, ClinicalTrials.gov trial registries, OECD health statistics, and World Bank macro indicators.
To translate those signals into market inputs, we also used peer reviewed journals on cell and gene therapy outcomes, trade association updates on advanced therapies, company annual reports, investor presentations, and reputable press coverage of approvals and manufacturing expansions. Where revenue splits were not clearly stated, we used paid subscriptions for company financials and intelligence, plus patent databases to check innovation intensity and timing. These examples are not exhaustive, and we consulted additional public and paid sources to collect, cross-check, and clarify key data points.
Primary Interviews and Surveys
Primary work focused on validating what is selling today, how pricing moves by therapy class, and where adoption remains limited by reimbursement, capacity, or clinical pathways. We spoke with therapy developers, CDMO and manufacturing specialists, hospital and clinic stakeholders, and subject matter experts across APAC, EMEA, and the Americas. Their input helped us adjust assumptions that desk sources could not settle.
These discussions were also used to confirm launch timing, regional uptake patterns, and the practical split between commercial sales and limited access pathways, so the final model reflects real-world purchasing and delivery constraints.
Distribution of primary research fieldwork respondents
| Company type | Respondent position | Region |
|---|---|---|
| Top tier: 27% | CXOs: 14% | APAC: 42% |
| Mid tier: 59% | Functional/Unit leaders: 42% | EMEA: 36% |
| Smaller Players: 14% | Managers: 44% | Americas: 22% |
Market-Sizing & Forecasting
Sizing starts with a top-down build where patient cohorts, treated rates, and therapy adoption by indication are converted into value using observed pricing ranges and expected course of treatment. That demand pool is then stress-tested using targeted bottom-up checks, such as sampling company level therapy revenues where available, cross-checking manufacturing capacity expansion signals, and sanity-checking implied volumes against known clinical throughput.
Key inputs used in the model include the count of relevant clinical trials by phase, approvals and label expansions, estimated addressable patient pools for high-value indications, manufacturing capacity and utilization signals, reimbursement and coverage momentum by region, and average selling price progression by therapy class. When bottom-up data points were missing for smaller developers or early commercial products, we handled gaps through peer grouping by modality and indication, then applied conservative share allocations that are revisited during expert validation.
For forecasting, scenario analysis is used because the market is sensitive to approvals, reimbursement decisions, and capacity additions. Assumptions for base, conservative, and faster-adoption cases are anchored to expert views on pipeline conversion and ramp-up curves, and then reconciled back to demand-side constraints so growth does not outpace plausible delivery capacity.
Data Validation & Update Cycle
Outputs are triangulated by comparing implied treated volumes, pricing, and regional shares against independent signals, and then checking whether totals remain consistent with observed approval counts and manufacturing expansion timing. If a figure looks unusual, it is reworked by revisiting driver assumptions, rechecking currency conversion timing, and re-contacting relevant experts when the gap cannot be explained through public data.
Before sign-off, the model is reviewed in multiple steps so calculation logic, scope alignment, and key assumptions are applied consistently across regions and therapy types. The report is refreshed annually, and interim updates are made when material events occur, such as major approvals, policy shifts, or large capacity announcements. Right before delivery, an additional analyst pass is completed so clients receive the latest updated view.
Mordor Intelligence's Global Regenerative Medicines Market Market Estimate Compared With Other Published Estimates
Different sources often show different market sizes for regenerative medicines because they do not count the same revenue streams and they apply different timing for launches, pricing, and currency conversion. In practice, even small changes in what is counted as commercial revenue can move the total by several billions.
The main spread usually comes from whether late-stage pipeline revenues and limited access pathways are included, how platelet-rich plasma is treated, and whether the pricing curve assumes fast erosion or stable premium pricing over time. Some estimates also mix research tools and banking services into the core therapy market, or use older approval and trial data that has not been refreshed after recent label expansions and manufacturing scale-ups. That shifts the base-year starting point and the forecast slope.
Benchmark comparison
| Source | Market Size | Gaps in Research Methodology |
|---|---|---|
| Mordor Intelligence | USD 32.62 B (2025) | |
| Global Research Publisher A | USD 41.36 B (2025) | Uses a broader product framing that can fold tools and banking services into totals, and it anchors growth on a different base year, which changes the implied 2025 run-rate. |
| Industry Research Outlet B | USD 43.77 B (2025) | Likely counts a wider set of materials and applications and applies a longer forecast window, which can pull adjacent revenues into the 2025 starting value. |
The table shows that scope and starting-point choices explain most of the gap, especially around whether adjacent tool and material revenues are counted alongside therapeutic sales. By keeping the total tied to human therapeutic use and only adding limited access revenues when they are observable, the 2025 estimate stays traceable to adoption and pricing drivers, a choice applied by Mordor Intelligence.


Key Questions Answered in the Report
What is the projected value of the regenerative medicine market in 2031?
It is forecast to reach USD 91.94 billion by 2031, growing at an 18.19% CAGR from 2026.
Which therapeutic area is expected to grow the fastest?
Neurology leads with a projected 22.08% CAGR, driven by late-stage gene-therapy programs for Parkinson’s disease and cerebral adrenoleukodystrophy.
Why are specialty clinics gaining share in regenerative treatments?
Outpatient CAR-T protocols eliminate multi-week hospital stays, reducing per-patient costs by USD 150,000 and improving payer acceptance.
How are manufacturing innovations influencing prices?
AI-enabled closed-system bioreactors have cut cost-of-goods for some CAR-T products from USD 250,000 to USD 85,000 per dose.
Which region will expand the fastest through 2031?
Asia-Pacific is projected to post a 23.76% CAGR as China, Japan, and India streamline approvals and scale local manufacturing.
Page last updated on:


