
Market Overview
| Study Period | 2021 - 2031 |
|---|---|
| Forecast Data Period | 2026 - 2031 |
| Base Year Market Size (2025) | 7.47 gigawatt |
| Market Volume (2026) | 8.88 gigawatt |
| Market Volume (2031) | 21.05 gigawatt |
| Growth Rate (2026 - 2031) | 18.84 % |
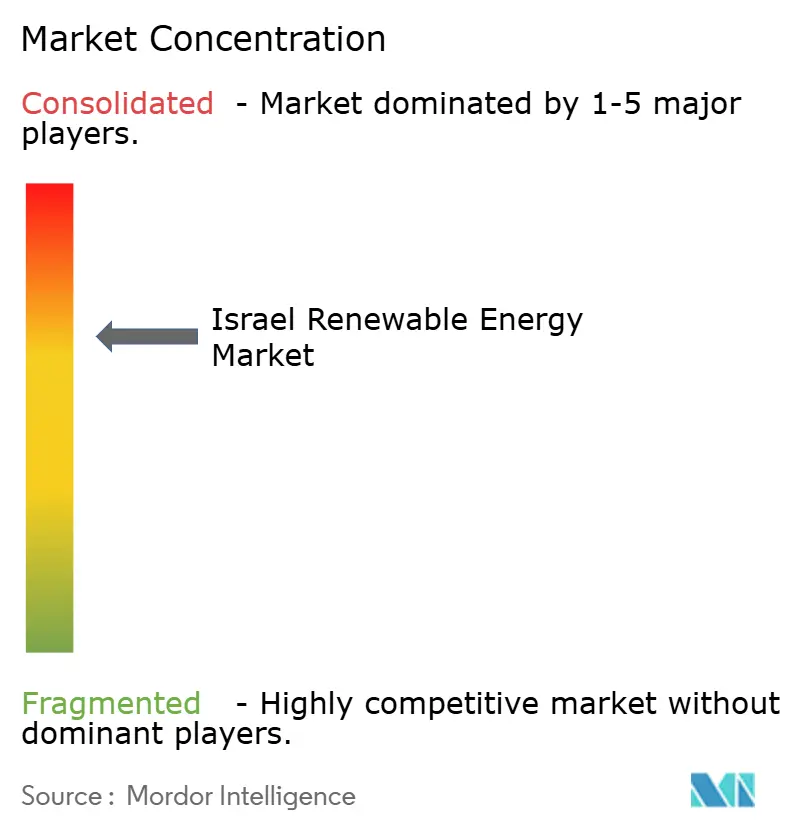
| Market Concentration | Medium |
Major Players *Disclaimer: Major Players sorted in no particular order Image © Mordor Intelligence. Reuse requires attribution under CC BY 4.0. | |
Israel Renewable Energy Market Analysis by Mordor Intelligence
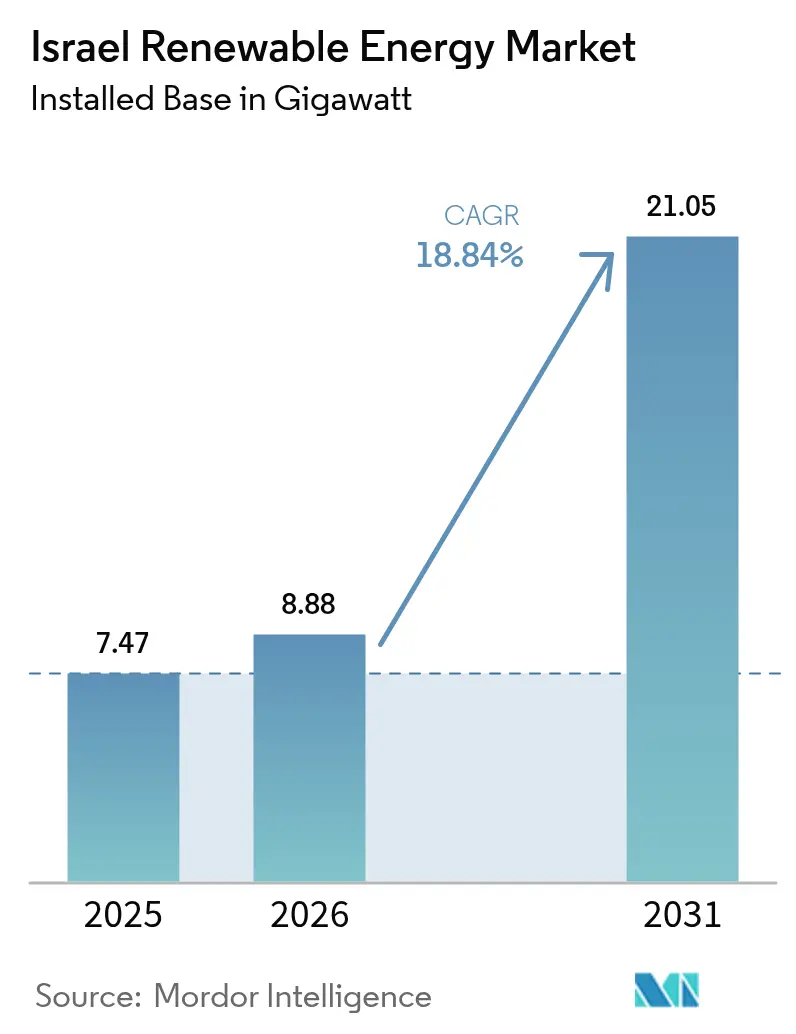
The Israel Renewable Energy Market size was valued at 7.47 gigawatt in 2025 and estimated to grow from 8.88 gigawatt in 2026 to reach 21.05 gigawatt by 2031, at a CAGR of 18.84% during the forecast period (2026-2031).
This expansion reflects a strategic pivot toward energy autonomy as regional security disruptions heighten the urgency of diversifying away from fossil imports.[1]Nikkei Asia, “Conflicts Spur Mideast to Seek Energy Autonomy,” asia.nikkei.com Utility-scale solar projects dominate new builds, while distributed generation systems scale quickly under mandatory rooftop solar rules for new structures. Independent power producers (IPPs) now finance most capacity additions, signalling a permanent shift from state-controlled generation to private capital. Rapid cost declines in photovoltaic modules, rising corporate clean-power purchases from Israel’s tech and defence campuses, and the revival of long-term feed-in tariffs underpin the strong demand outlook.
Key Report Takeaways
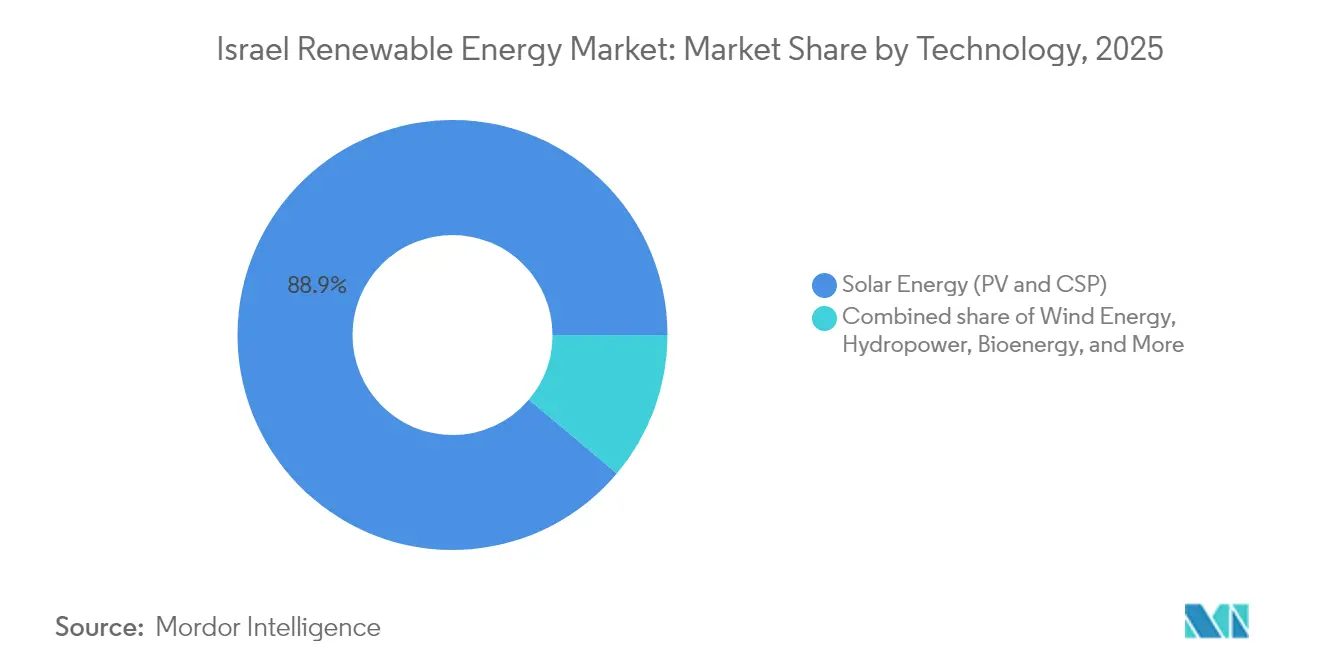
- By technology, solar energy commanded 88.85% of the Israel renewable energy market share in 2025; wind energy is projected to lead segment growth with a 40.10% CAGR through 2031.
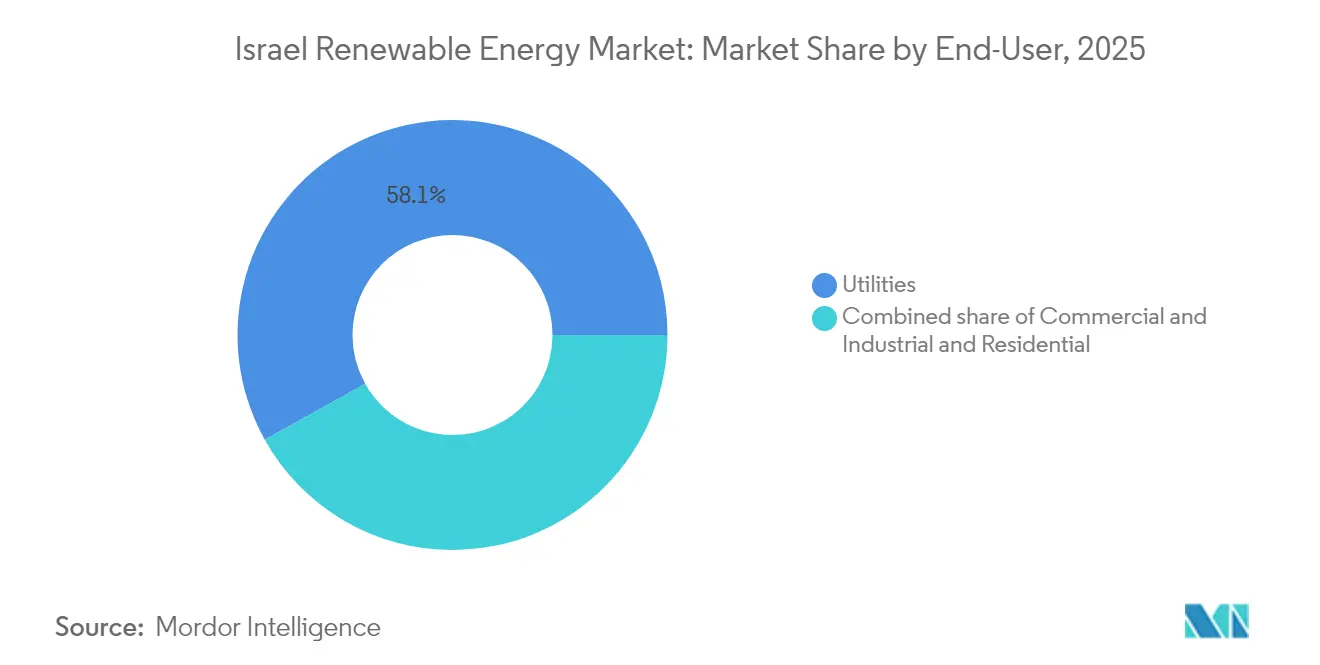
- By end-user, utilities accounted for 58.10% of the Israel renewable energy market size in 2025, while commercial and industrial users recorded the fastest growth at a 23.95% CAGR to 2031.
Note: Market size and forecast figures in this report are generated using Mordor Intelligence’s proprietary estimation framework, updated with the latest available data and insights as of 2026.
Israel Renewable Energy Market Trends and Insights
Drivers Impact Analysis*
| Driver | (~) % Impact on CAGR Forecast | Geographic Relevance | Impact Timeline |
|---|---|---|---|
| Government-backed feed-in-tariffs revival | +2.5% | Northern Israel, Negev, Arava | Medium term (2-4 years) |
| Falling LCOE of utility-scale solar PV | +3.5% | Negev (Dimona, Ashalim), Western Negev (Takuma) | Short term (≤ 2 years) |
| 40% renewable-electricity target for 2030 | +4.0% | National | Long term (≥ 4 years) |
| Corporate PPAs from tech & defense campuses | +2.0% | Tel Aviv, Haifa tech corridors | Medium term (2-4 years) |
| Emerging offshore-wind resource in EEZ | +1.5% | Mediterranean Exclusive Economic Zone | Long term (≥ 4 years) |
| Agrivoltaics for arid-land optimization | +1.0% | Negev, Arava, Galilee | Medium term (2-4 years) |
| Source: Mordor Intelligence | |||
Government-backed Feed-in-Tariffs Revival
Israel reinstated 20-year feed-in-tariff contracts that guarantee predictable cash flows for projects up to 250 MW.[2]International Energy Agency, “Israel Resurrects Solar Feed-in Tariffs,” iea.org The mechanism corrects the financing gap created after the 2013 shift to net-metering and now underpins at least 250 MW of annual solar additions mandated by Government Resolution 4450. Smaller IPPs benefit most because the tariff improves bankability without large corporate offtakers. Activity is concentrated in the Negev and Golan, where land is abundant yet grid access remains limited, prompting developers to co-site new substations with solar parks. The policy directly raises installation rates and broadens investor participation in the Israel renewable energy market.
Falling LCOE of Utility-scale Solar PV
EDF Renewables won a 300 MW tender at USD 0.019/kWh in 2024, a record low that establishes solar as Israel’s least-cost new-build technology.[3]PV Magazine, “EDF Wins 300 MW Tender at USD 0.019/kWh,” pv-magazine.com High isolation above 2,000 kWh/m², superior tracker designs, and volume procurement have pushed PV costs 45% below 2022 levels. Industrials now lock in 20-year corporate PPAs to hedge fuel volatility, while developers such as Solaer report 1.78 GW in construction, helped by cheap modules. The price advantage catalyses utility-scale projects and accelerates distributed rooftop rollouts, cementing solar PV as the backbone of the Israel renewable energy market.
2030 30%-RE Target & Net-Zero 2050 Pledge
The revised policy requires 17.1 GW of solar and 3 GW of storage by 2030. Achieving this requires grid digitalization, flexible generation, and aggressive battery build-out, with the Ministry of Energy allocating USD 710 million for storage tenders over the period 2025-2027. The roadmap lifts investor confidence, aligns multiple ministries on permitting reforms, and integrates dual-use agrivoltaics into land-scarce regions. Long-term clarity reinforces corporate decarbonisation plans and makes the Israel renewable energy market a high-priority target for global capital inflows.
Corporate PPAs from Tech & Defence Campuses
Multinationals located in greater Tel Aviv now sign 10- to 20-year renewable PPAs that bundle battery capacity for 24/7 delivery. Defence OEMs similarly commit to clean-power sourcing to secure NATO procurement eligibility. These bankable offtake contracts lower financing costs by up to 120 basis points, accelerating greenfield pipelines for IPPs. The clustering of high-load campuses enables dedicated feeder lines that ease urban grid congestion, further integrating distributed PV into the Israeli renewable energy industry.
Restraints Impact Analysis*
| Restraint | (~) % Impact on CAGR Forecast | Geographic Relevance | Impact Timeline |
|---|---|---|---|
| Grid congestion & limited sub-station capacity | -2.5% | Northern Israel, Takuma, Arabah | Short term (≤ 2 years) |
| Scarcity of suitable land parcels | -2.0% | National, acute in coastal plains and central districts | Medium term (2-4 years) |
| Geopolitical/security curtailment risks | -1.5% | Border regions | Medium term (2-4 years) |
| Water stress for CSP cooling | -1.0% | Negev (Ashalim CSP complex) | Long term (≥ 4 years) |
| Source: Mordor Intelligence | |||
Grid Congestion & Limited Sub-Station Capacity
Three high-renewable zones already exceed local switching-station ratings at midday, forcing 5-8% curtailment in 2024. The Israel Electric Corporation plans to invest NIS 20 billion by 2027 to add 738 km of 400 kV lines; however, the build-out lags behind solar additions, potentially delaying project commissioning by up to a year. Developers now pre-screen sites for grid headroom rather than solar irradiance, concentrating new capacity in zones with immediate access to interconnection.
Scarcity of Suitable Land Parcels
Competing claims from agriculture, defense, nature reserves, and urban growth leave fewer than 500 km² genuinely available for utility solar. Multi-stakeholder permitting can stretch to 18-24 months, and developers pay risk premiums for contested sites, such as the Golan Heights, where Doral plans a 300 MW solar-plus-1.2 GWh storage plant valued at ILS 900 million (approximately USD 253 million). Higher-density configurations, bifacial modules, elevated trackers, and agrivoltaics boost yield per hectare by 20-30%, effectively stretching scarce land.
*Our forecasts treat driver/restraint impacts as directional, not additive. The impact forecasts reflect baseline growth, mix effects, and variable interactions.
Segment Analysis
By Technology: Solar Dominance Meets Wind Acceleration
Solar energy led the Israel renewable energy market share at 88.85% of installed capacity in 2025, reflecting an isolation of 2,200-2,800 kWh/m²/year in the Negev and LCOE below USD 0.02/kWh in recent tenders. Wind capacity is small today but is set to outpace all other technologies with a 40.10% CAGR through 2031, supported by the first 207 MW utility plant and by the Great Sea Interconnector that will channel wind-heavy imports. The Israel renewable energy market size for solar is projected to exceed 17.5 GW by 2031, while wind may surpass 2.3 GW over the same horizon.
Hybrid assets at the Ashalim complex combine CSP with 4.5-hour thermal storage to firm evening peaks, illustrating a transition toward dispatchable renewables. Hydropower, bioenergy, geothermal, and ocean energy collectively account for less than 2% of total capacity. Eco Wave Power’s 100 kW pilot at Jaffa Port highlights ongoing innovation, yet its LCOE above USD 0.20/kWh limits near-term scaling. Israeli developers increasingly focus on export-oriented hydrogen and wind projects abroad, while domestic growth centers on solar-plus-storage and agrivoltaics.



By End-User: Utilities Lead, C&I Surges
Utilities accounted for 58.10% of the Israel renewable energy market size in 2025, backed by centralized tenders that awarded 1.5 GW of battery capacity in February 2025. Commercial and industrial customers, however, are projected to grow at a rate of 23.95% annually through 2031. Corporate PPAs enable on-site solar at prices below grid tariffs, and the rooftop solar mandate targets 3.5 GW of new installations by 2040. The Israel renewable energy market share of C&I segments will rise as projects co-locate generation with load centers to hedge price volatility.
Residential adoption lags due to Israel’s high rate of apartment dwelling, which complicates rooftop ownership. A rooftop-mapping tool launched in 2025 may reduce permitting time, but fewer than 50 MW of capacity were added by households in 2024. Aggregators like Nofar Energy and Shikun & Binui are bundling multi-tenant rooftops to achieve bankable scale, yet structural hurdles keep the residential deployment niche for now.
Geography Analysis
Northern Israel benefits from reliable ridge-top winds across the Golan Heights, enabling 207 MW of onshore turbines that supply 70,000 households and reduce CO₂ emissions by 180,000 t annually. Developers queue an additional 420 MW, yet they still struggle with grid capacity limits on the Katzrin-Haifa corridor. In contrast, the Negev Desert offers abundant sunlight and inexpensive terrain, hosting 54.60% of Israel's installed PV base in the renewable energy market, including the flagship 300 MW EDF project.
Central coastal districts face land scarcity and high property values, but commercial roofs, carports, and floating systems on Mekorot reservoirs fill the gap. Ten reservoir-top arrays now contribute 47 GWh yearly, illustrating how dual-use sites sidestep land bottlenecks. The Tel Aviv tech corridor also anchors a burgeoning corporate PPA ecosystem that underwrites utility-scale solar in outlying zones, while blending battery-backed rooftop PV for data center resiliency.
Israel's Mediterranean Exclusive Economic Zone is likely to host the nation's first offshore wind pilot after 2028, extending geographic diversity and improving winter evening supply when solar energy fades. Finally, agricultural valleys deploy agrivoltaic rows that shade crops, conserve water, and generate revenue. The REGACE consortium trials CO₂-enriched greenhouses under thin-film panels, demonstrating how rural economies can benefit from Israel's renewable energy market without compromising food output.
Regulatory Landscape
Israel's electricity sector is governed by the Electricity Sector Law (1996), with the Israel Electricity Authority (Public Utilities Authority) regulating tariffs, licensing, and market rules, while the Ministry of Energy and Infrastructure sets policy direction and national plans. The report links revived 20-year feed-in-tariff contracts for projects up to 250 MW, along with national deployment targets, to tender designs that favor solar-plus-storage and bankable offtake structures.
In May 2026, the Ministry of Energy and Infrastructure published the National Strategic Plan for Renewable Energies 2035 for public comment. The document lays out a pathway to about 26 GW of installed renewable capacity by 2035 and reinforces dual-use approaches such as agrivoltaics. Alongside these longer-horizon goals, the regulatory push to integrate storage and address grid constraints is tied to the Israel Electric Corporation's grid investment plans, and to increased reliance on centralized tenders and connection rules to manage curtailment and congestion in high-penetration zones.
Competitive Landscape
Competition is moderate yet tilting toward consolidation, as giga-scale projects demand deep balance sheets and integrated storage expertise. Domestic champions Energix, Enlight, and Econergy draw on in-house EPC capabilities, land-bank pipelines, and agile community engagement. They collaborate with global suppliers such as First Solar for bifacial modules and SMA for central inverters, compressing delivery timelines to under 14 months. International majors EDF Renewables and Ormat Technologies import project-finance acumen, pushing bid prices to record lows that challenge smaller entrants.
Ormat’s 300 MW/1.2 GWh storage win in February 2025 marks a strategic play into grid-scale batteries, signalling a future where solar-plus-storage packages become the default tender requirement. Meanwhile, TriSolar pilots agrivoltaic systems, Brenmiller commissions thermal storage for industrial steam, and Eco Wave Power exports its breakwater technology to Portugal, underscoring Israel’s depth in cleantech innovation.
Market share remains dispersed: the top five developers controlled roughly 43% of operating renewable capacity in 2024, down from 48% in 2023 as new IPPs enter through rooftop and C&I niches. Strategic joint ventures with pension funds and sovereign investors are common, reflecting confidence in the Israel renewable energy market despite geopolitical volatility. Looking ahead, the ability to pair PV with four-hour batteries and to secure long-tenor PPAs will separate enduring leaders from one-off project builders.
Israel Renewable Energy Industry Leaders
Enlight Renewable Energy Ltd.
EDF Renewables
Doral Group
Energix Renewable Energies Ltd.
Ormat Technologies Inc
- *Disclaimer: Major Players sorted in no particular order

Market Opportunities and Future Outlook
One near-term build gap in Israel's renewable expansion is interconnection pace and the availability of flexibility resources to absorb additional solar. The 2024 curtailment in high-renewable zones underscores the value of grid-scale batteries, hybrid solar-plus-storage plants, and grid upgrades. This opportunity aligns with budgeted storage tender allocations from the Ministry of Energy and Infrastructure for 2025-2027, as well as continued battery capacity awards through centralized tenders, which help developers and integrators underwrite revenue streams for grid support services.
Land scarcity also keeps dual-use deployment models at the center of growth, including agrivoltaics, rooftop mandates for new non-residential buildings, and solar on existing infrastructure such as reservoirs and carports. The May 2026 National Strategic Plan for Renewable Energies 2035 explicitly lays out capacity pathways across agrivoltaics, ground-based, and other dual-use categories toward a 26 GW goal. Recent project and financing milestones, such as EDF Renewables reaching financial close for the Dimona solar plant in 2026, support the bankability case for utility-scale assets within Israel's tender and PPA framework. On longer-cycle initiatives, the Ministry-backed grants to 18 projects in early 2026 cover renewable energy and adjacent applications.
Recent Industry Developments
- July 2026: Nofar Energy signed a 15-year agreement with Cellcom Energy to sell electricity from planned battery energy storage projects totaling 100 MW and 500 MWh. The deal supports merchant-facing storage monetization through long-tenor contracting, helping developers finance standalone batteries and strengthen system flexibility in a solar-heavy grid.
- May 2026: EDF Renewables announced financial close for the Dimona solar power plant in the Negev, a 265 MW facility described as the largest renewable energy installation in Israel to date. Secured financing for a flagship utility-scale asset reinforces the investability of large projects under Israel's tender and tariff frameworks and accelerates scale-up in the Negev, the country's primary solar development zone.
- August 2024: Israel mandated solar installations on new non-residential buildings, targeting an additional 3.5 GW of rooftop capacity by 2040. This regulatory move expands the distributed generation pipeline and increases demand for rooftop EPC, inverters, and behind-the-meter storage and control solutions across commercial and industrial sites.


Research Methodology Framework and Report Scope
Market Definition and Coverage
For this study, the Israel renewable energy market is sized as the total installed capacity of renewable power assets operating in Israel, expressed in USD terms and tracked year by year based on commissioning and retirements.
Scope exclusions: We exclude conventional fossil generation and count renewable capacity only after it is commissioned and grid-connected (projects in pipeline are not treated as installed).
Segmentation Overview
- By Technology
- Solar Energy (PV and CSP)
- Wind Energy (Onshore and Offshore)
- Hydropower (Small, Large, PSH)
- Bioenergy
- Geothermal
- Ocean Energy (Tidal and Wave)
- By End-User
- Utilities
- Commercial and Industrial
- Residential
Data Sources, Market Sizing, and Validation
Desk Research
Desk research is used to build the base structure of the model and to anchor the timeline of policy and grid constraints that shape renewable additions in Israel. We mainly refer to public sources such as the Israel Electricity Authority publications, Ministry of Energy releases, Central Bureau of Statistics datasets, IEA country and power statistics, and IRENA renewable capacity series, which help us reconcile installed capacity by technology.
On top of this, we review project announcements and timelines from investor presentations and filings, plus credible press coverage and association websites, to cross-check commissioning dates and system type assumptions. Where needed, paid subscriptions for company financials and intelligence, patent databases, and shipment-level import and export data are used to sense-check equipment availability and project execution signals. The sources listed here are illustrative only, and additional public documents were also used for data collection, validation, and clarification.
Primary Interviews and Surveys
We interview Israeli utilities, developers, installers, storage specialists, regulators, and financing professionals through expert discussions and surveys. Their feedback validates commissioning status, project pipelines, tariffs, grid delays, and missing capacity, after which assumptions and final estimates are reconciled.
Distribution of primary research fieldwork respondents
| Company type | Respondent position |
|---|---|
| Top tier: 30% | CXOs: 20% |
| Mid tier: 45% | Functional/Unit leaders: 30% |
| Smaller Players: 25% | Managers: 50% |
Market-Sizing & Forecasting
Sizing starts with a top-down reconstruction of installed renewable capacity in Israel, where historical capacity series are aligned with known commissioning and retirement events, and then extended using expected additions by technology. After that, selective bottom-up approximations are used as a check, such as rolling up a sample of visible projects and applying typical MW-per-project ranges and build timelines to see if totals drift.
Key inputs that shape the model include annual renewable capacity additions in GW, commissioning lead times, interconnection availability, tender and permitting signals, and the mix shift between utility-scale and distributed systems. These indicators matter because they explain why some years show step changes while others move slowly even when demand is strong.
For forecasting, scenario analysis is used so that the base case growth reflects what market participants view as buildable under grid and policy conditions, with upside and downside paths reflecting faster approvals or slower connections. Where bottom-up visibility is incomplete, gaps are handled by applying conservative utilization ranges for announced capacity and only graduating projects into installed totals once credible timing confirmation is obtained.
Data Validation & Update Cycle
Model outputs are cross-checked against independent signals, including published capacity totals, known tender outcomes, and year-over-year change patterns that would be hard to justify if they were wrong. When a large variance appears, it is flagged, traced back to the underlying assumption, and then either corrected or explained in notes before sign-off.
A multi-step review is followed, where another analyst re-checks definitions, unit consistency, and year mapping, and then exceptions are discussed until they are resolved. The report is refreshed annually, and interim updates are made when material events occur, such as major regulatory changes or visible commissioning delays. Right before delivery, a final pass is done so clients receive the latest updated view.
Mordor Intelligence's Israel Renewable Energy Market Sizing Compared With Other Published Estimates
Published market sizes for Israel renewable energy do not always match because the market can be measured in different units, and the boundary between installed assets and the broader value chain is not treated the same way. Differences in base year selection and what gets counted as operational versus planned can also move the number.
By tracking installed capacity additions, grid-connection status, and annual unit consistency, Mordor Intelligence keeps the estimate tied to what is already operating in Israel, instead of mixing in spending flows, development activity, or long-horizon build plans that may not materialize on time.
Benchmark comparison
| Source | Market Size | Gaps in Research Methodology |
|---|---|---|
| Mordor Intelligence | USD 7.47 B (2025) | |
| Global Consultancy A | USD 0.19 B (2024) | Uses a value-based framing that can reflect spending and value-chain activity, which often excludes already-installed capacity accounting and applies different price or revenue assumptions. |
| Industry Association B | USD 8.88 B (2026) | Reports a forward year and may include projects expected to connect within the year, which shifts the count versus a strict installed-at-year-start capacity treatment. |
The spread in the table is mainly explained by unit choice, year alignment, and whether the measure reflects installed capacity or broader economic value. Using a repeatable set of capacity and commissioning checks makes the result easier to trace back to real build activity, and it also keeps updates straightforward when new plants connect or timelines slip.


Key Questions Answered in the Report
What is the forecasted capacity for Israel's renewable sector by 2031?
Installed renewable capacity is projected to reach 21.05 GW by 2031, growing at a 18.84% CAGR from 2026.
How dominant is solar within Israel's generation mix?
Solar technologies held 88.85% of installed renewable capacity in 2025 and remain the core pillar of growth.
Why are corporate PPAs significant in Israel?
Deregulation in 2024 allowed direct PPAs, letting corporates lock in discounted power prices and meet carbon goals while driving new project finance.
What role does storage play in upcoming projects?
The 2025 tender awarded 1.5 GW of batteries, positioning storage as a grid-relief valve and a profit center for co-located solar.
How is land scarcity being addressed?
Developers deploy agrivoltaics, floating solar, and higher-density panel layouts to boost yield per hectare and navigate land constraints.
Which international companies are active in Israel's market?
EDF Renewables, Ormat Technologies, and several Chinese equipment suppliers have secured tenders or supplied hardware alongside domestic champions.
Page last updated on:





