Market Overview
| Study Period | 2021 - 2031 |
|---|---|
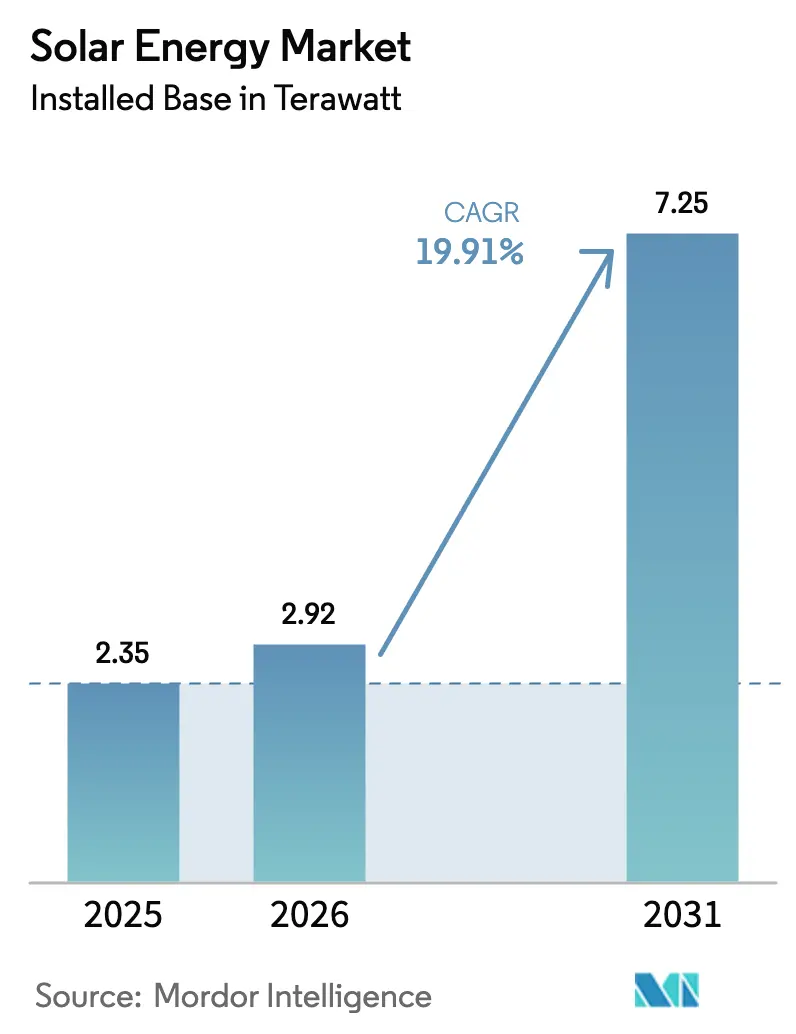
| Market Volume (2026) | 2.92 Terawatt |
| Market Volume (2031) | 7.25 Terawatt |
| Growth Rate (2026 - 2031) | 19.91% CAGR |
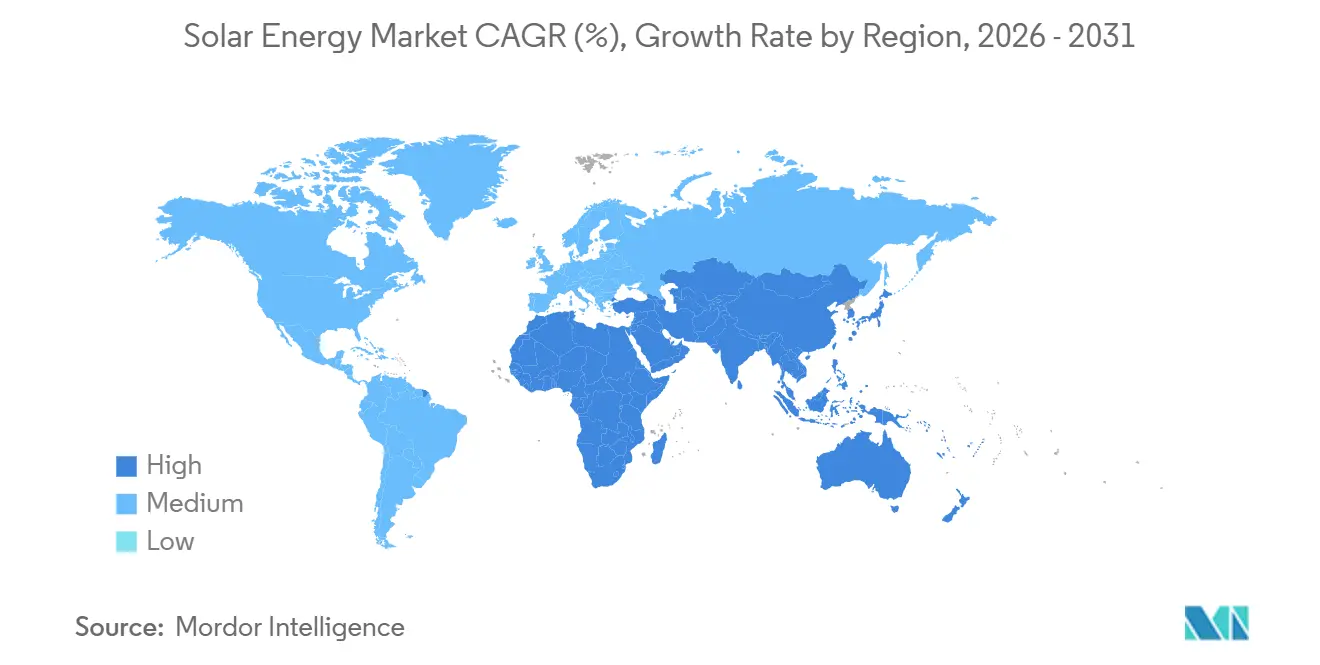
| Fastest Growing Market | Middle East and Africa |
| Largest Market | Asia-Pacific |
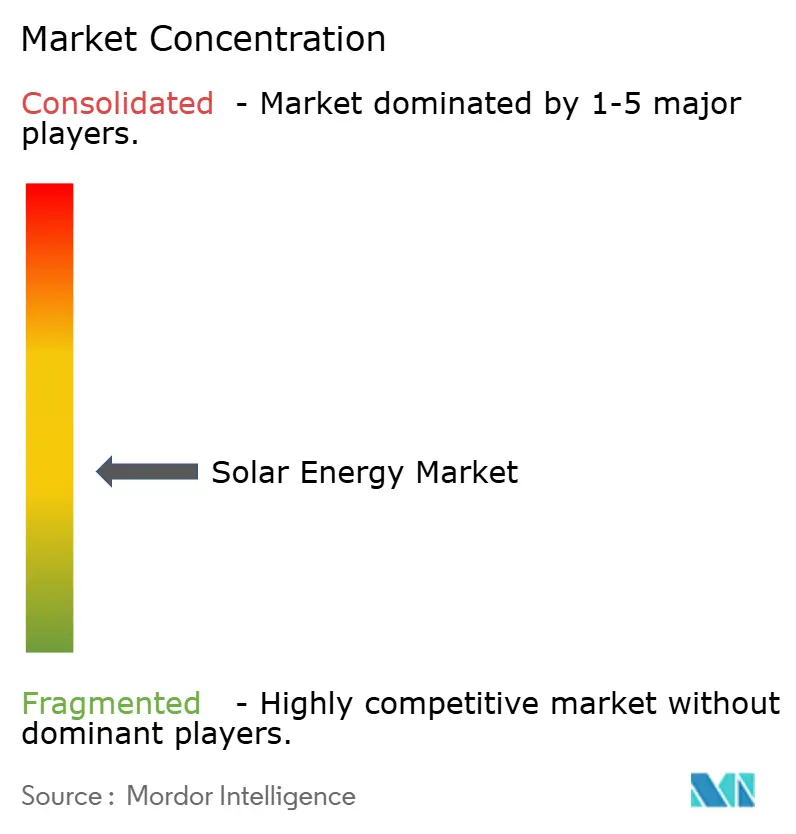
| Market Concentration | Medium |
Major Players *Disclaimer: Major Players sorted in no particular order Image © Mordor Intelligence. Reuse requires attribution under CC BY 4.0. | |
Solar Energy Market Analysis by Mordor Intelligence
The Solar Energy Market size in terms of installed base is expected to increase from 2.35 Terawatt in 2025 to 2.92 Terawatt in 2026 and reach 7.25 Terawatt by 2031, growing at a CAGR of 19.91% over 2026-2031.
This Solar Energy market size expansion is anchored in utility-scale photovoltaic projects that now match or beat wholesale power prices across most sunny regions, while U.S. tax credits under the Inflation Reduction Act (IRA) have sparked USD 110 billion of domestic manufacturing pledges. Corporate power-purchase agreements (PPAs) from data-center operators, the growing pipeline of photovoltaic-battery hybrids, and accelerated policy support in land-constrained countries all reinforce a virtuous cycle of falling costs and expanding demand. Asia-Pacific remains the center of gravity, yet the Middle East and Africa are emerging as the fastest-growing territories as solar projects are bundled with green-hydrogen export schemes. Crystalline-silicon modules still dominate, but incremental advances such as tunnel-oxide passivated-contact (TOPCon) cells and bifacial designs continue to lift conversion efficiency. On-grid projects keep the lion’s share of deployment, although off-grid systems for rural electrification are gaining momentum as pay-as-you-go financing spreads through mobile-money platforms.
Key Report Takeaways
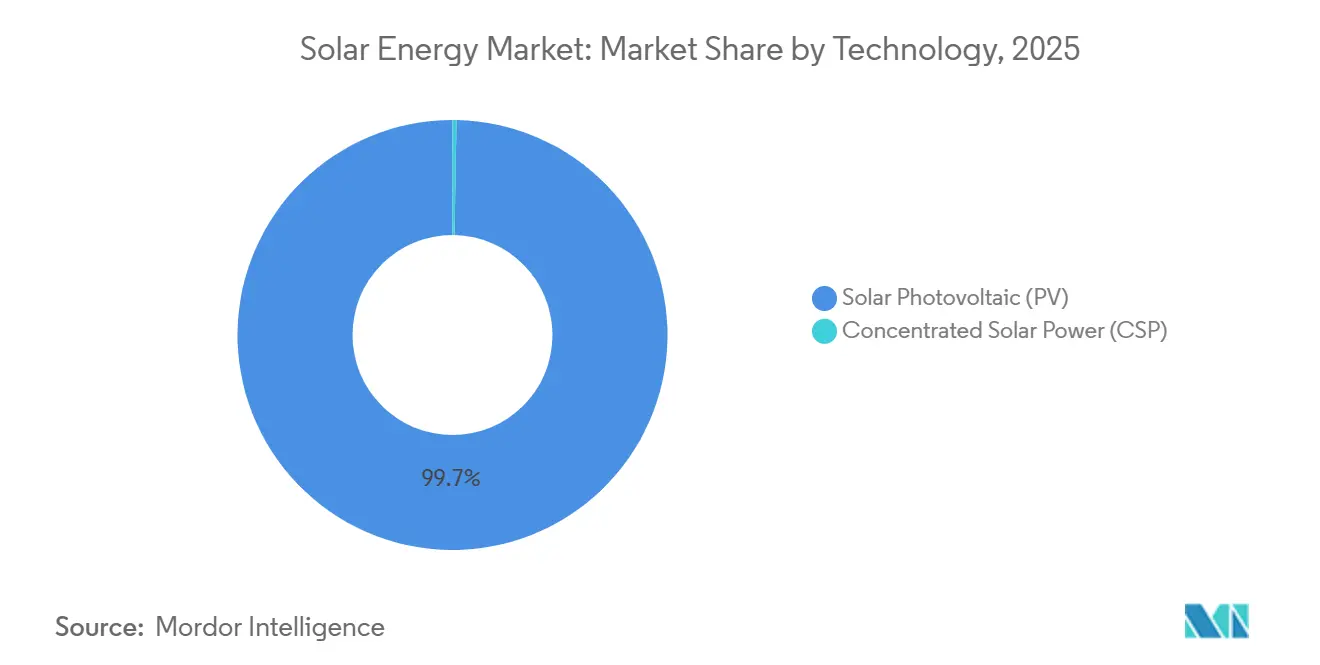
- By technology, photovoltaic (PV) held 99.7% of the Solar Energy market share in 2025, and is projected to have the highest growth at a 19.92% CAGR to 2031.
- By grid type, on-grid systems captured 89.3% of the Solar Energy market share in 2025; off-grid installations are forecast to expand at 22.2% CAGR through 2031.
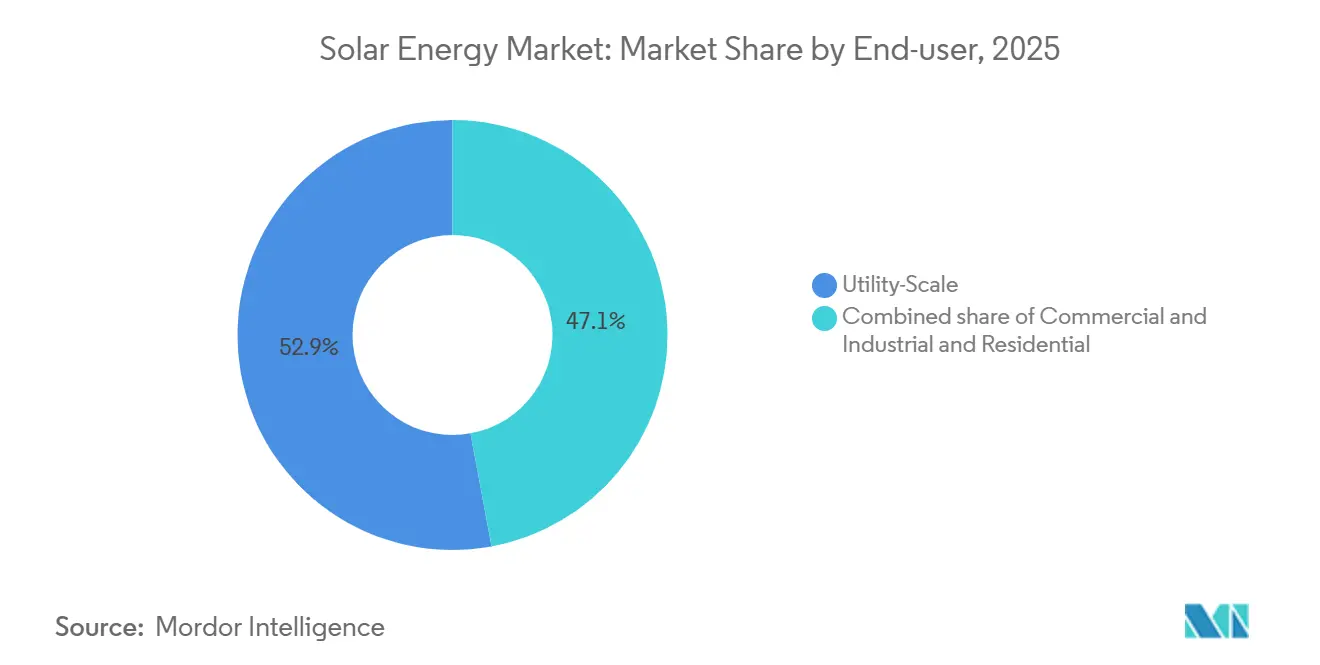
- By end user, utility-scale plants led with 52.9% of capacity in 2025, whereas residential rooftop installations are projected to advance at a 21.5% CAGR to 2031.
- By geography, Asia-Pacific commanded 64.5% of global capacity in 2025; the Middle East and Africa region is poised for the fastest growth at 22.7% CAGR through 2031.
Note: Market size and forecast figures in this report are generated using Mordor Intelligence’s proprietary estimation framework, updated with the latest available data and insights as of January 2026.
Global Solar Energy Market Trends and Insights
Drivers Impact Analysis*
| Driver | (~) % Impact on CAGR Forecast | Geographic Relevance | Impact Timeline |
|---|---|---|---|
| Utility-Scale PV Cost Parity Accelerating Procurement in Asia | 3.5% | Asia-Pacific core, spill-over to Middle East & Africa | Medium term (2-4 years) |
| IRA-Driven Domestic Manufacturing Boom in the United States | 2.8% | North America, secondary impact on Europe supply chains | Long term (≥ 4 years) |
| Corporate PPA Demand from AI & Data Centers in Europe & North America | 2.2% | North America & Europe, early adoption in APAC | Short term (≤ 2 years) |
| Hybrid PV-Battery Projects Unlocking New Revenue Stacking Models | 2.0% | Global, with concentration in U.S., Australia, Germany | Medium term (2-4 years) |
| Floating & Agrivoltaic Installations Opening Constrained-Land Markets | 1.5% | Japan, Netherlands, France, South Korea | Long term (≥ 4 years) |
| Green Hydrogen-Linked Solar Mega-Projects in Middle East | 1.8% | Middle East & North Africa, pilot projects in Australia | Long term (≥ 4 years) |
| Source: Mordor Intelligence | |||


Utility-Scale PV Cost Parity Accelerating Procurement in Asia
Benchmark auctions in India and China cleared below USD 0.03 per kilowatt-hour in 2024, undercutting legacy coal tariffs by up to 30%. Record annual additions of 330 GW in China and 18 GW in India in 2024 testify to this economics-driven surge. Provincial grid operators responded by fast-tracking ultra-high-voltage transmission corridors linking western resource hubs to eastern load centers. Southeast Asian planners canceled 12 GW of coal projects during 2024-2025 after levelized solar costs fell beneath regulated thermal power prices, further redirecting capital toward photovoltaic-battery hybrids.
IRA-Driven Domestic Manufacturing Boom in the United States
Section 45X production credits under the IRA provide USD 0.04 per watt for cells and USD 0.07 per watt for finished modules, tilting the cost curve toward local fabrication. By end-2024, U.S. module capacity quadrupled to 42 GW across 110 projects, and Qcells secured a USD 1.45 billion federal loan guarantee to develop America’s first fully integrated polysilicon-to-module line in more than a decade. First Solar enlarged its Ohio complex to 6 GW and broke ground on a 3.5 GW Alabama plant that leverages cadmium-telluride modules exempt from polysilicon bottlenecks. Although domestic polysilicon output met only one-quarter of 2024 module demand, front-loaded capital spending before the credit sunsets in 2032 should narrow this gap.
Corporate PPA Demand from AI & Data Centers in Europe & North America
Hyperscale operators executed more than 25 GW of solar PPAs in 2024 as artificial-intelligence workloads pushed data-center power use up by 40%. Microsoft’s 10.5 GW umbrella deal with Brookfield Asset Management and Google’s 2 GW Nevada-Texas build-to-transfer program illustrate a market pivot toward multi-gigawatt, multi-year offtakes that de-risk merchant exposure. Developers are now structuring hybrid solar-battery projects offering 24/7 matched supply to satisfy granular carbon-neutral targets, eclipsing interest in pure merchant photovoltaic capacity.[1]Brookfield Asset Management, “Microsoft and Brookfield Sign Record Renewable PPA,” brookfield.com
Hybrid PV-Battery Projects Unlocking New Revenue Stacking Models
Hybrid plants reached 49 GW of PV paired with 11.1 GWh of batteries across 469 sites by end-2024. Co-located systems capture energy-arbitrage margins and frequency-regulation fees while trimming curtailment by 85% in high-penetration grids, according to laboratory field measurements.[2]National Renewable Energy Laboratory, “Hybrid PV-Battery Performance in High-Penetration Grids,” nrel.gov In the United States, 72% of 2024 stationary-storage installations were associated with solar, reflecting the dual tax-credit structure that rewards integrated assets. Australia’s 300 MW Victorian Big Battery and Germany’s 2.5 GW Innovation Tender awards confirm that this stacked-revenue template is portable and bankable.
Restraints Impact Analysis*
| Restraint | (~) % Impact on CAGR Forecast | Geographic Relevance | Impact Timeline |
|---|---|---|---|
| Supply-Chain Over-reliance on Chinese Polysilicon & Wafers | -1.2% | Global, acute in North America & Europe | Short term (≤ 2 years) |
| Grid Congestion & Curtailment in High-Penetration Provinces | -1.5% | China (Xinjiang, Gansu), Spain (Andalusia), U.S. (CAISO, ERCOT) | Medium term (2-4 years) |
| Rising Interest-Rate Environment Impacting Residential Solar Economics | -1.8% | United States, Europe (Germany, Netherlands) | Short term (≤ 2 years) |
| Scarcity of Rare-Earth Metals for High-Efficiency Thin-Films | -0.8% | Global, concentrated in CdTe and CIGS supply chains | Long term (≥ 4 years) |
| Source: Mordor Intelligence | |||
Supply-Chain Over-Reliance on Chinese Polysilicon & Wafers
China accounts for 80-90% of polysilicon and 95% of wafer output, with Xinjiang supplying 45% of global capacity. The Uyghur Forced Labor Prevention Act detained over 3,800 solar cargoes at U.S. ports through 2024, creating 8–12-week delivery delays.[3]U.S. Customs and Border Protection, “Uyghur Forced Labor Prevention Act Statistics,” cbp.gov European tariff investigations followed in 2024, adding more uncertainty. Spot polysilicon prices collapsed from USD 35 per kg in 2022 to USD 6–8 per kg in 2024 as new Chinese capacity came online, crushing margins for many tier-one module makers. Western diversification efforts, including QCells’ Georgia polysilicon line and REC Silicon’s Washington restart, will still meet less than 15% of ex-China demand by 2027.
Grid Congestion & Curtailment in High-Penetration Provinces
National curtailment in China stayed near 3% in 2024, yet Xinjiang and Gansu exceeded 8% because transmission build-out lags generation. Spain curtailed 1,200 GWh of renewables in 2024 after interconnection permits in Andalusia and Extremadura stalled more than 5 GW of projects.[4]Red Eléctrica de España, “Renewable Curtailment 2024,” ree.es In the U.S., California curtailed 2.4 million MWh of solar in 2024, and Texas queue wait times topped four years, pushing developers toward battery co-location to protect yields.
*Our forecasts treat driver/restraint impacts as directional, not additive. The impact forecasts reflect baseline growth, mix effects, and variable interactions.
Segment Analysis
By Technology: PV Dominance Drives Innovation
Solar photovoltaic commanded 99.7% of the Solar Energy market share in 2025. Falling levelized costs, down 4.6% in 2024, place PV ahead of gas peakers and onshore wind in many regions. The segment is expected to grow at 19.92% CAGR through 2030, powered by efficiency gains such as perovskite-silicon tandem cells hitting 31.6% laboratory performance. Multi-junction designs could push conversion rates beyond 40%, opening space-constrained rooftops and vehicle-integrated niches. Concentrated Solar Power retained a marginal footprint because solar-plus-battery hybrids now achieve half its levelized cost in high-irradiance regions.
Silicon’s cost trajectory keeps eroding the addressable space for thermal tower and trough projects, though CSP still serves process-heat niches. The Solar Energy industry continues to funnel R&D toward wafer-thinning, metallization-free contacts, and back-contact architectures to inch efficiencies closer to 25% across mainstream product lines.


By Grid Type: Off-Grid Uptick in Emerging Regions
On-grid assets represented 89.3% of 2025 capacity, but off-grid systems are expected to expand at 22.2% CAGR to 2031 as governments target universal access. Kenya alone deployed 2.5 million pay-as-you-go kits by 2024, and Nigeria added more than 300 MW of solar mini-grids that bypass costly transmission extensions. Development-finance institutions extended USD 1.2 billion to mini-grid programs across 15 countries in 2024, with battery storage now standard for 24-hour supply. Rising electricity tariffs in parts of South Asia further tilt new capacity toward community-scale solar rather than diesel.
By End User: Residential Growth Hinges on Policy Certainty
Utility-scale projects held 52.9% of the 2025 market thanks to auction-driven procurement at costs below USD 0.03 per kWh. Residential installations, though battered by high rates in 2024, are still projected to achieve a 21.5% CAGR to 2031 as financing eases and self-consumption rules mature in emerging markets. Commercial and industrial rooftops showed resilience, growing 17% in 2024 because corporate buyers monetized both energy savings and renewable-certificate revenue streams.
Geography Analysis
Asia-Pacific retained 64.5% of installed capacity in 2025. China’s cumulative fleet surpassed 800 GW after adding 330 GW in 2024, with Shandong, Henan, and Jiangsu registering the highest provincial totals. India reached 90 GW, catalyzed by domestic manufacturing incentives that underwrote 40 GW of new factory commitments. Japan, South Korea, and Australia collectively added another 35 GW, with floating, agrivoltaic, and hybrid models compensating for land scarcity and grid bottlenecks.
The Middle East and Africa Solar Energy market is projected to register a 22.7% CAGR through 2031. Saudi Arabia’s 4 GW NEOM, the United Arab Emirates’ 2 GW Al Dhafra project, and Egypt’s 3.6 GW Suez Canal pipeline anchor this upswing, complemented by a surge in African off-grid kits that passed 5 million households by 2024.
North America installed 35 GW in 2024, dominated by 32 GW in the United States, where IRA incentives and state renewable portfolio standards converged. Texas led with 8.5 GW, while California followed at 6.2 GW despite rising curtailment. Canada’s 2.8 GW addition leaned on Alberta’s merchant market. Mexico’s progress stalled at 1.2 GW amid regulatory uncertainty.
Europe added 62 GW in 2024. Germany led with about 15 GW, Spain followed with nearly 9 GW but wrestled with interconnection backlogs, and Poland installed 6 GW driven by small-scale prosumers. The EU’s Net-Zero Industry Act set a target of 30 GW of localized manufacturing by 2030; however, only 8 GW of projects had broken ground by year-end 2024.

Competitive Landscape
The top ten module vendors supplied roughly 65% of 2024 shipments, reflecting a moderately concentrated Solar Energy market. LONGi, JinkoSolar, and Trina Solar each shipped more than 40 GW but grappled with single-digit gross margins after polysilicon oversupply dragged prices below USD 0.11 per watt. Vertically integrated producers continue to backstop earnings by moving further upstream into wafer and ingot production.
First Solar’s cadmium-telluride line held around 5% global share yet dominated the thin-film niche. IRA production credits and independence from polysilicon imports allowed the firm to scale U.S. capacity toward 9.5 GW by 2026. In the balance-of-system arena, Huawei and Sungrow controlled nearly one-third of global inverter volume, while Nextracker led trackers with shipments exceeding 10 GW and a healthy backlog into 2027.
Strategic moves during 2025-2026 included Qcells’ vertically integrated Georgia complex, JinkoSolar’s rapid TOPCon capacity upgrades, and Nextracker’s expansion of U.S. steel-supply agreements that shortened delivery cycles for trackers serving domestic projects. Emerging disruptors such as Oxford PV’s perovskite tandems and Maxeon’s high-efficiency back-contact panels are courting premium rooftop and space-constrained segments but must validate long-term field reliability before mass uptake.
Solar Energy Industry Leaders
LONGi Green Energy Technology
JinkoSolar Holding
Trina Solar
Canadian Solar
First Solar
- *Disclaimer: Major Players sorted in no particular order

Recent Industry Developments
- May 2025: Meta signed two PPAs with AES for 650 MW of solar to run data centers in Texas and Kansas, adding to Meta’s 12 GW renewable portfolio.
- May 2025: Heelstone Renewable Energy bought Valor Infrastructure’s 190 MWp PV pipeline in Texas, lifting its U.S. platform above 5 GW.
- May 2025: Zeo acquired Heliogen to integrate thermal storage into its residential solar offer.
- May 2025: Summit Ridge Energy purchased a 40 MW Illinois community-solar bundle from Arena Renewables, enough to power 5,000 homes.


Research Methodology Framework and Report Scope
Market Definitions and Key Coverage
Our study defines the global solar energy market as all grid-tied and certified off-grid photovoltaic (PV) and concentrated solar power (CSP) plants whose cumulative installed capacity is operational worldwide. Capacity is measured in gigawatts and reflects the asset base, not module sales or electricity revenues.
Scope exclusion: Solar thermal water heaters and manufacturing equipment are excluded.
Segmentation Overview
- By Technology
- Solar Photovoltaic (PV)
- Concentrated Solar Power (CSP)
- By Grid Type
- On-Grid
- Off-Grid
- By End-User
- Utility-Scale
- Commercial and Industrial (C&I)
- Residential
- By Component (Qualitative Analysis)
- Solar Modules/Panels
- Inverters (String, Central, Micro)
- Mounting and Tracking Systems
- Balance-of-System and Electricals
- Energy Storage and Hybrid Integration
- By Geography
- North America
- United States
- Canada
- Mexico
- Europe
- United Kingdom
- Germany
- France
- Spain
- Nordic Countries
- Russia
- Rest of Europe
- Asia-Pacific
- China
- India
- Japan
- South Korea
- Malaysia
- Thailand
- Indonesia
- Vietnam
- Australia
- Rest of Asia-Pacific
- South America
- Brazil
- Argentina
- Colombia
- Rest of South America
- Middle East and Africa
- Saudi Arabia
- United Arab Emirates
- South Africa
- Egypt
- Rest of Middle East and Africa
- North America
Detailed Research Methodology and Data Validation
Primary Research
Mordor analysts interviewed independent power producers, EPC firms, grid planners, and regulators in Asia-Pacific, North America, Europe, and MENA. Their insights confirmed commissioning dates, curtailment risks, and module ASP movement, letting us align model assumptions with field reality.
Desk Research
We opened with free, authoritative datasets such as IEA PV statistics, SolarPower Europe outlooks, IRENA inventories, customs shipment logs, and national energy ministry bulletins. Paid repositories, D&B Hoovers for financials, Dow Jones Factiva for project news, and Questel for patent alerts, back-checked corporate footprints and technology flows. A second sweep captured auction results, battery attachment rates, and IRA tax filings that reveal real build schedules and price curves. Many additional open records were reviewed to corroborate figures.
Market-Sizing & Forecasting
We start top-down from 2024 cumulative capacity, layer projected annual builds drawn from policy targets, auction pipelines, and historic utilization, then run selective bottom-up checks (supplier roll-ups and sampled ASP × MW). Key variables include module price decline, grid-connection queue length, battery coupling share, carbon-price trends, and utility-scale share. A multivariate regression extends these drivers to 2030, while scenario analysis tests upside from green-hydrogen demand. Local data gaps are bridged with regional intensity factors.
Data Validation & Update Cycle
Outputs pass peer review; variance flags trigger re-runs against independent tallies. Reports refresh every twelve months, with interim updates after material policy or price shifts, and a final analyst sweep before release.
Why Mordor's Solar Energy Baseline Earns Decision-Makers' Trust
Published estimates differ because firms track dissimilar metrics, vintage years, and price paths. Our capacity-based lens, refreshed with real-time policy and auction data, provides a consistently up-to-date view.
Key gap drivers include revenue-only scopes, older baselines, and untested ASP trajectories.
Benchmark comparison
| Market Size | Anonymized source | Primary gap driver |
|---|---|---|
| 2.35 thousand GW (2025) | Mordor Intelligence | |
| USD 368.66 billion (2025) | Global Consultancy A | value scope, PV-only, conservative build rate |
| USD 273.00 billion (2024) | Trade Journal B | mixes equipment sales and generation income, older baseline |
As the table shows, by centering on clearly defined capacity and continuously refreshed drivers, Mordor Intelligence offers a transparent, reproducible baseline decision-makers can rely on.


Key Questions Answered in the Report
What was the global installed capacity of solar power in 2026?
The Solar Energy market reached 2.92 terawatt of installed capacity in 2026.
How fast is utility-scale solar expected to grow compared with residential rooftop systems?
Utility-scale plants dominate additions, but residential rooftops are forecast for a robust 21.5% CAGR through 2031 once financing costs ease.
Which region is adding capacity most rapidly after 2026?
The Middle East and Africa lead with a projected 22.7% CAGR as mega-projects bundle solar with green-hydrogen production.
How is the Inflation Reduction Act affecting U.S. solar manufacturing?
Section 45X credits of up to USD 0.07 per watt have spurred 42 GW of new U.S. module capacity announcements and reopened domestic polysilicon lines.
Why are hybrid solar-battery projects gaining traction?
Co-located batteries enable energy-arbitrage, capacity payments, and curtailment reduction, improving project returns versus standalone photovoltaic assets.
Page last updated on:


