Agrivoltaics Market Size and Share
Market Overview
| Study Period | 2021 - 2031 |
|---|---|
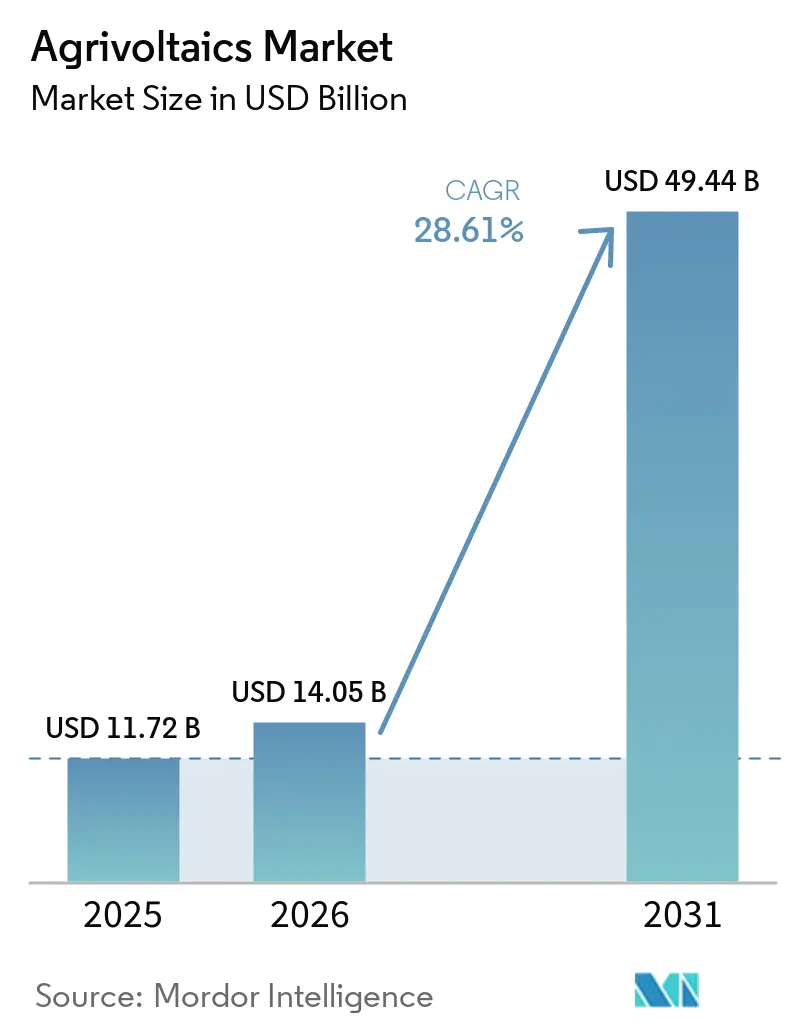
| Market Size (2026) | USD 14.05 Billion |
| Market Size (2031) | USD 49.44 Billion |
| Growth Rate (2026 - 2031) | 28.61% CAGR |
| Fastest Growing Market | Asia Pacific |
| Largest Market | Europe |
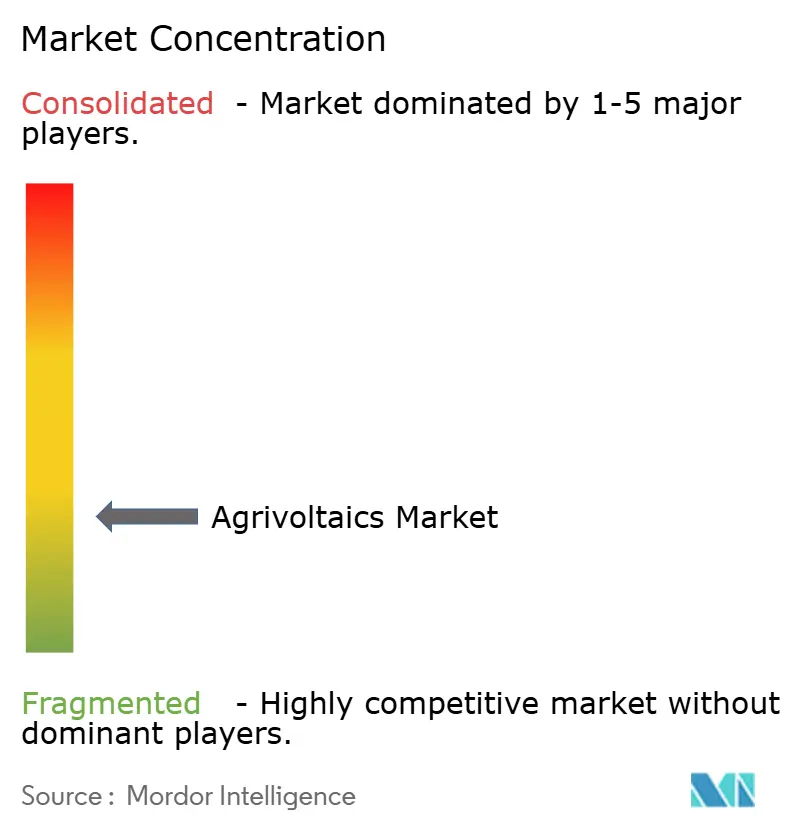
| Market Concentration | Low |
Major Players
*Disclaimer: Major Players sorted in no particular order Image © Mordor Intelligence. Reuse requires attribution under CC BY 4.0. |
|
Agrivoltaics Market Analysis by Mordor Intelligence
The Agrivoltaics Market size is expected to grow from USD 11.72 billion in 2025 to USD 14.05 billion in 2026 and is forecast to reach USD 49.44 billion by 2031 at 28.61% CAGR over 2026-2031.
Rising feed-in-tariff premiums in Europe, sustained subsidy programs across the Asia-Pacific, and a 15% decline in bifacial module prices between 2024 and 2026 continue to narrow the levelized-cost gap with conventional solar.[1]PV-MAGAZINE.COM, “Bifacial Solar Modules: Price Trends and Market Outlook 2024-2026,” pv-magazine.com Developers increasingly view dual-use projects as a hedge against land-acquisition risk, while lenders recognize the stabilized cash flows that crop-yield conditions embed in long-term power-purchase agreements.[2]CLEARNINGSTELLE-EEG-KWKG.DE, “EEG 2023 Guidance,” clearingstelle-eeg-kwkg.dePolicy clarity in Germany, France, Japan, and South Korea has shortened permitting cycles by up to six months, funneling institutional capital toward large portfolios rather than one-off pilots.[3]LEGIFRANCE, “Decree 2024-318,” legifrance.gouv.fr As mounting-system costs fall and carbon-credit revenues become bankable, the agrivoltaics market is positioned to undercut conventional ground-mount solar in several land-scarce regions during the forecast period.
Key Report Takeaways
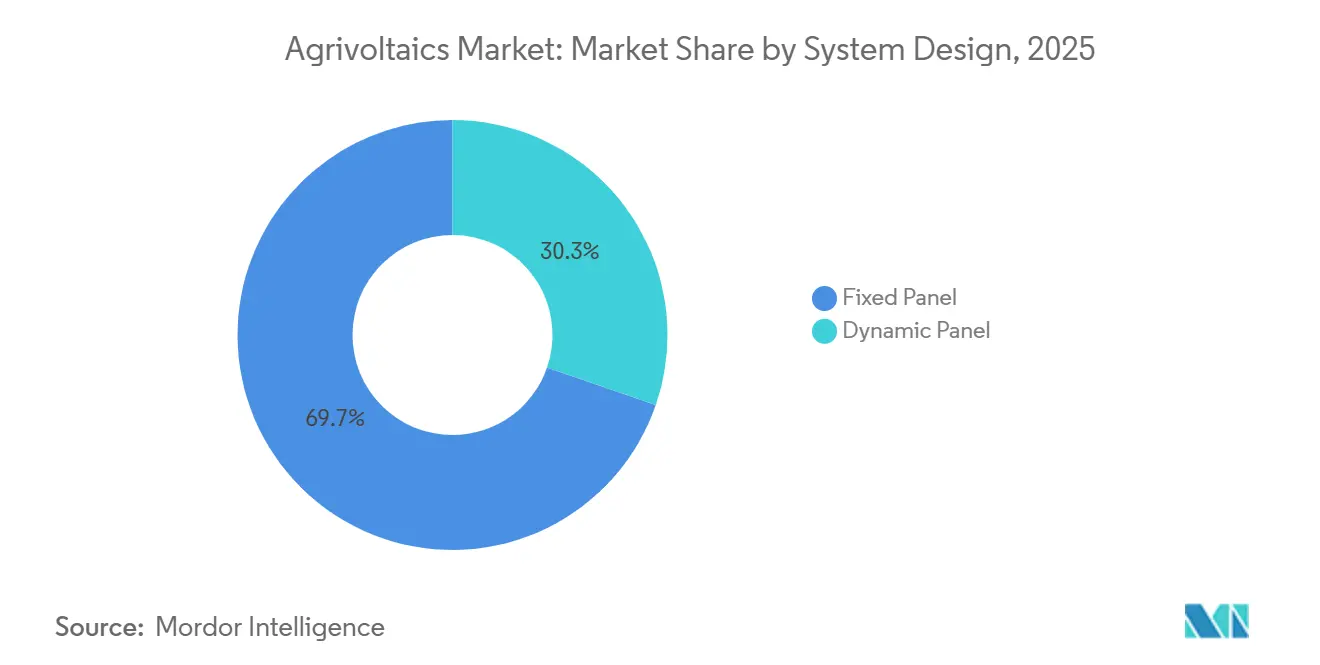
- By system design, fixed-panel arrays commanded 69.72% of 2025 sales, while dynamic tracking systems are expected to grow at a 29.44% CAGR thanks to specialty-crop adoption.
- By technology, bifacial modules led with 75.29% of 2025 revenue and are projected to advance at a 29.07% CAGR through 2031, the fastest rate among module types.
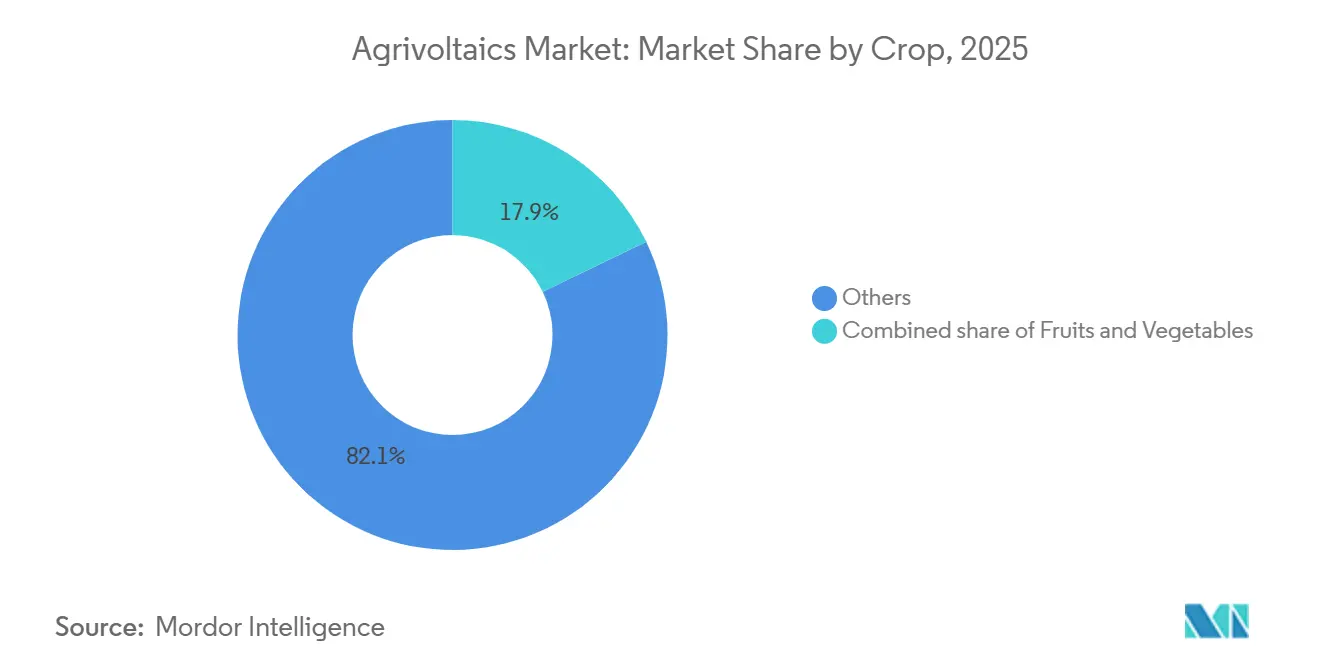
- By crop, the “Others” category, primarily pasture, held an 82.13% agrivoltaics market share in 2025, whereas vegetables are expected to post a 31.65% CAGR to 2031 on demonstrated yield premiums.
- By placement, ground-mounted installations captured 97.45% of the 2025 value and will maintain leadership even as greenhouse integrations are expected to grow at a 28.65% CAGR.
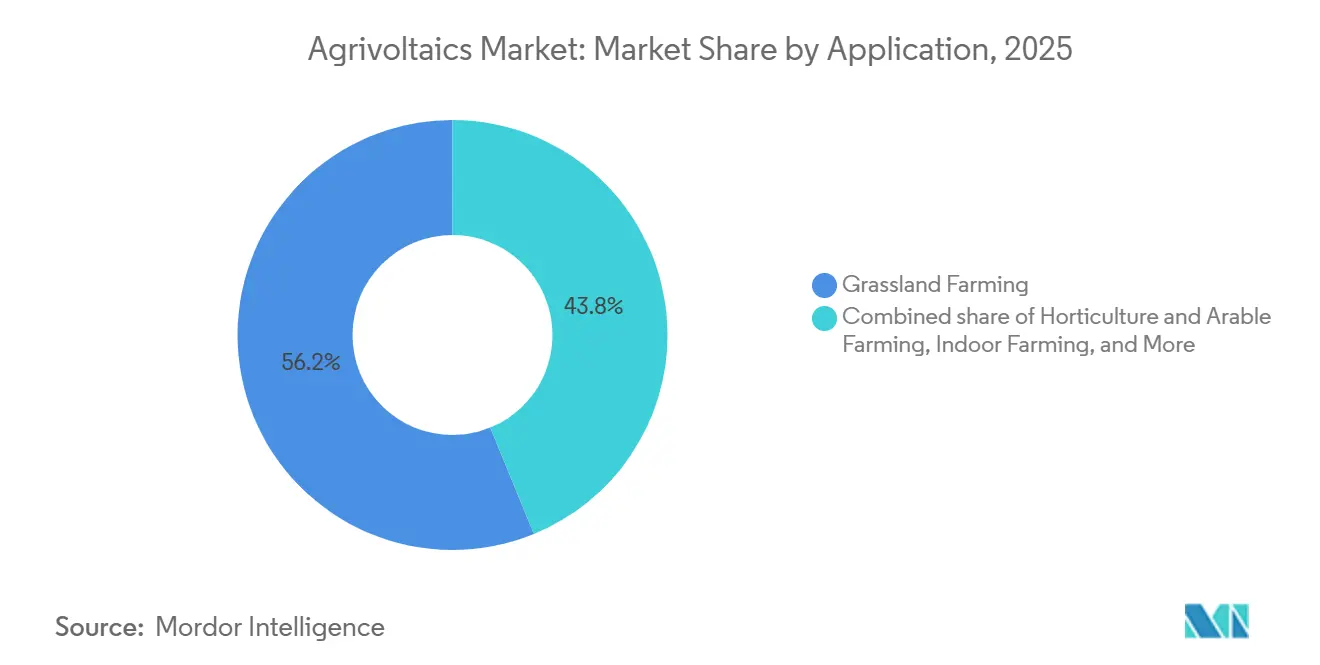
- By application, grassland farming accounted for 56.18% of the agrivoltaics market size in 2025; horticulture and arable farming is expected to grow at 29.73% CAGR.
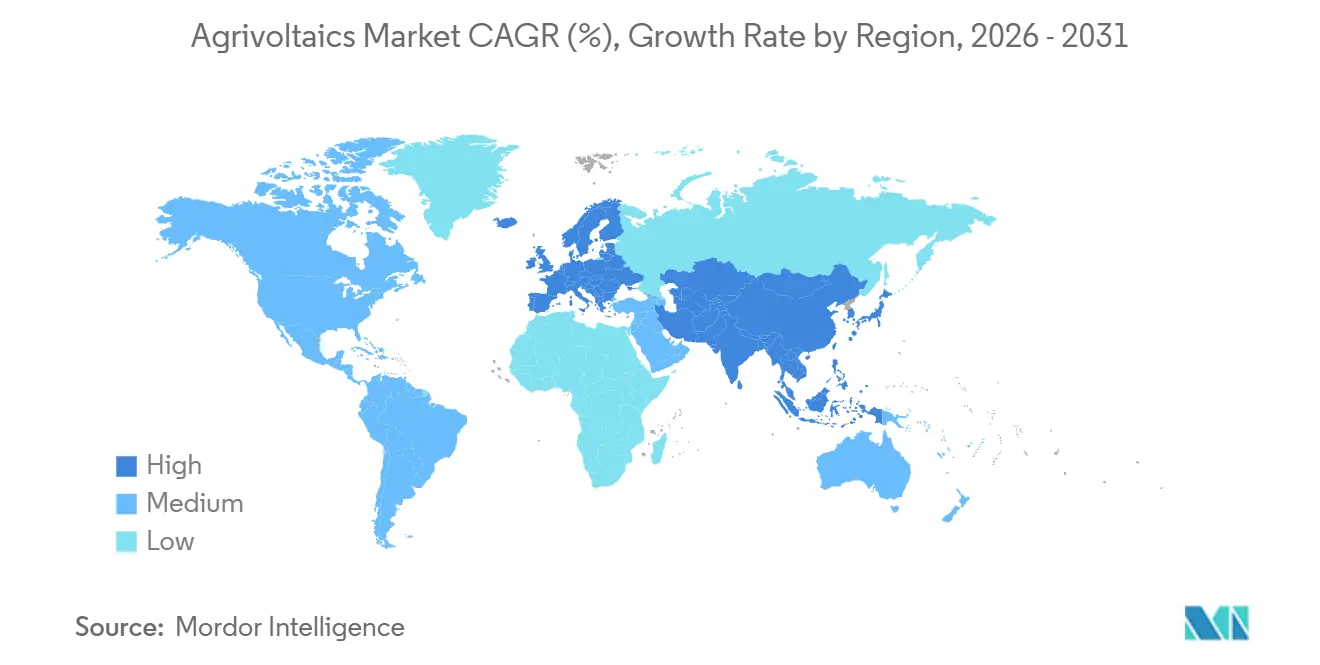
- By geography, Asia-Pacific dominated with 68.86% revenue in 2025, while Europe is projected to record the quickest regional expansion at 29.95% through 2031.
Note: Market size and forecast figures in this report are generated using Mordor Intelligence’s proprietary estimation framework, updated with the latest available data and insights as of 2026.
Global Agrivoltaics Market Trends and Insights
Drivers Impact Analysis*
| Driver | (~) % Impact on CAGR Forecast | Geographic Relevance | Impact Timeline |
|---|---|---|---|
| Subsidy-linked FiT programs | 6.20% | Europe, Japan, South Korea, India | Medium term (2-4 years) |
| Declining bifacial PV module prices | 5.80% | Global | Short term (≤ 2 years) |
| Dual-use land mandates in land-scarce nations | 4.90% | Japan, Singapore, Netherlands, South Korea | Long term (≥ 4 years) |
| Crop micro-climate yield premiums ≥ 10% | 4.30% | Mediterranean and temperate zones | Medium term (2-4 years) |
| Carbon-credit stacking in agri-solar PPAs | 3.10% | EU, North America, Australia | Long term (≥ 4 years) |
| Ag-insurance discounts from reduced evapotranspiration | 2.40% | North America, Australia, Mediterranean Europe | Medium term (2-4 years) |
| Source: Mordor Intelligence | |||
Subsidy-Linked FiT Programs (EU, Asia)
Revised tariff rules in Germany, France, Japan, and India guarantee price premiums for arrays that preserve minimum crop yields, compressing financing spreads by 50–75 basis points and attracting pension funds to the agrivoltaics market. German projects receive a 1.2 euro-cent bonus per kilowatt-hour, and India’s PM-KUSUM scheme reimburses 30% of capital cost for feeder-level solarization, encouraging farmer collectives to pool landholdings.[4]Ministry of New and Renewable Energy, Government of India, "PM-KUSUM Scheme: Component C Guidelines and Subsidy Structure," mnre.gov.in. France mandates third-party audits that certify “positive agronomic impact,” steering capital away from speculative conversions. Japan now requires annual farm-income statements, removing projects that abandon cultivation from feed-in eligibility. Collectively, these mechanisms reduce revenue volatility and scale the agrivoltaics market across diverse cropping systems.
Declining Bifacial PV Module Prices
Polysilicon oversupply enabled module manufacturers to cut average bifacial prices from USD 0.18 per watt in 2024 to USD 0.15 per watt in Q1-2026, a 15% slide that disproportionately benefits elevated agrivoltaic structures. Rear-side irradiance capture lifts array output by 10–25%, offsetting both shading losses and incremental mounting costs. Fraunhofer’s APV-RESOLA trial achieved a land-equivalent ratio of 1.6 by combining lettuce and potato cultivation with 5-meter-high bifacial panels, validating superior resource use. East-west vertical designs pioneered by Next2Sun spread generation across morning and evening demand peaks while allowing livestock to graze unimpeded. Continued price convergence with monofacial modules will further entrench bifacial dominance within the agrivoltaics market.
Dual-Use Land Mandates in Land-Scarce Nations
Japan, Singapore, and the Netherlands restrict ground-mount solar on prime farmland unless agricultural output is maintained, effectively requiring agrivoltaics for new projects above certain capacities. Singapore’s rooftop pilots employ semi-transparent modules that transmit 30–50% of incoming light, optimizing photosynthesis in vertical farms. South Korea’s Renewable Energy 3020 Plan earmarks 2 GW of agrivoltaics by 2030 with preferential grid access for dual-use arrays. The Dutch policy U-turn in 2024, which limits projects on prime soils, illustrates the delicate balance between food security and renewable targets. Such mandates sustain momentum in the agrivoltaics market even where land values are high.
Crop Micro-Climate Yield Premiums ≥ 10%
Field trials show lettuce, berries, and rice gaining 10–18% yield under 30–40% shade, driven by cooler canopy temperatures and lower evapotranspiration. Sun’Agri’s sensor-driven trackers moderating grape temperatures in Provence improved sugar-acid balance and reduced heat-stress losses. Japanese rice paddies with 3-meter-high panels recorded higher grain fill rates during extreme-heat events. These micro-climate benefits raise land-equivalent ratios above 1.3, strengthening the economic case for the agrivoltaics market. Precision-ag tools such as drone imagery and soil-moisture probes further optimize shade scheduling and irrigation, unlocking additional gains.
Restraints Impact Analysis*
| Restraint | (~) % Impact on CAGR Forecast | Geographic Relevance | Impact Timeline |
|---|---|---|---|
| High capex vs. ground-mount PV | -3.8% | Global | Short term (≤ 2 years) |
| Unclear agri-zoning regulations | -2.6% | North America, Southeast Asia, parts of EU | Medium term (2-4 years) |
| Module soiling from crop residues | -1.5% | Semi-arid regions, APAC rice-growing areas, Mediterranean Europe | Short term (≤ 2 years) |
| Agronomic-PV labor skill gap | -1.3% | Global, with acute shortages in rural North America, Eastern Europe, ASEAN | Medium term (2-4 years) |
| Source: Mordor Intelligence | |||
High Capex vs. Ground-Mount PV
Elevated support structures, reinforced foundations, and wider row spacing raise agrivoltaic capital costs 20–40% above conventional solar, translating to USD 1.2 million–1.4 million per MW in the United States versus USD 900,000–1.0 million for standard arrays. Lower panel density reduces energy yield per hectare, extending payback by up to two years unless agricultural revenue closes the gap. Lenders add 50–100 basis-point risk premiums because of limited dual-use track records, especially outside Europe and Japan. Prefabricated screw-pile foundations from vendors such as Zimmermann PV-Stahlbau cut installation time 20–30%, trimming labor outlays. Wider adoption of standardized mounting kits is crucial to narrowing the capex delta that currently constrains the agrivoltaics market.
Unclear Agri-Zoning Regulations
County-level authorities in the United States apply inconsistent definitions of “agricultural use,” resulting in permitting delays of 6–12 months and escalating legal costs. British Columbia caps photovoltaic coverage on farmland at 5%, whereas Alberta allows up to 50%, illustrating intra-national divergence that confuses investors. Southeast Asian developers rely on one-off exemptions because national frameworks have yet to codify agrivoltaic standards, slowing project pipelines. The Netherlands tightened prime-soil restrictions in 2024, stranding several advanced projects. Until IEC 63163 and emerging ISO guidelines gain traction, regulatory fragmentation will keep a brake on the agrivoltaics market growth trajectory.
*Our forecasts treat driver/restraint impacts as directional, not additive. The impact forecasts reflect baseline growth, mix effects, and variable interactions.
Segment Analysis
By System Design: Dynamic Panels Gain Traction in High-Value Crops
Dynamic-tracking arrays represented 30.28% of 2025 installations, yet they are expanding at 29.44% CAGR, more than triple the growth of fixed structures, because vineyard and orchard operators prize real-time tilt control that aligns shade levels with crop phenology. Fixed panels still hold a dominant agrivoltaics market share because row-crop growers value simplicity and lower O&M expenses.
Sensor-driven trackers improve grape sugar-acid ratios and reduce sunburn in almonds, validating higher capital outlays and attracting specialty-crop investors. German and French tariff bonuses for “adaptive” agrivoltaics further sweeten returns. However, the labor shortage of dual-skilled technicians slows deployment velocity, prompting trade associations to fund vocational programs that merge photovoltaic maintenance with precision-agriculture curricula. As automation and training scale, dynamic designs will raise their agrivoltaics market share across premium horticultural zones.


By Technology: Bifacial Dominance Reinforced by Albedo Gains
Vertical east-west arrays maximize morning and evening generation, aligning with residential demand peaks while protecting livestock pathways. Semi-transparent modules remain niche because lower conversion efficiency offsets the benefit of higher transmittance in greenhouse applications. Automated dry-brush cleaning systems under trial in Spain and Australia aim to curb 3–5% annual soiling losses from harvest dust. As bifacial prices converge with monofacial, technology risk for investors declines, cementing bifacial leadership inside the agrivoltaics market.
By Crop: Vegetables Surge on Yield Premiums and Market Demand
Growers leverage shorter crop cycles to repay incremental capex more quickly than orchard or pasture systems. Tomato greenhouses with translucent PV roofs cut blossom-end-rot losses and extend harvest windows by up to four weeks, raising gross margins. Conversely, wheat and maize continue to show 5–15% yield penalties under comparable shade, limiting adoption among broad-acre farmers. As carbon-neutral food commitments proliferate in retail supply chains, vegetable producers are expected to drive the next wave of agrivoltaics market expansion.
By Placement: Ground-Mounted Systems Dominate on Agronomic Access
Ground-mounted arrays accounted for 97.45% of 2025 deployments and will continue to anchor the agrivoltaics market size because elevated clearances accommodate standard farm machinery without sacrificing arable area. Inter-row widths calibrated to tractor tread minimize crop damage and soil compaction.
Greenhouse and shading-net integrations remain experimental but show promise for high-value leafy greens in urban settings such as Singapore and the Netherlands, where land premiums justify capital intensity. Screw-pile foundations mitigate soil disruption in high-rainfall zones, while robotic weeders now navigate beneath 4-meter tables, lowering O&M labor costs. As semi-transparent module efficiency improves, greenhouse installations could capture a rising slice of the agrivoltaics market, though ground mounts will stay dominant through 2031.
By Application: Horticulture and Arable Farming Accelerate on Specialty Crops
Grassland systems held 56.18% of the agrivoltaics market size in 2025, thanks to low management complexity and compatibility with grazing. Yet horticulture and arable farming are forecast to post a 29.73% CAGR as specialty growers chase shade-driven quality gains and electricity revenue stacking.
Pollinator-friendly projects seeded with native flowers meet EU biodiversity mandates, smoothing community acceptance for large arrays. Indoor vertical farms layer translucent panels atop multilevel racks, reclaiming rooftop real estate in urban microclimates. Carbon-credit monetization tied to soil-organic-carbon enrichment in cover-cropped orchards offers a further income stream. Collectively, these factors rebalance application shares, pushing horticulture toward one-third of the agrivoltaics market by 2031.
Geography Analysis
Asia-Pacific generated 68.86% of global revenue in 2025 as China, India, Japan, and South Korea embedded dual-use requirements and capital subsidies in their rural and energy plans. China’s state-owned utilities deployed large pilot clusters in Henan and Shandong to relieve grid congestion while stabilizing farm incomes. India’s PM-KUSUM Component C released USD 1.4 billion for feeder-level solarization, accelerating smallholder adoption by offsetting 30% of capex. Japanese prefectures grant FIT eligibility only to farms preserving 80% of historical crop output, a safeguard that locks in dual-use standards. South Korea’s 2 GW target under Renewable Energy 3020 provides guaranteed interconnection priority for agrivoltaic arrays over ground-mount alternatives.
Europe is projected to record the fastest regional advance at 29.95% CAGR through 2031 after Germany’s EEG 2023 and France’s Decree 2024-318 created premium-tariff categories for compliant projects. Germany’s 2025 auction cleared 1.1 GW of agrivoltaic capacity at EUR 0.08 per kWh, drawing both utilities and local farmer cooperatives. France mandates third-party audits verifying “positive agronomic impact,” which guides capital toward genuine dual-use ventures. Spain and Italy retrofit vineyards and orchards for shade management, while Nordic trials explore vertical bifacial arrays optimized for low-sun angles. EU biodiversity credits further sweeten project economics, accelerating adoption in pollinator corridors.
North America, South America, and the Middle East & Africa remain emerging zones with scattered pilots and regulatory fragmentation. U.S. county-level inconsistency adds 6–12 months to permitting, although California’s pending statewide guidelines may standardize definitions by 2027. Canada’s provincial divergence mirrors the U.S. mosaic, while Mexico’s auctions still treat agrivoltaics as conventional solar, limiting upside. Brazil’s Resolution 1,059 unlocked net-metering eligibility for dual-use systems, seeding early projects in São Paulo. Saudi Arabia and the UAE evaluate agrivoltaics for water-saving benefits but lack formal rules, slowing bank financing. As policy frameworks mature, these regions could add a sizable increment to the global agrivoltaics market size beyond 2028.

Competitive Landscape
The sector is highly fragmented; no company exceeds 5% of installed capacity, yielding a low concentration profile. Utilities form joint ventures with ag-tech specialists to bridge agronomy and power-engineering skill sets, such as the 200 MW EDF Renewables-Canadian Solar platform spanning France and Spain. BayWa r.e. positions itself as a vertically integrated provider from land origination to O&M, appealing to landowners seeking turnkey execution.
Mounting-system innovators differentiate through design: Next2Sun’s vertical bifacial architecture unlocks grazing compatibility in grasslands, and Sun’Agri’s dynamic tracking optimizes shade for vineyards, both commanding premium pricing. Research institutes such as Fraunhofer ISE license machine-learning algorithms that balance crop growth and power yield, giving adopters a technical edge.
Standards development will further influence competitiveness. IEC 63163 is on track for 2027 publication, and lenders are expected to require compliance certificates for project finance. Local cooperatives in Germany and France leverage community ownership models that streamline land access and social acceptance, advantages not easily replicated by multinationals. Technology voids persist in greenhouse PV integration, pollinator habitats, and floating agro-solar, offering entry points for niche specialists.
Agrivoltaics Industry Leaders
-
Sun’Agri
-
BayWa r.e.
-
Enel Green Power
-
Next2Sun
-
EDF Renewables
- *Disclaimer: Major Players sorted in no particular order

Recent Industry Developments
- March 2025: The Energy and Resources Institute (TERI) presented new research and practical tools to advance the adoption of agrivoltaics (AgriPV) in India during a thematic track at the silver jubilee edition of the World Sustainable Development Summit 2026. The thematic track, titled “Accelerating AgriPV in India: From Pilots to Policy-Led Scale-Up,” featured the launch of two research reports, a project development framework, and a digital decision-support tool designed to support the growth of India’s AgriPV ecosystem.
- November 2025: GCL launches a 76 MW agrivoltaics project in Germany, featuring 146,000 bifacial modules. The project employs elevated structures, AI-driven management, and high land-use efficiency, establishing itself as Germany’s largest agrivoltaic installation.
- August 2025: Zenith Energy acquires a 10 MWp agrivoltaic development project in Lazio, Italy. The project combines agriculture with solar energy generation and is expected to achieve ready-to-build status within a year, aligning with Zenith’s strategic solar portfolio expansion in Italy.
- August 2025: Array Technologies reports advancements in agrivoltaics through the Lime Kiln project, which integrates sheep grazing and pollinator habitats. The company also expands its capabilities with APA Solar’s acquisition, focusing on durable tracker technologies to support diverse land-use solar projects.
- January 2025: Octopus Energy acquires OX2 France, an agrivoltaics developer with a 450 MW project pipeline. This acquisition supports Octopus’ €1 billion French clean-energy investment plan and accelerates the deployment of agriPV projects that integrate solar power with agricultural productivity across various French regions.


Global Agrivoltaics Market Report Scope
The agrivoltaics market encompasses the global industry dedicated to the development, implementation, and commercialization of agrivoltaic systems. These systems enable dual-use land applications, combining solar photovoltaic (PV) energy generation with agricultural activities such as crop cultivation, livestock grazing, or horticulture on the same land area.
The agrivoltics market is segmented into system design, technology, crop, application, and geography. By system design, the market is divided into dynamic panels and fixed panels. By technology, the market is segmented into monofacial, bifacial, and translucent. By crop, the market is divided into fruits, vegetables, and others. By placement, the market is divided into greenhouses, ground-mounted, and shading nets. By application, the market is divided among grassland farming, horticulture and arable farming, indoor farming and others. By geography, the market is divided among North America, Europe, Asia-Pacific, South America, the Middle East, and Africa. The market sizes and forecasts are provided in terms of value (USD).
| Dynamic Panel |
| Fixed Panel |
| Monofacial |
| Bifacial |
| Translucent |
| Fruits |
| Vegetables |
| Others |
| Greenhouses |
| Ground Mounted |
| Shading Nets |
| Grassland Farming |
| Horticulture and Arable Farming |
| Indoor Farming |
| Pollinator Habitat |
| North America | United States |
| Canada | |
| Mexico | |
| Europe | Germany |
| United Kingdom | |
| France | |
| Italy | |
| NORDIC Countries | |
| Russia | |
| Rest of Europe | |
| Asia-Pacific | China |
| India | |
| Japan | |
| South Korea | |
| ASEAN Countries | |
| Rest of Asia-Pacific | |
| South America | Brazil |
| Argentina | |
| Rest of South America | |
| Middle East and Africa | Saudi Arabia |
| United Arab Emirates | |
| South Africa | |
| Egypt | |
| Rest of Middle East and Africa |
| By System Design | Dynamic Panel | |
| Fixed Panel | ||
| By Technology | Monofacial | |
| Bifacial | ||
| Translucent | ||
| By Crop | Fruits | |
| Vegetables | ||
| Others | ||
| By Placement | Greenhouses | |
| Ground Mounted | ||
| Shading Nets | ||
| By Application | Grassland Farming | |
| Horticulture and Arable Farming | ||
| Indoor Farming | ||
| Pollinator Habitat | ||
| By Geography | North America | United States |
| Canada | ||
| Mexico | ||
| Europe | Germany | |
| United Kingdom | ||
| France | ||
| Italy | ||
| NORDIC Countries | ||
| Russia | ||
| Rest of Europe | ||
| Asia-Pacific | China | |
| India | ||
| Japan | ||
| South Korea | ||
| ASEAN Countries | ||
| Rest of Asia-Pacific | ||
| South America | Brazil | |
| Argentina | ||
| Rest of South America | ||
| Middle East and Africa | Saudi Arabia | |
| United Arab Emirates | ||
| South Africa | ||
| Egypt | ||
| Rest of Middle East and Africa | ||


Key Questions Answered in the Report
What is the projected global value for agrivoltaics by 2031?
The agrivoltaics market is forecast to reach USD 49.44 billion by 2031.
Which region will grow fastest through 2031?
Europe is expected to expand at a 29.95% CAGR, the quickest regional pace.
Why are bifacial panels preferred in dual-use projects?
Rear-side irradiance capture boosts energy yield by 10 - 25%, offsetting higher mounting costs.
How do dynamic tracking systems benefit specialty crops?
Real-time tilt control moderates heat stress during sensitive phenological stages, improving quality and yields.
What major policy supports agrivoltaics adoption in India?
The PM-KUSUM Component C program offers a 30% capital subsidy for solarization paired with crop production.
How does agrivoltaics lower insurance costs for growers?
Shade reduces evapotranspiration, prompting insurers to cut premium rates by up to 8% for covered crops.
Page last updated on:


