Market Overview
| Study Period | 2021 - 2031 |
|---|---|
| Forecast Data Period | 2026 - 2031 |
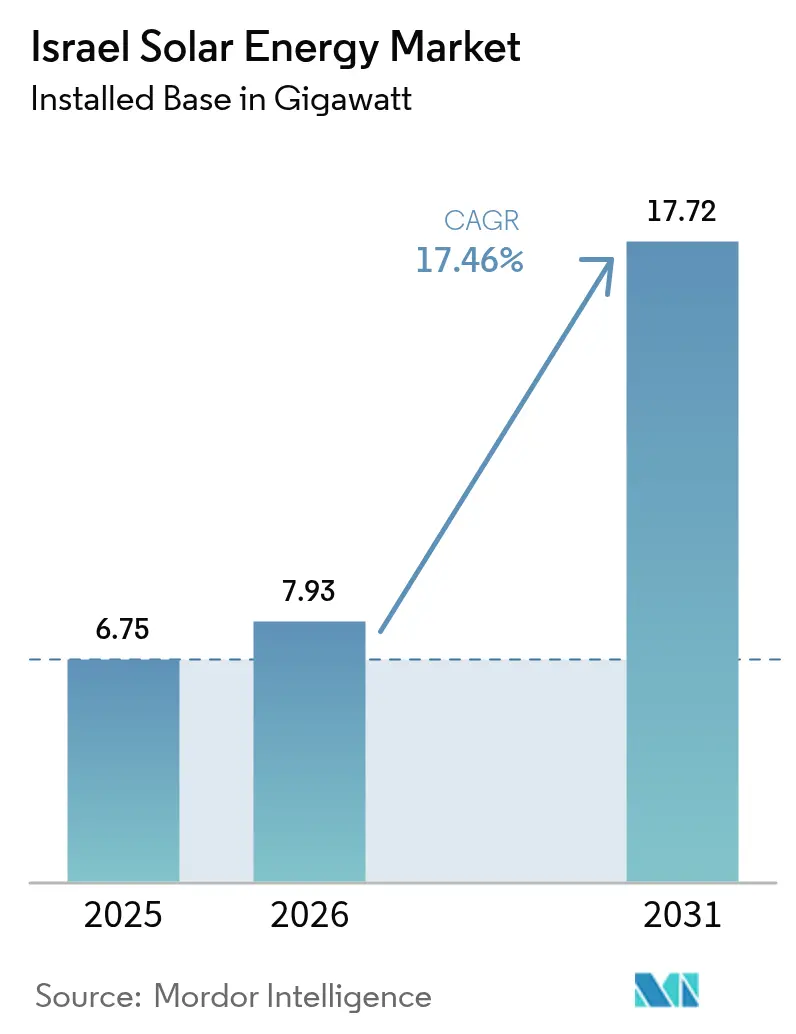
| Base Year Market Size (2025) | 6.75 gigawatt |
| Market Volume (2026) | 7.93 gigawatt |
| Market Volume (2031) | 17.72 gigawatt |
| Growth Rate (2026 - 2031) | 17.46% CAGR |
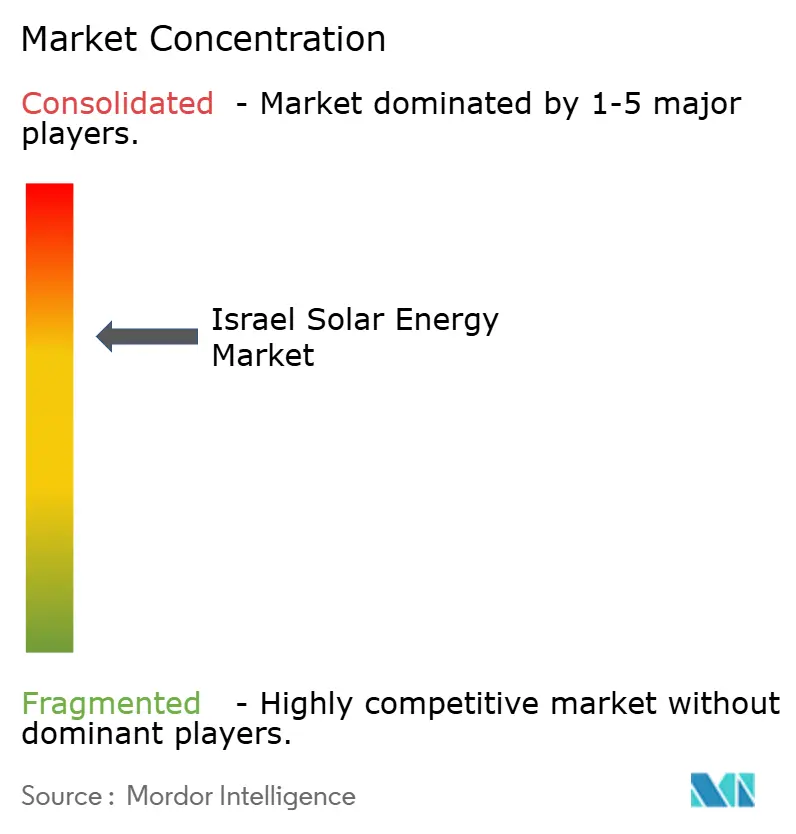
| Market Concentration | Medium |
Major Players *Disclaimer: Major Players sorted in no particular order Image © Mordor Intelligence. Reuse requires attribution under CC BY 4.0. | |
Israel Solar Energy Market Analysis by Mordor Intelligence
Israel Solar Energy Market size in 2026 is estimated at 7.93 gigawatt, growing from 2025 value of 6.75 gigawatt with 2031 projections showing 17.72 gigawatt, growing at 17.46% CAGR over 2026-2031.
The Israel solar energy market's growth trajectory reflects an accelerated pivot from natural gas toward renewable baseload generation, supported by Israel's 2023 Climate Law, bi-annual competitive tenders, and record-low power purchase agreement (PPA) prices. Utility-scale developers benefit from module costs below USD 0.10 per watt, while rooftop installers enjoy tariff reforms that shorten residential payback to seven–nine years. Meanwhile, declining lithium-ion prices are catalyzing the deployment of four-hour storage systems, signaling a shift toward hybrid PV-plus-battery configurations. Grid upgrades, rooftop mandates, and emerging agrivoltaic pilots collectively widen the addressable demand pool even as geopolitical risk premiums and transmission bottlenecks temper short-term build-out.
Key Report Takeaways
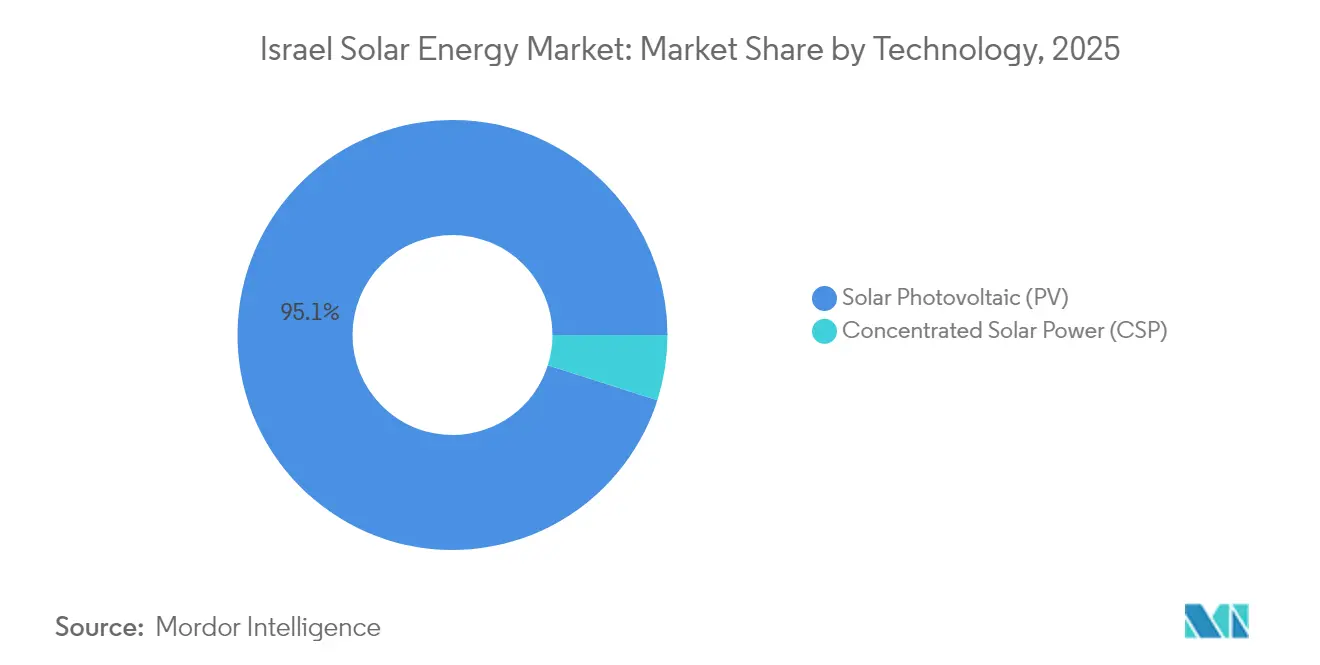
- By technology, Solar Photovoltaic commanded 95.10% of % Israel solar energy market share in 2025; Concentrated Solar Power remains a niche with dispatchable thermal storage.
- By grid type, On-Grid assets accounted for 98.55% of capacity in 2025, whereas Off-Grid installations are projected to expand at a 19.25% CAGR through 2031.
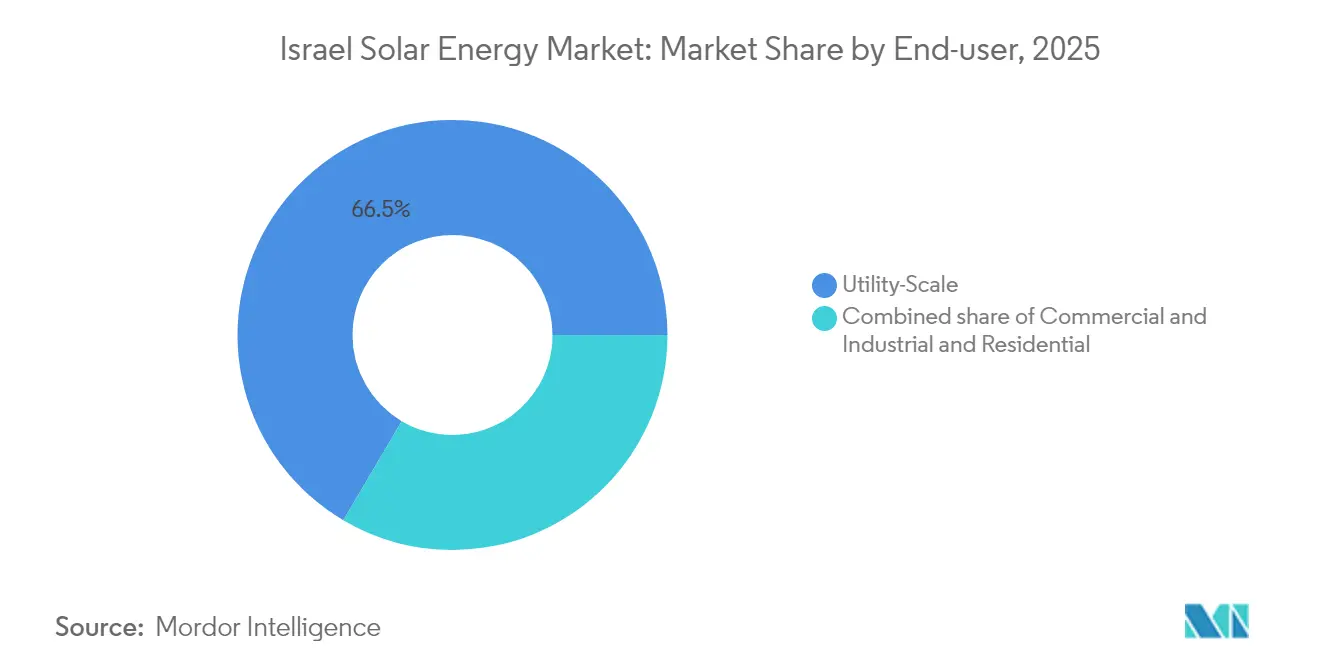
- By end-user, utility-scale plants held 66.52% of the Israel solar energy market size in 2025; the residential segment is forecast to grow fastest at 18.74% CAGR to 2031.
- By region, the Negev and Arava Valley captured 71.30% of installed capacity in 2025, while Tel Aviv metropolitan rooftops recorded the highest incremental additions.
- Enlight Renewable Energy, Doral, Nofar Energy, Shikun & Binui, and EDF Renewables controlled about 54.35% of installed capacity in 2025.
Note: Market size and forecast figures in this report are generated using Mordor Intelligence’s proprietary estimation framework, updated with the latest available data and insights as of 2026.
Israel Solar Energy Market Trends and Insights
Drivers Impact Analysis*
| Driver | (~) % Impact on CAGR Forecast | Geographic Relevance | Impact Timeline |
|---|---|---|---|
| Government FITs & competitive tenders | 4.20% | National, Negev & Arava zones | Short term (≤ 2 years) |
| High solar irradiance in Negev Desert | 3.10% | Negev, Arava Valley | Long term (≥ 4 years) |
| 2050 decarbonization & gas-to-RES transition | 5.30% | National | Long term (≥ 4 years) |
| Declining PV & battery costs | 3.80% | Nationwide | Medium term (2-4 years) |
| Mandatory rooftop-PV code (2024) | 2.90% | Urban metros | Medium term (2-4 years) |
| Agrivoltaics & desal-coupling initiatives | 1.40% | Negev farms, coastal plants | Long term (≥ 4 years) |
| Source: Mordor Intelligence | |||
Government FITs & Competitive Tenders Reshape Utility Economics
Competitive auctions replaced static feed-in tariffs, pushing PPA prices to ILS 0.07 per kWh in 2024 and establishing subsidy-free grid parity for the Israel solar energy market.[1]Israel Electricity Authority, “Tender Results July–August 2024,” electricity-authority.gov.il A February 2025 award covering 1.5 GW of four-hour storage further underscores policy commitment to firming variable solar output. Local-content clauses now embedded in tender rules are carving out work for domestic engineering firms even as modules remain import-dependent. Bi-annual auction cadence targeting 2 GW per year through 2027 sustains a robust pipeline, although smaller cooperatives face consolidation pressure as low bids favor developers with balance-sheet depth.
High Solar Irradiance in Negev Desert Anchors Utility-Scale Concentration
Annual irradiance of 2,200–2,500 kWh/m² in the Negev enables PV capacity factors above 23% and concentrates most future capacity south of Be’er Sheva. Single-axis tracking, bifacial modules, and TOPCon cells optimize harvests and soften land-use footprints. Despite the headline 250 MW Ashalim CSP complex, PV-plus-battery hybrids dominate new project design because they deliver similar evening dispatch at one-sixth the capital cost. Environmental safeguards, wildlife corridors, and soil-preservation measures add permitting complexity but have not derailed large-scale tenders.
2050 Decarbonization & Gas-to-RES Transition Drives Policy Commitment
Israel’s Climate Law targets 50% emission cuts by 2030 and net-zero by 2050, positioning the Israel solar energy market as the primary replacement for gas-fired generation that supplied 63% of 2024 electricity.[2]Israel Meteorological Service, “Annual Solar Irradiance Data,” ims.gov.il The “Yellow Pathway” projects 77% solar penetration and 108 GW of PV by mid-century, implying a trebling of annual build rates and extensive grid-scale storage. Corporate PPAs are accelerating as EU carbon-border measures threaten exporters, while municipal targets such as Tel Aviv’s 100% clean power pledge amplify local demand.
Declining PV & Battery Costs Compress Payback Periods
Polysilicon prices fell to USD 6.50 /kg by late 2024, driving modules below USD 0.10 /W and pushing Israel's solar energy market size projects under USD 750 /kW for fixed-tilt arrays.[3]BloombergNEF, “2024 Solar and Storage Price Survey,” about.bnef.com Lithium-ion packs averaged USD 139 /kWh in 2024 and are on track for USD 113 /kWh in 2025, turning four-hour batteries into mainstream complements for peak shaving and ancillary services. Silicon-carbide inverters and waterless cleaning robotics further reduce operating costs, though SolarEdge's restructuring shows price competition is intense even for domestic technology champions.
Restraints Impact Analysis*
| Restraint | (~) % Impact on CAGR Forecast | Geographic Relevance | Impact Timeline |
|---|---|---|---|
| Grid congestion & limited transmission capacity | −3.7% | Negev & southern grid | Short term (≤ 2 years) |
| Land-use & environmental permitting hurdles | −2.4% | Negev Desert corridors | Medium term (2-4 years) |
| Geopolitical security-risk premium on financing | −1.8% | Nationwide | Short term (≤ 2 years) |
| Import-dependency for modules & BOS | −1.3% | National supply chain | Medium term (2-4 years) |
| Source: Mordor Intelligence | |||
Grid Congestion & Limited Transmission Capacity Constrain Deployment
Solar additions slowed to 900 MW in 2024 from 1.1 GW in 2023 as Negev interconnection queues lengthened. A NIS 20 billion (USD 5.4 billion) IEC plan to build 3,000 km of high-voltage lines by 2030 will ease constraints, yet four- to six-year construction timelines imply curtailment persists through 2027. Dynamic connection agreements mitigate risk but raise finance costs.
Land-Use & Environmental Permitting Hurdles Extend Project Timelines
Environmental-impact assessments, Bedouin land claims, and wildlife-corridor protections stretch utility-scale permitting to two–four years and add up to USD 50 /kW in extra costs. Water-use scrutiny for panel cleaning has accelerated the adoption of robotic systems that carry higher opex.
*Our forecasts treat driver/restraint impacts as directional, not additive. The impact forecasts reflect baseline growth, mix effects, and variable interactions.
Segment Analysis
By Technology: PV Dominates as CSP Remains a Dispatchable Niche
Solar Photovoltaic accounted for 95.10% Israel's solar energy market share in 2025 and will grow 17.83% CAGR to 2031 on unbeatable capex and continuous efficiency gains. Concentrated Solar Power's 250 MW Ashalim showcase validates six-hour dispatchability yet sits at USD 4,500 /kW, far above PV-battery hybrids. Bifacial and TOPCon modules now underpin most new bids, while perovskite-silicon tandem pilots explore 33% plus efficiencies for post-2028 rollouts.
Israel's solar energy market size for CSP is projected to stagnate below 1.05 GW through 2031 unless capacity payments emerge. Conversely, floating PV on reservoirs and wastewater ponds offers land-neutral expansion, delivering 5-8% higher yields from evaporative cooling despite pricier interconnections.


By Grid Type: On-Grid Still Commands, Off-Grid Advances for Resilience
On-Grid plants represented 98.55% of installed capacity in 2025 thanks to competitive tenders and streamlined PPA bankability. Off-Grid systems, encompassing IDF bases, kibbutz microgrids, and agricultural pumps, will expand 19.25% CAGR to 2031 as security and fuel-savings targets intensify. Lithium-ion pack prices under USD 113 /kWh by 2025 are critical for four-hour autonomy, while regulatory clarity on islanded microgrids remains a gap.
By End-User: Utility-Scale Leads as Residential Rooftop Gains Momentum
Utility-scale assets captured 66.52% of Israel's solar energy market size in 2025, leveraged by headline PPAs of ILS 0.07 /kWh. Residential rooftop growth accelerates under the 2024 mandate and tariff reform, with Tel Aviv residents installing systems 20% larger than the minimum to maximize tax rebates. Commercial & Industrial rooftops report sub-five-year paybacks, yet installer shortages and financing barriers for middle-income households could temper the steep 18.74% CAGR outlook.
Geography Analysis
The Negev-Arava belt hosts 71.30% of capacity in 2025 due to world-class irradiance and low land costs, but also endures the heaviest curtailment and permitting scrutiny. Coastal desalination corridors pursue solar-powered reverse-osmosis to hedge against volatile gas pricing. Urban centers in Tel Aviv, Jerusalem, and Haifa lead rooftop penetration, aided by expedited permits and property-tax incentives. Northern border regions deploy hybrid microgrids to trim diesel reliance, reflecting defense and resilience priorities.
Competitive Landscape
The Israel solar energy market is moderately concentrated: Enlight, Doral, Nofar, Shikun & Binui, and EDF Renewables together hold 55% of installed capacity. International entrants such as Greencells and BELECTRIC compete aggressively on EPC pricing, driving PPA rates to historic lows. Early adoption of bifacial and TOPCon technologies differentiates cost leaders, while SolarEdge retains a 40% share in the residential hardware segment despite a 64% revenue slump in 2024. Agrivoltaic pilots and desal-coupled projects present new white-space opportunities for both domestic developers and equipment makers.
Israel Solar Energy Industry Leaders
Shikun & Binui Ltd
EDF Renewables
Enlight Renewable Energy
Doral Energy
Nofar Energy
- *Disclaimer: Major Players sorted in no particular order

Recent Industry Developments
- February 2025: Israel Electricity Authority awarded 1.5 GW of four-hour lithium-ion storage at USD 49.41–74.20 /kWh, the nation’s largest battery tender
- August 2024: EDF Renewables won a 300 MW Dimona project at ILS 0.07 /kWh, 22% below prior records
- July 2024: EDF Renewables secured a 100 MW tender at identical pricing, reinforcing downward tariff trends.
- May 2024: Nofar Energy raised USD 115 million via bonds to fund a 200 MW Negev pipeline


Israel Solar Energy Market Report Scope
Solar energy is the heat and radiant light from the sun that can be harnessed through technologies such as solar power (used to generate electricity) and solar thermal energy (used for applications like water heating).
The Israeli solar energy market is segmented by Technology (Solar Photovoltaic (PV), Concentrated Solar Power (CSP)), by Grid Type (On-Grid, Off-Grid), by End-User (Utility-Scale, Commercial and Industrial (C&I), Residential), by Component (Qualitative Analysis) (Solar Modules/Panels, Inverters (String, Central, Micro), Mounting and Tracking Systems, Balance-of-System and Electricals, Energy Storage and Hybrid Integration). The market sizing and segment predictions have been based on installed capacity (MW).
By Technology
| Solar Photovoltaic (PV) |
| Concentrated Solar Power (CSP) |
By Grid Type
| On-Grid |
| Off-Grid |
By End-User
| Utility-Scale |
| Commercial and Industrial (C&I) |
| Residential |
By Component (Qualitative Analysis)
| Solar Modules/Panels |
| Inverters (String, Central, Micro) |
| Mounting and Tracking Systems |
| Balance-of-System and Electricals |
| Energy Storage and Hybrid Integration |
| By Technology | Solar Photovoltaic (PV) |
| Concentrated Solar Power (CSP) | |
| By Grid Type | On-Grid |
| Off-Grid | |
| By End-User | Utility-Scale |
| Commercial and Industrial (C&I) | |
| Residential | |
| By Component (Qualitative Analysis) | Solar Modules/Panels |
| Inverters (String, Central, Micro) | |
| Mounting and Tracking Systems | |
| Balance-of-System and Electricals | |
| Energy Storage and Hybrid Integration |


Key Questions Answered in the Report
How fast is installed capacity expected to grow in the Israel solar energy market?
Capacity is projected to climb from 7.93 GW in 2026 to 17.72 GW by 2031, reflecting a 17.46% CAGR.
Why are PPA prices in Israel now among the lowest globally?
Competitive auctions, high solar irradiance, and falling module costs pushed 2024 PPA bids to ILS 0.07 /kWh (USD 0.019 /kWh).
Which segment will expand the quickest through 2031?
Residential rooftop systems are forecast to grow at 18.74% CAGR, boosted by the 2024 mandatory-PV building code and higher net-metering rates.
What is the main obstacle to faster utility-scale build-out?
Grid congestion in the Negev and Arava regions delays connections and caused 4.2% curtailment of potential generation in 2024.
How are battery prices influencing project economics?
Lithium-ion pack prices dropped to USD 139 /kWh in 2024 and are projected to hit USD 113 /kWh in 2025, making four-hour storage viable for peak shaving and ancillary services.
Which technologies are developers favoring for new projects?
Bifacial TOPCon PV modules paired with four-hour lithium-ion batteries dominate current bids due to higher yield and lower levelized cost of energy.
Page last updated on:


