
Market Overview
| Study Period | 2021 - 2031 |
|---|---|
| Forecast Data Period | 2026 - 2031 |
| Base Year Market Size (2025) | 0.43 gigawatt |
| Market Volume (2026) | 0.55 gigawatt |
| Market Volume (2031) | 1.88 gigawatt |
| Growth Rate (2026 - 2031) | 27.94 % |
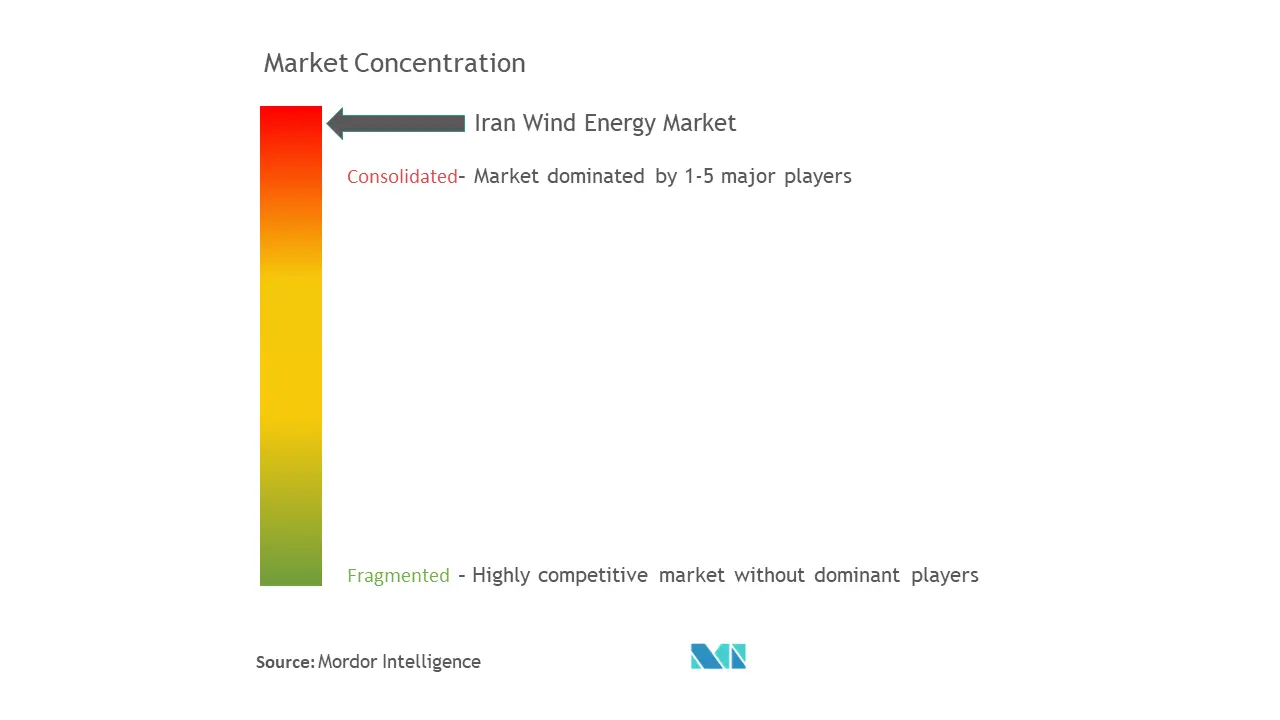
| Market Concentration | High |
Major Players *Disclaimer: Major Players sorted in no particular order Image © Mordor Intelligence. Reuse requires attribution under CC BY 4.0. | |
Iran Wind Energy Market Analysis by Mordor Intelligence
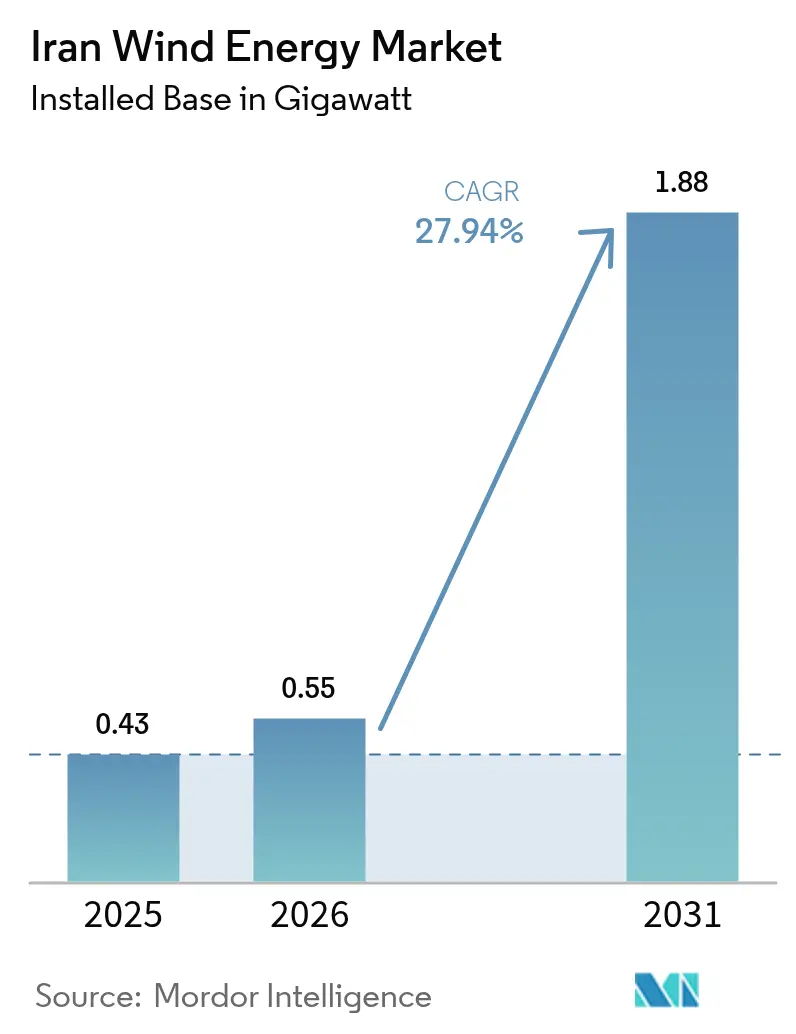
The Iran Wind Energy Market size was valued at 0.43 gigawatt in 2025 and estimated to grow from 0.55 gigawatt in 2026 to reach 1.88 gigawatt by 2031, at a CAGR of 27.94% during the forecast period (2026-2031).
Growth is propelled by a power-supply deficit above 20,000 MW that has forced rolling blackouts and pushed policy makers to fast-track renewable additions despite sanctions and capital scarcity. A guaranteed 9.5 ¢/kWh feed-in tariff for the first 4.5 years, followed by 20-year tradable PPAs on the Iran Energy Exchange, anchors investor revenue and offsets Rial volatility. Onshore projects account for the entire installed base, while offshore potential in the Caspian Sea and Persian Gulf remains untapped because of cost and technology barriers. MAPNA Group dominates turbine supply and project delivery after Western OEMs exited following the 2018 sanctions.
Key Report Takeaways
- By location, onshore wind captured 100.00% of the Iranian wind energy market share in 2025 and is set to expand at a 27.94% CAGR through 2031.
- By turbine capacity, units up to 3 MW held 61.40% of the Iranian wind energy market share in 2025, while the 3-to-6 MW class is forecast to rise at a 33.10% CAGR to 2031.
- By application, utility-scale projects accounted for 84.10% of the Iranian wind energy market size in 2025 and are advancing at a 29.45% CAGR through 2031.
- Domestic manufacturer MAPNA, together with MahTaab, supplied 62% of commissioned turbines in 2024, underlining a fragmented yet increasingly indigenous competitive field in the Iranian wind energy market.
Note: Market size and forecast figures in this report are generated using Mordor Intelligence’s proprietary estimation framework, updated with the latest available data and insights as of 2026.
Iran Wind Energy Market Trends and Insights
Drivers Impact Analysis*
| Driver | (~) % Impact on CAGR Forecast | Geographic Relevance | Impact Timeline |
|---|---|---|---|
| Government 10-GW 2025 target & SATBA incentives | 6.2% | National, concentrated in Sistan-Baluchestan, Qazvin, Khorasan, East Azerbaijan | Medium term (2-4 years) |
| Growing power-supply deficit & load-shedding pressure | 8.5% | National, acute in Tehran, Isfahan, industrial provinces | Short term (≤ 2 years) |
| >100 GW high-quality wind resource identified in NW & SE | 3.8% | Northwest (Gilan, East Azerbaijan, Ardabil) and Southeast (Sistan-Baluchestan) | Long term (≥ 4 years) |
| Record 85% capacity-factor Mil Nader project proves bankability | 4.1% | National, demonstration effect strongest in SE Iran (Sistan-Baluchestan) | Medium term (2-4 years) |
| Tradable 20-yr PPAs on IRENEX unlock local financing | 5.3% | National, benefits projects >10 MW with grid access | Long term (≥ 4 years) |
| Hybrid micro-grid demand in remote diesel-served provinces | 2.4% | Border provinces (Sistan-Baluchestan, Kurdistan, South Khorasan), remote areas beyond 50 km from grid | Medium term (2-4 years) |
| Source: Mordor Intelligence | |||
Government 10-GW Target & SATBA Incentives Accelerate Procurement
Iran’s Seventh National Development Plan calls for 30,000 MW of renewables by 2030, including 5,000 MW of wind. SATBA signed 11 GW of MoUs with private developers in 2024, and new rules in December 2024 reduced licensing hurdles and opened National Development Fund credit lines.(1)“SATBA seeking investors to develop renewable power plants,” Tehran Times, tehrantimes.com The 9.5 ¢/kWh tariff valid for 4.5 years cushions exchange-rate swings, while tradable PPAs create price discovery on IRENEX. Together, these measures draw domestic capital into the Iranian wind energy market and lessen reliance on scarce foreign financing. The program also prioritizes high-wind regions, which supports rapid capacity gains through 2030.
Growing Power-Supply Deficit & Load-Shedding Pressure Drive Urgency
Operational capacity stood near 62,000 MW in 2024 against peaks up to 80,000 MW, leaving gaps that produced blackouts in Tehran and factory shutdowns in Isfahan. Gas shortages forced plants to burn diesel, raising costs and emissions. Grid losses of 13% compound the shortage. High-quality wind in Sistan-Baluchestan supplies power during hot summer peaks, easing pressure on thermal units. Facing public outcry, regulators accelerated license approvals, which pushes new onshore wind into the Iranian wind energy market quicker than earlier plans predicted.
Record 85% Capacity-Factor Mil Nader Project Proves Bankability
The 50 MW Mil Nader farm posted an 85.49% first-month capacity factor in June 2024, matching offshore benchmarks.(2)MAPNA Group, “Mil Nader Record,” mapnagroup.com Domestic 2.5 MW turbines delivered the performance, easing technology-risk concerns among local banks that lend at rates above 24%. MAPNA intends to scale the site toward 600-700 MW, showing how proven resources can unlock utility-scale investment. Successful operation has raised confidence across the Iranian wind energy market and is influencing SATBA site choices for future rounds.
Tradable 20-Year PPAs on IRENEX Unlock Local Financing
IRENEX moved 232 million kWh of renewable electricity during March-July 2024 at an average 7.7 ¢/kWh, giving developers a secondary revenue stream.(3)IRENEX, “Renewable PPA Trading,” iremax.ir The exchange mitigates single-buyer risk and allows sales to industrial users and crypto miners ready to pay premiums for a stable supply. Twenty-year contracts match turbine life and satisfy bank tenors. Although lender step-in rights remain weak, the mechanism strengthens cash flow forecasts and broadens the funding base for large projects in the Iranian wind energy market.
Restraints Impact Analysis*
| Restraint | (~) % Impact on CAGR Forecast | Geographic Relevance | Impact Timeline |
|---|---|---|---|
| Feed-in-tariff erosion to 3¢/kWh post-Rial devaluation | -4.2% | National, affects all projects relying on FiT revenue | Short term (≤ 2 years) |
| US/EU sanctions restricting foreign capital & turbines | -7.8% | National, affects all projects requiring imported components or foreign financing | Long term (≥ 4 years) |
| High domestic borrowing costs (>24%) dampen project IRR | -5.4% | National, most acute for developers without government-linked bank access | Medium term (2-4 years) |
| Grid bottlenecks in desert provinces causing curtailment | -3.1% | Desert provinces (South Khorasan, Yazd, Kerman), areas >50 km from substations | Medium term (2-4 years) |
| Source: Mordor Intelligence | |||
High Domestic Borrowing Costs Dampen Project IRR
Bank lending rates above 24% erode project returns, making many proposals unbankable unless sponsors tap concessional National Development Fund loans.(4)International Energy Agency, “Renewables 2024: Analysis and forecast to 2030,” iea.org Inflation and Rial volatility force costs to be denominated in local currency even when inputs are priced in USD. Weak step-in rights deter genuine project-finance structures, so developers rely on balance-sheet funding. This environment limits participation by smaller firms and restricts diversification within the Iranian wind energy industry.
US/EU Sanctions Restricting Foreign Capital & Turbines
Executive Order 13846 and EU Regulation 267/2012 block Western turbine exports and choke international insurance and payment channels. Vestas, Siemens Gamesa, GE Vernova, and Nordex exited after 2018, removing high-capacity machines from the pipeline. Chinese OEMs have stayed cautious because of secondary sanctions, leaving MAPNA’s 2.5 MW platform as the primary option. The cap on available turbine ratings raises balance-of-system costs and slows technology upgrades across the Iranian wind energy market.
*Our forecasts treat driver/restraint impacts as directional, not additive. The impact forecasts reflect baseline growth, mix effects, and variable interactions.
Segment Analysis
By Location: Onshore Monopoly Masks Offshore Potential
Onshore wind contributes 100% of installed capacity and is forecast to rise from 430 MW in 2025 to 1,880 MW by 2031, matching the overall Iran wind energy market CAGR. The Iran wind energy market size for onshore projects benefits from proven corridors in Sistan-Baluchestan, Qazvin, Khorasan, and East Azerbaijan. Developers favor land within 50 km of substations to avoid costly transmission upgrades. Offshore resources in the Caspian Sea and Persian Gulf show technical promise but remain untouched because Iran lacks offshore-rated turbines, installation vessels, and specialized cabling. Current capital costs run two to three times higher than onshore, a hurdle under domestic borrowing rates exceeding 24%. Grid planners therefore prioritize onshore expansions that can use local manufacturing and that align with SATBA’s streamlined licensing. Without sanctions relief or a targeted subsidy, offshore wind is unlikely to enter the Iranian wind energy market before 2030.
Although policy still favors onshore build-out, provincial governments along the Caspian coast continue technical assessments of monopile and gravity-base foundations in water depths under 50 m. Deeper zones would need floating platforms, but no domestic yard can fabricate them yet. If offshore prototypes emerge after 2027, they may unlock larger rotor diameters that lower levelized costs, but such gains depend on relaxed export controls for advanced composites. Until then, onshore remains the sole growth engine for the Iranian wind energy market.




By Turbine Capacity: Shift to 3-6 MW Segment Reflects Efficiency Push
Units up to 3 MW held a 61.40% Iran wind energy market share in 2025, but their growth will trail larger machines. The 3-to-6 MW class is forecast to expand at 33.10% CAGR, fueled by higher hub heights, fewer foundations, and lower maintenance costs. The Iranian wind energy market size for this class will climb once MAPNA commercializes its planned 4.5 MW platform. Imports of Siemens Gamesa 3.2 MW machines before 2018 continue to show favorable performance at Siahpoush and are slated for the 99.2 MW Tizbaad project. Lack of fresh imports limits supply, but domestic reverse-engineering may fill part of the gap.
Supply constraints place a ceiling on the above-6 MW segment, which remains at zero capacity. Blades longer than 65 m need carbon fiber and precision pitch systems restricted by export bans. Absent Chinese entry or sanction relief, developers will keep optimizing 3-to-6 MW layouts. Even within those limits, turbines above 3 MW can cut balance-of-plant costs by reducing the number of pads and cables per megawatt, making them the fastest-growing slice of the Iranian wind energy market.
By Application: Utility-Scale Dominance Reflects Grid-Priority Policy
Utility-scale farms contributed 84.10% of installed capacity in 2025 and will grow at 29.45% CAGR through 2031, mirroring SATBA’s concentration on projects of 50-100 MW or larger. This focus lets planners address the 20,000 MW deficit quickly and justify new 400 kV lines. Developers also gain the option to sell excess output on IRENEX, which strengthens revenue stability. The Iranian wind energy market size for utility projects, therefore, dominates the landscape and is expected to keep its lead.
Commercial-and-industrial schemes are hampered by the absence of net-metering and by elevated borrowing costs. Only large firms such as Mobarakeh Steel have financed renewable plants for captive loads. Community wind remains negligible because there is no cooperative finance model and limited policy support. Hybrid microgrids of 1-5 MW may emerge in border provinces, but they will add a small fraction to the Iranian wind energy market by 2030.

Geography Analysis
Sistan-Baluchestan leads new capacity thanks to the 120-day winds that gave Mil Nader its 85.49% capacity factor. East Azerbaijan, Gilan, and Ardabil host most legacy farms and enjoy proximity to Tehran and Tabriz load centers, which lowers transmission losses. Qazvin contains the 61.2 MW Siahpoush farm and is earmarked for further MAPNA projects that will lift regional totals. Khorasan offers strong resources, but bottlenecks at remote substations slow build-out.
Caspian provinces have begun offshore assessments yet face modest wind speeds at 4.5-5.8 m/s near shore. Southern coasts in Bushehr and Hormozgan exhibit stronger winds but need floating foundations because depths exceed 400 m after the first 50 km. Without specialized vessels or financial incentives, offshore remains a post-2030 possibility. Central provinces such as Isfahan and Yazd show moderate wind and are better suited for solar-wind hybrids that serve factories or isolated communities.
Through 2030, capital will cluster in Sistan-Baluchestan, Qazvin, Khorasan, and East Azerbaijan, where capacity factors exceed 40% and existing grids can absorb new megawatts. Provinces outside these corridors may require premium feed-in tariffs or transmission grants to attract developers, especially as the Iranian wind energy market races toward the 5 GW national target.
Regulatory Landscape
Renewable power development in Iran is primarily governed by SATBA under the Ministry of Energy, which acts as the counterparty for standardized renewable procurement and project development processes. Wind developers typically progress through SATBA permitting and must secure an environmental impact assessment clearance from the Department of Environment, alongside grid-connection approvals coordinated through Tavanir for interconnection and dispatch requirements.
The commercial framework continues to center on long-tenor contracting, combining a guaranteed purchase structure and 20-year PPAs, including tradable PPAs enabled through the Iran Energy Exchange (IRENEX) as cited in the market context. In April 2026, notified renewable-development rules aimed at removing administrative obstacles (including land acquisition and financing facilitation) reinforced the state-led push to convert more licensed projects into buildable pipelines, while also tightening process discipline around readiness and compliance milestones needed for settlement and commercial operation.
Competitive Landscape
MAPNA Group anchors the Iranian wind energy market through vertically integrated manufacturing and a 3 GW development memorandum with SATBA.Its domestic 2.5 MW turbine line, EPC services, and power-plant operation give it scale advantages and secure National Development Fund backing. MahTaab Group, SUNIR, Saba Niroo, and Ghods Niroo hold smaller project portfolios and often rely on MAPNA equipment. Component gaps in blades, towers, and generators open space for firms such as Sadid Industrial Group to expand local supply under sanctions.
Strategic moves focus on vertical integration and captive-demand models. MAPNA extended from manufacturing into project ownership, while Mobarakeh Steel is financing a 600 MW solar project to hedge grid risk, a template that can translate to wind. Chinese involvement is limited, yet a January 2025 memorandum with Hainan Elite Energy signals potential entry if sanctions ease.(5)“Private sector to build 11,000 MW of renewable power plants in Iran,” Tehran Times, tehrantimes.com Technology leadership now centers on capacity-factor optimization at high-wind sites rather than on larger turbine ratings.
Policy uncertainty over feed-in tariffs and payment delays keeps smaller firms cautious. Banks give preference to projects backed by MAPNA or state-linked entities. As a result, market concentration is expected to stay high through 2030 even if new domestic EPC entrants emerge.
Iran Wind Energy Industry Leaders
MAPNA Group
MahTaab Group
General Electric Company
Vestas Wind Systems AS
Siemens Gamesa Renewable Energy SA
- *Disclaimer: Major Players sorted in no particular order

Market Opportunities and Future Outlook
Wind deployment in Iran shows clear whitespace around converting signed developer interest into commissioned projects, especially in provinces where high-quality resources overlap with grid access, such as Sistan-Baluchestan and Qazvin. Evidence through mid-2026 indicates renewables exceeding 3,700 MW in total installed capacity, with wind representing about 29% of that portfolio, leaving wind with a sizable share within national clean-power additions even as solar leads the mix. SATBA also disclosed 2,878 MW of renewable projects across 26 provinces, pointing to an active project pipeline in which wind competes for grid capacity, equipment, and financing.
Near-term opportunity clusters include (i) utility-scale, high-capacity-factor corridors such as the Mil Nader area, where MAPNA has progressed from the initial Mil Nader project into the 100 MW Mil Nader 2 build, and (ii) bankability improvements tied to tradable PPAs and exchange-based offtake that broaden buyer access beyond a single state purchaser. A second gap is domestic industrial demand, where large consumers and public entities can contract for renewable electricity through market mechanisms, supported by policy direction cited in recent reporting that mandates increased renewable sourcing for large users. Where grid injection and metering prerequisites are met, this can translate into additional PPA-backed wind volumes.
Recent Industry Developments
- April 2026: SATBA reported a near-term grid-integration pipeline in which several new wind and solar projects were slated to connect by July 2026. The update highlighted government efforts to accelerate commissioning timelines and prioritize projects that can clear grid, metering, and settlement requirements.
- December 2025: MAPNA Group started executive operations for the 100 MW Mil Nader 2 wind farm in Sistan and Baluchestan province. Moving from performance proof points at Mil Nader into a follow-on build supports the domestic supply-and-EPC route for utility-scale wind under sanctions-constrained import options.
- August 2025: MAPNA Group completed rotor installation for a domestically designed and manufactured 2 MW wind turbine in Iran. The milestone supports localization of critical turbine subassemblies and helps widen the feasible project set where imported components, insurance, and payment channels are constrained.


Research Methodology Framework and Report Scope
Market Definition and Coverage
For this methodology, the Iran wind energy market is defined as the total installed wind power capacity connected in Iran, counted in gigawatts, including new builds and expansions commissioned during the study period.
Scope exclusions: Off grid wind systems and pure engineering services that do not result in commissioned capacity are excluded from the market total.
Segmentation Overview
- By Location
- Onshore
- Offshore
- By Turbine Capacity
- Up to 3 MW
- 3 to 6 MW
- Above 6 MW
- By Application
- Utility-scale
- Commercial and Industrial
- Community Projects
- By Component (Qualitative Analysis)
- Nacelle/Turbine
- Blade
- Tower
- Generator and Gearbox
- Balance-of-System
Data Sources, Market Sizing, and Validation
Desk Research
Desk work starts by building a clean view of historical and current wind capacity in Iran, then mapping it to commissioning timelines and the policy signals that affect additions. We primarily use public energy statistics and policy sources such as IRENA capacity series, IEA and World Bank energy indicators, and government or regulator publications related to renewable procurement and grid connection rules.
To keep the market model grounded, we also review turbine and project announcements in reputed press, association websites, and publicly available company presentations where capacity and COD timing are discussed. When needed, paid subscriptions for company financials and news intelligence are used to cross-check developer activity, and patent databases are used to confirm local technology work without treating it as installed capacity. The sources listed here are illustrative only, and many other public documents were reviewed to collect data, validate assumptions, and clarify gaps.
Primary Interviews and Surveys
We interview developers, turbine specialists, utilities, regulators, financiers, and maintenance managers in Iran. Interviews and surveys test additions, delays, turbine capacity, grid access, utilization, and procurement assumptions, helping us fill desk-research gaps. Responses are compared across roles before the estimate is adjusted.
Distribution of primary research fieldwork respondents
| Company type | Respondent position |
|---|---|
| Top tier: 28% | CXOs: 15% |
| Mid tier: 47% | Functional/Unit leaders: 34% |
| Smaller Players: 25% | Managers: 51% |
Market-Sizing & Forecasting
Sizing is built using a top-down approach where national installed wind capacity series and announced commissioning schedules are reconstructed into yearly additions, then filtered through grid connection readiness and expected slippage. The totals are then checked with selective bottom-up approximations, such as sampling project pipelines and applying typical turbine rating mixes to validate how much capacity can realistically come online.
The model uses a small set of indicators that matter for Iran wind additions, including reported installed capacity (MW), project COD timing, turbine size bands used in tenders, grid connection availability in windy provinces, and the pace of renewable procurement and incentive clarity. To avoid overstatement, gaps are handled by applying conservative conversion from announced to commissioned capacity when permitting or financing looks uncertain, then re-testing the same assumptions during expert calls.
For forecasting, scenario analysis is used because build rates can change quickly with policy and grid conditions. We set a base case from confirmed pipeline and realistic commissioning lags, then stress-test it with upside and downside cases informed by primary feedback on procurement continuity, import constraints, and execution timelines.
Data Validation & Update Cycle
Validation is done in steps, starting with consistency checks between the modeled capacity totals and independent capacity series, then moving to reasonableness checks against project timelines and typical annual build capability. When a variance is flagged, the assumption is revisited, and respondents are re-contacted if the gap is linked to a specific project wave or a policy change.
Before sign-off, another analyst reviews the calculations, the inputs, and the year-by-year logic so errors from double counting or timing shifts are caught early. Reports are refreshed annually, and interim updates are made when there are material events like major tender announcements, large project delays, or rule changes affecting grid connection. Right before delivery, we do a final pass to ensure the numbers and narrative reflect the latest public signals.
Mordor Intelligence's Iran Wind Energy Market Size Versus Other Published Estimates
Published market sizes for Iran wind energy can look far apart because some sources size revenue across the value chain, while others size installed capacity, and the two do not track together every year. Differences also come from how each study treats timing, since project announcements can be counted early even when commissioning shifts.
Installed-capacity series, grid-connection confirmations, and project COD checks are used to keep Mordor Intelligence tied to commissioned GW (0.43 GW in 2025), which avoids mixing equipment and service revenues into the same market total.
Benchmark comparison
| Source | Market Size | Gaps in Research Methodology |
|---|---|---|
| Mordor Intelligence | USD 0.43 B (2025) | |
| Global Consultancy A | USD 0.74 B (2024) | Uses a value-based market definition in USD that can bundle turbine sales, EPC, and O&M activities, which makes the number structurally higher than a commissioned-capacity total. |
| Regional Consultancy B | USD 0.90 B (2026) | Counts broader value-chain revenue and may apply faster price and build-rate assumptions into the forecast year, which can lift the estimate even if capacity commissioning is delayed. |
The spread in the table mainly comes from mixing different units and boundaries, not just different math. By keeping the total anchored to commissioned capacity and checking it against independent capacity reporting plus real project timing, our estimate stays traceable to inputs that a client team can re-check and update.


Key Questions Answered in the Report
What is the current Iran wind energy market size and growth outlook?
The Iran wind energy market size reached 550 MW in 2026 and is forecast to hit 1,880 MW by 2031, under a 27.94% CAGR.
What is driving near-term growth in Iranian wind projects?
A 20,000 MW power deficit, rolling blackouts, and a 9.5 ¢/kWh feed-in tariff backed by tradable PPAs are accelerating project approvals.
Which turbine segment is expected to grow fastest?
The 3-to-6 MW class is forecast to expand at 33.10% CAGR to 2031 because it offers higher hub heights and lower balance-of-system costs.
Why is offshore wind still absent in Iran?
Lack of offshore-rated turbines, installation vessels, and financing under sanctions keeps costs high and delays development.
Who leads domestic turbine manufacturing?
MAPNA Group manufactures 2.5 MW machines, operates flagship farms like Mil Nader, and holds a 3 GW development agreement with SATBA.
What financing tools support new wind farms?
Developers combine the 9.5 ¢/kWh feed-in tariff with 20-year PPAs tradable on IRENEX and may access National Development Fund loans at concessional rates.
Page last updated on:


 Your data is secure and never sold or shared.


